
Hello there, crypto enthusiasts and financial futurists! Welcome to our deep dive on a topic that sparks as much excitement as it does debate – the Ethereum price prediction for 2024-2030. This price prediction aims to provide you with a thoughtful analysis of Ethereum’s possible trajectory, taking into account the complexities and uncertainties that go hand in hand with such predictions.
Predicting the price of ETH – or any cryptocurrency, for that matter – is akin to weather forecasting in a world of ever-changing climate patterns. Yet, it’s a challenge we’re ready to tackle. To do so, we’ll journey back in time to Ethereum’s roots, tracing its origin, purpose, and milestones. Alongside this historical approach, we’ll harness the power of the very methods and tools employed by seasoned traders and market analysts in their attempts to foresee ETH’s financial future.
Why this rollercoaster ride of price prediction, you might wonder? Well, Ethereum isn’t just another crypto; it’s a digital asset that has reshaped the world of decentralized finance. Understanding its potential trajectory isn’t merely a fun exercise—it’s crucial for good investment decisions, strategic planning, and getting a grip on where the world of blockchain is heading.
So, are you ready to journey into the future? Whether you’re an investor, a blockchain enthusiast, or simply curious about the possibilities that Ethereum holds, this piece promises to be an enlightening read. Buckle up and prepare to delve into a world where finance, technology, and price prediction intertwine. The world of Ethereum price prediction awaits!
Ethereum (ETH) Overview
| ETH Price | $2,940.80 |
| ETH Price Change 24h | -2.12% |
| ETH Price Change 7d | 17.34% |
| ETH Market Cap | $354,999,116,641.75 |
| ETH Circulating Supply | 120,715,200.35 |
| ETH Trading Volume | $19,686,096,838.02 |
| ETH All-Time High (ATH) | $4,891.70 |
| ETH All-Time Low (ATL) | $0.4209 |
A Brief History: Ethereum Functionality and Its Purpose
Let’s wind back the clock and embark on a quick journey through Ethereum’s colorful past. Ethereum – a name that’s now synonymous with blockchain innovation and DeFi – was first introduced to the world in 2013. Invented by the wunderkind Vitalik Buterin, Ethereum blockchain was more than just a cryptocurrency – it was a platform designed to host decentralized applications (dApps), providing developers worldwide with a whole new sandbox to play in, and challenging the very notions of traditional finance and internet.
Ethereum’s essence was to usher in the “internet of value”. It aimed to democratize finance by allowing anyone, anywhere, to create and manage digital assets without intermediaries. This ambitious vision, embodied by its native currency, Ether (ETH), quickly caught the imagination of investors and tech visionaries alike.
Now, shifting our gaze to the monetary aspects of Ethereum blockchain, the ETH token’s financial journey has been nothing short of a rollercoaster ride, echoing the volatile nature of crypto markets. Below, you’ll find an overview of some key price landmarks ETH has journeyed through:
- Ethereum’s Initial Coin Offering (ICO) in 2014 had each ETH valued at approximately $0.30.
- In the January 2018 crypto boom, Ethereum reached an impressive peak of around $1,400.
- The crypto winter that followed saw Ethereum cost plummet to nearly $85 by December 2018.
- Ethereum experienced a revival during the DeFi summer of 2020, pushing ETH price over the $400 mark.
- In 2021, amidst a raging bull market, Ethereum (ETH) price soared to new heights, breaching the $4,000 threshold.
This thrilling journey, laden with meteoric ascents and nerve-wracking descents, paints a clear picture: Ethereum, like other cryptocurrencies, is a dynamic beast. ETH price is swayed by a multitude of factors, from market sentiment and regulatory news to technological advancements and wider economic trends.
In essence, understanding Ethereum and its historical price journey isn’t just about understanding a cryptocurrency; it’s about understanding a transformative technology that’s shaping the future of finance. As we turn our gaze forward to make our Ethereum price prediction, this context will be invaluable. Remember, the past often holds clues to the future, and in the world of crypto, these clues might just make all the difference.
Ethereum – ETH Price Prediction For Today, Tomorrow, This Week, and Next 30 Days
| Date | Price | Change |
|---|---|---|
| July 13, 2025 | 2,956.68 | 0.54% |
| July 14, 2025 | 2,980.63 | 0.81% |
| July 15, 2025 | 2,993.74 | 0.44% |
| July 16, 2025 | 2,998.53 | 0.16% |
| July 17, 2025 | 2,988.64 | -0.33% |
| July 18, 2025 | 2,986.55 | -0.07% |
| July 19, 2025 | 2,961.76 | -0.83% |
| July 20, 2025 | 2,946.06 | -0.53% |
| July 21, 2025 | 2,945.77 | -0.01% |
| July 22, 2025 | 2,916.90 | -0.98% |
| July 23, 2025 | 2,910.48 | -0.22% |
| July 24, 2025 | 2,914.26 | 0.13% |
| July 25, 2025 | 2,914.85 | 0.02% |
| July 26, 2025 | 2,940.21 | 0.87% |
| July 27, 2025 | 2,948.73 | 0.29% |
| July 28, 2025 | 2,955.81 | 0.24% |
| July 29, 2025 | 2,955.81 | 0.00% |
| July 30, 2025 | 2,981.53 | 0.87% |
| July 31, 2025 | 2,987.49 | 0.20% |
| August 01, 2025 | 3,008.70 | 0.71% |
| August 02, 2025 | 3,038.79 | 1.00% |
| August 03, 2025 | 3,050.03 | 0.37% |
| August 04, 2025 | 3,035.39 | -0.48% |
| August 05, 2025 | 3,024.46 | -0.36% |
| August 06, 2025 | 3,000.27 | -0.80% |
| August 07, 2025 | 2,999.37 | -0.03% |
| August 08, 2025 | 2,975.07 | -0.81% |
| August 09, 2025 | 2,985.49 | 0.35% |
| August 10, 2025 | 2,981.01 | -0.15% |
| August 11, 2025 | 2,980.11 | -0.03% |
Ethereum Price Prediction 2024
After analyzing Ethereum future price data for 2024, we found that the projected minimum price is $2,646.72, while the average and maximum prices are $3,087.84 and $3,528.96, respectively.
Our assessment of future returns based on this data suggests that Ethereum price prediction for 2024 is relatively stable, with moderate growth expected.
The narrow price range implies that the market may not anticipate significant fluctuations in value, but there is still potential for substantial returns for those willing to take on high risks associated with investing in Ethereum.
Nonetheless, cryptocurrency investors must be cautious and carry out thorough research before making any investment decisions in this space due to the historical volatility of cryptocurrencies and the continuously evolving market landscape.
| Month | Minimum Price | Average Price | Maximum Price |
|---|---|---|---|
| February 2024 | 2,243.88 | 2,330.09 | 2,425.62 |
| March 2024 | 2,304.46 | 2,393.00 | 2,491.11 |
| April 2024 | 2,366.68 | 2,457.61 | 2,558.37 |
| May 2024 | 2,430.58 | 2,523.97 | 2,627.45 |
| June 2024 | 2,496.21 | 2,592.11 | 2,698.39 |
| July 2024 | 2,563.60 | 2,662.10 | 2,771.25 |
| August 2024 | 2,632.82 | 2,733.98 | 2,846.07 |
| September 2024 | 2,703.91 | 2,807.80 | 2,922.92 |
| October 2024 | 2,776.91 | 2,883.61 | 3,001.83 |
| November 2024 | 2,851.89 | 2,961.46 | 3,082.88 |
| December 2024 | 2,928.89 | 3,041.42 | 3,166.12 |
| January 2025 | 3,007.97 | 3,123.54 | 3,251.61 |
January 2024: Ethereum Price Forecast
As we dive into 2024, Ethereum shows promising trends. We anticipate a minimum price of $2,176.78, suggesting a solid base for investors. The average price hovers around $2,280.04, indicating steady market confidence. For those eyeing the peak, a maximum of $2,368.61 could be the zenith this month. These figures point towards a resilient Ethereum market as we kickstart the year.
ETH Price Forecast for February 2024
Moving into February, Ethereum continues its upward trajectory. Our analysis forecasts a floor price of $2,243.88, reflecting growing investor interest. The average trading price is expected to be around $2,330.09, showcasing a robust market. Highs could reach up to $2,425.62, signaling potential lucrative opportunities for timely investors.
March 2024: Ethereum Price Forecast
March looks promising for Ethereum enthusiasts. We’re looking at a minimum price of $2,304.46, further cementing Ethereum’s market strength. The average price is likely to orbit around $2,393.00, demonstrating consistent growth. Moreover, a maximum price reaching $2,491.11 could be on the horizon, offering a significant upside for savvy traders.
ETH Price Forecast for April 2024
April’s forecast for Ethereum hints at continued progress. A minimum price of $2,366.68 sets a strong foundation for the month. An average price of $2,457.61 could be the new normal, indicating sustained investor trust. And with a possible maximum of $2,558.37, April could be a golden month for Ethereum investments.
May 2024: Ethereum Price Forecast
As we step into May, Ethereum’s market dynamics seem increasingly favorable. The minimum price is expected to be around $2,430.58, showcasing a sturdy market base. An average price of $2,523.97 reflects ongoing market optimism. Peaking at potentially $2,627.45, May could offer significant gains for Ethereum stakeholders.
ETH Price Forecast for June 2024
June’s outlook for Ethereum paints a bullish picture. With a minimum price projection of $2,496.21, it’s clear that the market base is strengthening. The average price is anticipated to be around $2,592.11, suggesting a stable market sentiment. A maximum price of $2,698.39 could provide lucrative opportunities for investors riding the bullish wave.
July 2024: Ethereum Price Forecast
July foresees a continuing uptrend for Ethereum. The forecast indicates a minimum price of $2,563.60, consolidating its market position. Averaging at about $2,662.10, the market shows no signs of slowing down. And with a maximum price possibility of $2,771.25, July could be a hotspot for Ethereum trading.
ETH Price Forecast for August 2024
August brings an optimistic forecast for Ethereum. The minimum price is expected to climb to $2,632.82, reflecting a robust market foundation. The average price might reach around $2,733.98, underscoring steady market growth. A maximum of $2,846.07 could be within reach, offering potential high returns for investors.
September 2024: Ethereum Price Forecast
In September, Ethereum continues to exhibit strength. The month might open with a minimum price of $2,703.91, affirming a strong investor base. An average price of $2,807.80 indicates a healthy and growing market. The potential peak at $2,922.92 could be a target for those looking for substantial returns.
ETH Price Forecast for October 2024
October’s Ethereum market looks quite promising. We’re looking at a starting price of $2,776.91, suggesting a solid base. The average price, hovering around $2,883.61, indicates a confident market. A maximum price touching $3,001.83 could spell good news for Ethereum investors looking for growth.
November 2024: Ethereum Price Forecast
As we near the end of 2024, Ethereum maintains its momentum. November could see a minimum price of $2,851.89, maintaining its sturdy market presence. An average price of $2,961.46 points to a continually maturing market. The month could peak at $3,082.88, providing an exciting opportunity for investors.
ETH Price Forecast for December 2024
Wrapping up the year, December’s Ethereum forecast looks quite optimistic. A minimum price of $2,928.89 indicates a solid year-end position. The average price could settle around $3,041.42, reflecting sustained market health. And with a maximum price of $3,166.12, December could offer a grand finale for Ethereum’s yearly performance.
Ethereum Price Prediction 2025
As the calendar flips to 2025, Ethereum market continues its robust performance, according to our Ethereum (ETH) price predictions. We anticipate a minimum price point of $2946.22, an average price of $3495.36, and under optimum conditions, a potential maximum price of $4157.14.
| Month | Minimum Price | Average Price | Maximum Price |
|---|---|---|---|
| February 2025 | 2,946.22 | 3,059.42 | 3,184.86 |
| March 2025 | 3,025.77 | 3,142.03 | 3,270.85 |
| April 2025 | 3,107.47 | 3,226.86 | 3,359.16 |
| May 2025 | 3,191.37 | 3,313.99 | 3,449.86 |
| June 2025 | 3,277.54 | 3,403.46 | 3,543.01 |
| July 2025 | 3,366.03 | 3,495.36 | 3,638.67 |
| August 2025 | 3,456.91 | 3,589.73 | 3,736.91 |
| September 2025 | 3,550.25 | 3,686.66 | 3,837.81 |
| October 2025 | 3,646.11 | 3,786.20 | 3,941.43 |
| November 2025 | 3,744.55 | 3,888.42 | 4,047.85 |
| December 2025 | 3,845.65 | 3,993.41 | 4,157.14 |
| January 2026 | 3,949.49 | 4,101.23 | 4,269.38 |
Ethereum Price Prediction 2026
Heading into 2026, we expect Ethereum to maintain this ascending trajectory. Our price predictions suggest a minimum price of $3906.05, with a yearly average price settling around $4634.08. On the higher end, Ethereum could hit $5511.46.
| Month | Minimum Price | Average Price | Maximum Price |
|---|---|---|---|
| February 2026 | 3,906.05 | 4,056.13 | 4,222.43 |
| March 2026 | 4,011.51 | 4,165.64 | 4,336.43 |
| April 2026 | 4,119.82 | 4,278.11 | 4,453.52 |
| May 2026 | 4,231.06 | 4,393.62 | 4,573.76 |
| June 2026 | 4,345.30 | 4,512.25 | 4,697.25 |
| July 2026 | 4,462.62 | 4,634.08 | 4,824.08 |
| August 2026 | 4,583.11 | 4,759.20 | 4,954.33 |
| September 2026 | 4,706.86 | 4,887.70 | 5,088.10 |
| October 2026 | 4,833.94 | 5,019.67 | 5,225.47 |
| November 2026 | 4,964.46 | 5,155.20 | 5,366.56 |
| December 2026 | 5,098.50 | 5,294.39 | 5,511.46 |
| January 2027 | 5,236.16 | 5,437.34 | 5,660.27 |
Ethereum Price Prediction 2027
Moving onto 2027, our price prediction models predict an upward momentum for Ethereum market, with the minimum price edging up to $5178.57, and the average price projected at $6143.78. If the winds of the crypto market blow in the right direction, the maximum price could reach $7306.99.
| Month | Minimum Price | Average Price | Maximum Price |
|---|---|---|---|
| February 2027 | 5,178.57 | 5,377.54 | 5,598.02 |
| March 2027 | 5,318.39 | 5,522.73 | 5,749.16 |
| April 2027 | 5,461.99 | 5,671.84 | 5,904.39 |
| May 2027 | 5,609.46 | 5,824.98 | 6,063.81 |
| June 2027 | 5,760.91 | 5,982.26 | 6,227.53 |
| July 2027 | 5,916.46 | 6,143.78 | 6,395.67 |
| August 2027 | 6,076.20 | 6,309.66 | 6,568.36 |
| September 2027 | 6,240.26 | 6,480.02 | 6,745.70 |
| October 2027 | 6,408.75 | 6,654.98 | 6,927.84 |
| November 2027 | 6,581.78 | 6,834.67 | 7,114.89 |
| December 2027 | 6,759.49 | 7,019.20 | 7,306.99 |
| January 2028 | 6,942.00 | 7,208.72 | 7,504.28 |
Ethereum Price Prediction 2028
By 2028, our price predictions point to a continuing rise in Ethereum’s value. We foresee a minimum price of $6865.64, an average price of about $8145.3, and under the right circumstances, a whopping maximum price of $9687.47.
| Month | Minimum Price | Average Price | Maximum Price |
|---|---|---|---|
| February 2028 | 6,865.64 | 7,129.43 | 7,421.74 |
| March 2028 | 7,051.02 | 7,321.93 | 7,622.13 |
| April 2028 | 7,241.39 | 7,519.62 | 7,827.93 |
| May 2028 | 7,436.91 | 7,722.65 | 8,039.28 |
| June 2028 | 7,637.71 | 7,931.16 | 8,256.34 |
| July 2028 | 7,843.93 | 8,145.30 | 8,479.26 |
| August 2028 | 8,055.71 | 8,365.23 | 8,708.20 |
| September 2028 | 8,273.22 | 8,591.09 | 8,943.32 |
| October 2028 | 8,496.59 | 8,823.05 | 9,184.79 |
| November 2028 | 8,726.00 | 9,061.27 | 9,432.78 |
| December 2028 | 8,961.60 | 9,305.92 | 9,687.47 |
| January 2029 | 9,203.57 | 9,557.18 | 9,949.03 |
Ethereum Price Prediction 2029
As we journey into 2029, Ethereum’s minimum price is expected to climb to $9102.34, while the average price could hover around $10798.89. Should crypto market trends remain favorable, Ethereum could realize a maximum price of $12843.46.
| Month | Minimum Price | Average Price | Maximum Price |
|---|---|---|---|
| February 2029 | 9,102.34 | 9,452.07 | 9,839.60 |
| March 2029 | 9,348.10 | 9,707.27 | 10,105.27 |
| April 2029 | 9,600.50 | 9,969.37 | 10,378.11 |
| May 2029 | 9,859.72 | 10,238.54 | 10,658.32 |
| June 2029 | 10,125.93 | 10,514.98 | 10,946.10 |
| July 2029 | 10,399.33 | 10,798.89 | 11,241.64 |
| August 2029 | 10,680.11 | 11,090.46 | 11,545.17 |
| September 2029 | 10,968.47 | 11,389.90 | 11,856.88 |
| October 2029 | 11,264.62 | 11,697.43 | 12,177.02 |
| November 2029 | 11,568.77 | 12,013.26 | 12,505.80 |
| December 2029 | 11,881.12 | 12,337.61 | 12,843.46 |
| January 2030 | 12,201.91 | 12,670.73 | 13,190.23 |
Ethereum Price Prediction 2030
In 2030, our experts project further growth for Ethereum, with the minimum price rising to $12067.7. Averaging out at $14316.95, the maximum price could hit an astonishing $17027.6, given the right market conditions.
| Month | Minimum Price | Average Price | Maximum Price |
|---|---|---|---|
| February 2030 | 12,067.70 | 12,531.36 | 13,045.15 |
| March 2030 | 12,393.53 | 12,869.71 | 13,397.37 |
| April 2030 | 12,728.15 | 13,217.19 | 13,759.10 |
| May 2030 | 13,071.81 | 13,574.05 | 14,130.59 |
| June 2030 | 13,424.75 | 13,940.55 | 14,512.12 |
| July 2030 | 13,787.22 | 14,316.95 | 14,903.94 |
| August 2030 | 14,159.48 | 14,703.51 | 15,306.35 |
| September 2030 | 14,541.78 | 15,100.50 | 15,719.62 |
| October 2030 | 14,934.41 | 15,508.21 | 16,144.05 |
| November 2030 | 15,337.64 | 15,926.94 | 16,579.94 |
| December 2030 | 15,751.76 | 16,356.96 | 17,027.60 |
| January 2031 | 16,177.05 | 16,798.60 | 17,487.34 |
Ethereum Price Prediction 2031
Progressing into 2031, Ethereum forecast shows no signs of slowing down. The minimum price is likely to be around $15999.12, with the average price coming in at $18981.13. The maximum price could soar to an impressive $22574.85.
| Month | Minimum Price | Average Price | Maximum Price |
|---|---|---|---|
| February 2031 | 15,999.12 | 16,613.83 | 17,295.00 |
| March 2031 | 16,431.09 | 17,062.40 | 17,761.96 |
| April 2031 | 16,874.73 | 17,523.09 | 18,241.54 |
| May 2031 | 17,330.35 | 17,996.21 | 18,734.06 |
| June 2031 | 17,798.27 | 18,482.11 | 19,239.88 |
| July 2031 | 18,278.83 | 18,981.13 | 19,759.35 |
| August 2031 | 18,772.35 | 19,493.62 | 20,292.86 |
| September 2031 | 19,279.21 | 20,019.94 | 20,840.76 |
| October 2031 | 19,799.75 | 20,560.48 | 21,403.46 |
| November 2031 | 20,334.34 | 21,115.62 | 21,981.36 |
| December 2031 | 20,883.37 | 21,685.74 | 22,574.85 |
| January 2032 | 21,447.22 | 22,271.25 | 23,184.37 |
Ethereum Price Prediction 2032
Lastly, by 2032, our Ethereum (ETH) price prediction indicates that ETH will continue its ascent. We predict a minimum price of $21211.32, an average trading price of $25164.81, and, in a bullish market, a potential maximum of $29929.3.
| Month | Minimum Price | Average Price | Maximum Price |
|---|---|---|---|
| February 2032 | 21,211.32 | 22,026.29 | 22,929.37 |
| March 2032 | 21,784.03 | 22,621.00 | 23,548.47 |
| April 2032 | 22,372.20 | 23,231.77 | 24,184.27 |
| May 2032 | 22,976.25 | 23,859.03 | 24,837.25 |
| June 2032 | 23,596.60 | 24,503.22 | 25,507.86 |
| July 2032 | 24,233.71 | 25,164.81 | 26,196.57 |
| August 2032 | 24,888.02 | 25,844.26 | 26,903.88 |
| September 2032 | 25,560.00 | 26,542.06 | 27,630.28 |
| October 2032 | 26,250.12 | 27,258.69 | 28,376.30 |
| November 2032 | 26,958.87 | 27,994.68 | 29,142.46 |
| December 2032 | 27,686.76 | 28,750.53 | 29,929.30 |
| January 2033 | 28,434.30 | 29,526.80 | 30,737.40 |
The Main Questions Of Critical Thinking When We Talk About Ethereum Price Forecast
Below are three critical thinking questions to deepen your own research and understanding of the price of ETH and the other factors influencing it:
- Interplay between Fundamental and Technical Analysis: How can a synergy between fundamental and technical analysis provide a more comprehensive price prediction of Ethereum’s rate? Can one approach be considered superior or do they mutually supplement each other?
- Regulatory Impact: Given the dynamic and complex regulatory environment of cryptocurrencies, how might changes in regulations, in key markets globally, affect the price of Ethereum? What if a major economy fully legitimizes crypto trading?
- Technological Advancements: Ethereum’s potential often ties to its underlying technology and its potential use cases. How advancements such as Ethereum 2.0 or the rise of DeFi and NFTs influence Ethereum’s future price?
Remember, these questions are designed to stimulate deeper thought and encourage you to consider different angles when thinking about Ethereum’s future price. As you mull over these questions, try to draw on various resources, including expert analysis, historical data, and current Ethereum price & market trends.
Ethereum (ETH) Future Price Predictions by Experts
When it comes to Ethereum forecast, it’s always fascinating to hear the perspectives of well-known financial experts and crypto experts too.
- Vitalik Buterin (Co-Founder of Ethereum): Buterin sees Ethereum growing beyond its current scope, with potential applications across a range of industries. With the introduction of Ethereum 2.0 and its ability to increase scalability and transaction speed, he anticipates a brighter future for Ethereum.

Vitalik Buterin
- Raoul Pal (Former Goldman Sachs Executive and Co-Founder of Real Vision) Ethereum price prediction: Pal is extremely bullish on Ethereum, stating in several interviews that he believes Ethereum could surpass Bitcoin in terms of market capitalization (market cap) due to its wider use cases and rapid growth in the DeFi and NFT sectors.
- Brian Schuster (Founder of Ark Capital LLC) Ethereum price prediction: Schuster suggests that Ethereum could reach $100,000 per coin if it becomes a store of value comparable to gold, emphasizing the potential for the complete transformation of existing market systems.
- Ryan Watkins (Research Analyst at Messari) Ethereum price prediction: Watkins points to Ethereum’s growing use in DeFi as a factor that could lead to significant price increases. He believes that as DeFi grows, the demand for ETH as a collateral asset could skyrocket, pushing the price higher.
- Mike Novogratz (CEO of Galaxy Digital) Ethereum price prediction: Novogratz, a well-known Bitcoin bull, is also bullish on Ethereum. He sees Ethereum as the backbone of the crypto economy, comparing it to a traditional software company that can generate ongoing revenue.
- Mark Cuban (Entrepreneur and Investor) Ethereum price prediction: Cuban is very optimistic about Ethereum, citing its smart contract functionality as a key advantage over Bitcoin. He believes that Ethereum’s blockchain technology can disrupt several industries, such as finance, logistics, and even legal contracts, to name a few.
- Changpeng Zhao (CEO of Binance) Ethereum price prediction: Zhao has repeatedly shown positive outlook for Ethereum due to its wide range of applications. He believes Ethereum has the potential to lead the future of cryptocurrencies as it is home to the majority of altcoins and the booming DeFi sector.

Changpeng Zhao
- Michael Sonnenshein (CEO of Grayscale Investments) Ethereum price prediction: Sonnenshein sees Ethereum as a transformative technology with the potential to revolutionize the financial industry. His firm’s Ethereum trust is a testament to the increasing institutional interest in Ethereum.
- Anthony Pompliano (Co-founder of Morgan Creek Digital Assets) Ethereum price prediction: Pompliano acknowledges Ethereum’s potential, primarily because of its smart contract functionality, which forms the foundation for the DeFi and NFT sectors. However, he is skeptical about its ability to remain decentralized with the move to Ethereum 2.0.
- Tim Draper (Venture Capitalist) Ethereum price prediction: Draper is optimistic about Ethereum’s future, especially with the recent Ethereum 2.0 upgrade. He believes the platform’s versatility and adaptability set it apart from other cryptocurrencies.
- Fred Wilson (Co-founder of Union Square Ventures) Ethereum price prediction: Fred Wilson is a well-known venture capitalist who sees a bright future for Ethereum. He believes Ethereum’s ability to execute smart contracts makes it a very valuable crypto asset. Wilson has hinted that Ethereum could overtake Bitcoin in the future due to its advanced functionalities.
- Charles Hoskinson (Co-founder of Ethereum, CEO of IOHK) Ethereum price prediction: Although Charles has moved on to work on Cardano, he still acknowledges Ethereum’s potential. He has emphasized the importance of Ethereum’s smart contract platform and how it has been instrumental in building the DeFi ecosystem.
- Laura Shin (Crypto journalist and host of the Unchained Podcast) Ethereum price prediction: Laura has consistently highlighted the impact of Ethereum on her podcast. She believes that Ethereum has opened up new possibilities with smart contracts and decentralized applications, setting the stage for a potential future of DeFi.
- Tom Lee (Managing Partner and the Head of Research at Fundstrat Global Advisors) Ethereum price prediction: Tom Lee, known for his spot-on predictions in the crypto space, sees Ethereum as a digital asset with substantial upside potential. He highlights Ethereum’s robust platform and the recent Ethereum 2.0 upgrade as key drivers for future growth.
- Adam Back (CEO of Blockstream) Ethereum price prediction: While a strong Bitcoin proponent, Adam Back also acknowledges Ethereum’s potential. He sees Ethereum as an innovative platform but believes it faces scalability issues. Back considers Ethereum’s move to proof-of-stake a risky venture but respects the team’s ambition and innovation.
Decoding the Charts: Technical Ethereum Price Prediction
Technical analysis is the riveting aspect of trading that gives us the pulse of the market. It’s like a seismograph detecting tremors and the magnitude of the seismic activity, helping us read the cryptic signs of the financial markets. Today, we delve deep into the crux of the matter – Ethereum’s technical price analysis. Grab your hard hats, fellow cryptonauts, because we’re going on a digital mining expedition.
Technical Indicators for Ethereum Price Prediction: Origin and Purpose
Our first stop is understanding the origin and purpose of technical indicators. These aren’t just numbers and lines on a screen – they are the DNA of the market. Born out of mathematical calculations using price and volume data, technical indicators have one sole purpose – to predict future price movements. Yes, they are the crystal balls of trading! The intriguing bit? No two indicators are alike. Each tells a unique story, giving us different perspectives of the market.
The Role of Technical Indicators in Ethereum Price Prediction
You may ask, “So, what role do these indicators play in the financial markets?” Picture them as the compass guiding traders through the financial wilderness. They help traders identify where the price might be heading, gauge price volatility, and get a sense of market sentiment. Consider the Relative Strength Index (RSI) that indicates overbought or oversold conditions, or Bollinger Bands that signal volatility and price levels – they’re like the stars guiding sailors in an open sea.
How Technical Indicators Can Be Used in Ethereum Price Prediction
“Now, that’s all well and good,” you might say, “but how do these help us accurately predict Ethereum’s price?” Well, my friend, this is where it gets interesting. Just as meteorologists use climate patterns to predict weather, traders use technical indicators to forecast price trends of crypto assets like Ethereum. By studying patterns and generating trading signals, indicators like Moving Averages, Fibonacci Retracement, or MACD can provide insights into possible price action.
For instance, if Ethereum (ETH) price crosses a moving average upwards, it might be a bullish signal. Or if the RSI is below 30, Ethereum could be oversold, indicating a potential upward bounce soon.
But remember, while technical analysis is an effective tool, it doesn’t guarantee exact future results. It’s essential to use it in conjunction with other analysis forms and always stay updated with the latest market news.
And with that, our expedition into the depths of technical analysis concludes. But don’t fret, this is just the beginning. The cryptoverse is a vast, exciting place with much more to explore. So, buckle up, because it’s going to be a thrilling ride!
I know how important it is to have a solid understanding of the most common technical indicators used for both crypto prices and predicting ETH worth. Thus, in this section, I’ll share with you the essential indicators that I’ve found particularly helpful in my own trade journey, and I’ll provide real-life examples of how to apply them to Ethereum price prediction.
Moving Averages (MAs) for Ethereum (ETH) Price Prediction
Moving Averages (MAs) serve as a fundamental tool in technical analysis, providing a constant average price, thus smoothing out the often erratic price data. For instance, a 50-day MA calculates the average closing prices of Ethereum over the previous 50 days.
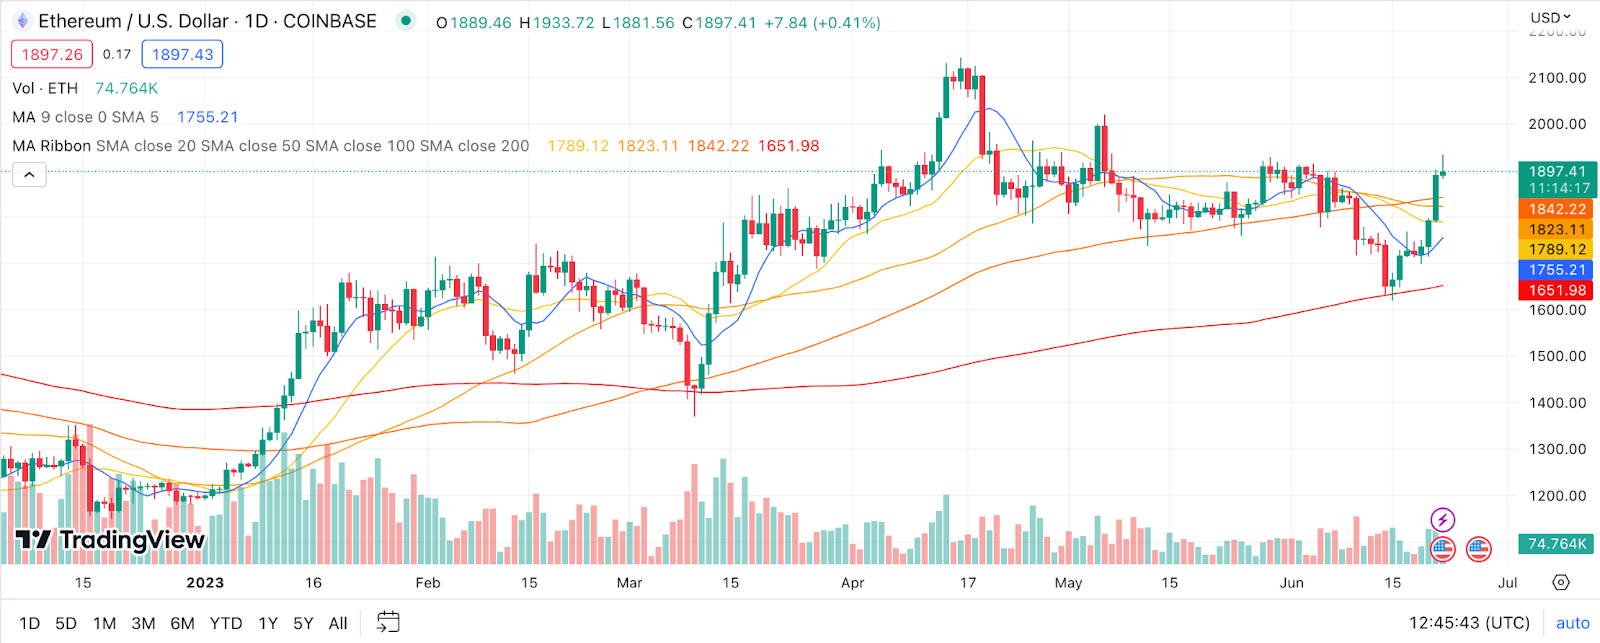
Example: When Ethereum’s price surpasses the MA, it signals a bullish trend, suggesting it may be a good time to buy. Conversely, when the price descends below the MA, it suggests a bearish trend, indicating it may be wise to sell or hold off on purchasing.
Relative Strength Index (RSI) for Ethereum (ETH) Price Prediction
The Relative Strength Index (RSI) is a key player when identifying overbought or oversold scenarios. It operates on a scale of 0-100, with values above 70 implying overbought conditions and values below 30 indicating oversold conditions. RSI is particularly useful with volatile cryptocurrencies like Ethereum.
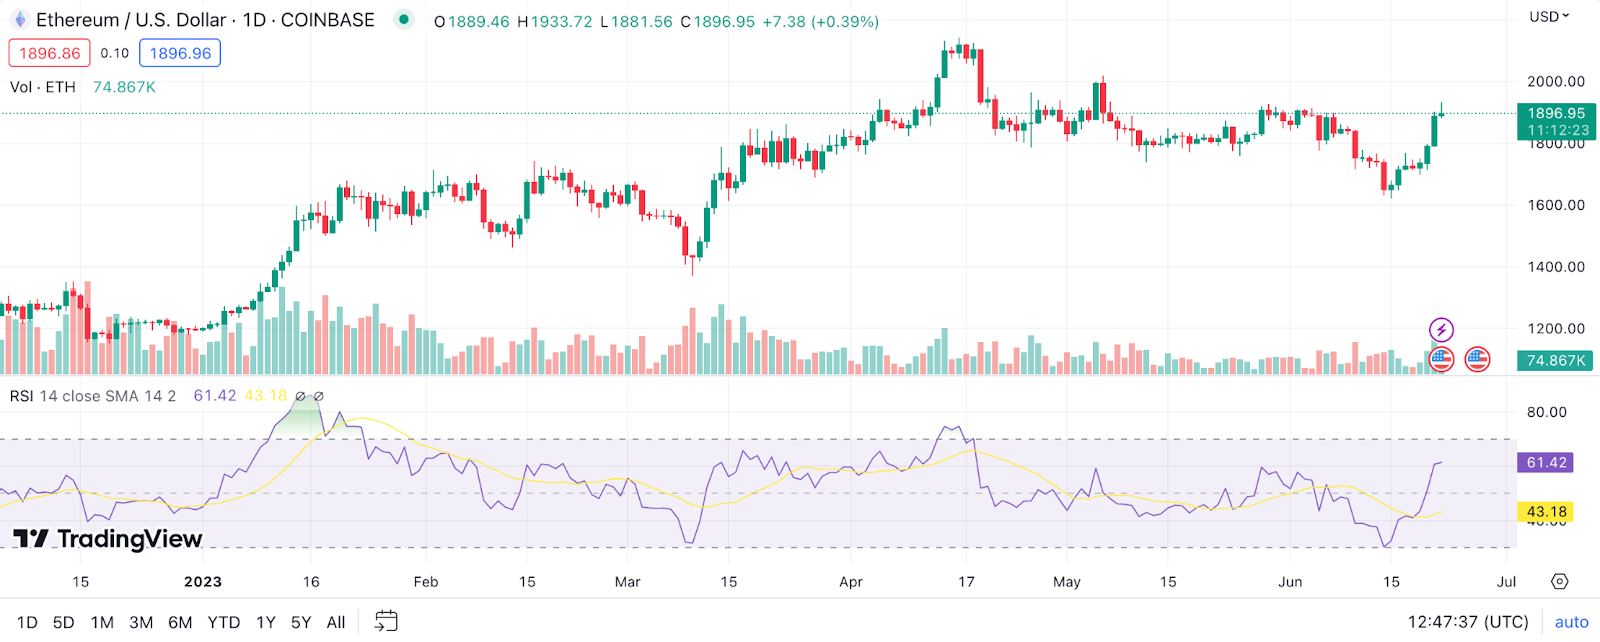
Example: When Ethereum’s RSI dips below 30, it suggests oversold conditions and a potential for price recovery. Conversely, an RSI value exceeding 70 may signal overbought conditions and a potential price decrease.
Moving Average Convergence Divergence (MACD) for Ethereum (ETH) Price Prediction
MACD serves as a trend-following momentum indicator, showing the relationship between two moving averages of a security’s price. It comprises two lines: the MACD line and the signal line, and their intersection can imply possible price shifts.
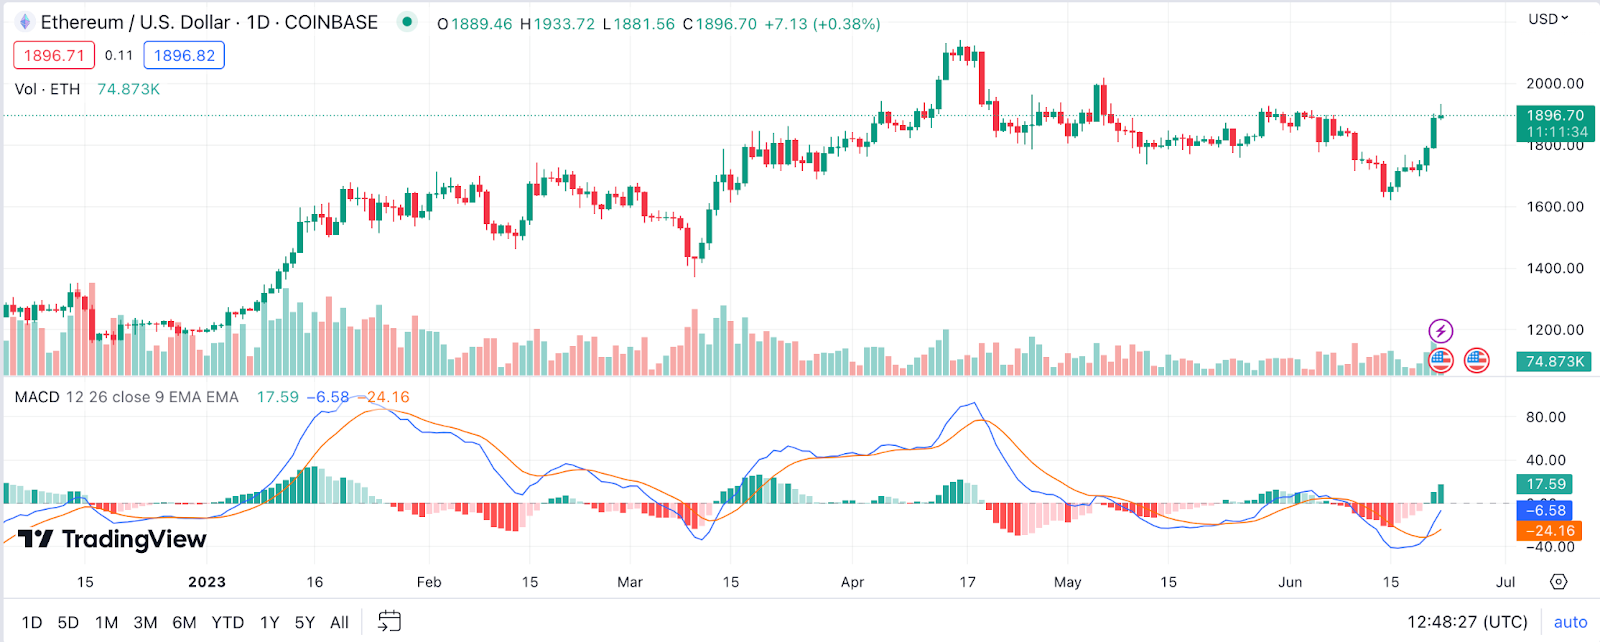
Example: When Ethereum’s MACD line crosses above the signal line, it may indicate an upcoming bullish market, suggesting it might be a good time to buy. Alternatively, when the MACD line crosses below the signal line, it could signal a potential bearish market, indicating it might be time to sell or hold.
Bollinger Bands for Ethereum Price Prediction
Bollinger Bands serve as a powerful indicator for understanding price volatility and potential overbought or oversold conditions in Ethereum’s market. This tool is essentially a price envelope drawn around a simple moving average (SMA) of the price and its standard deviations. The upper band usually identifies overbought conditions (high cryptocurrency prices), and the lower band marks oversold conditions (low cryptocurrency prices).
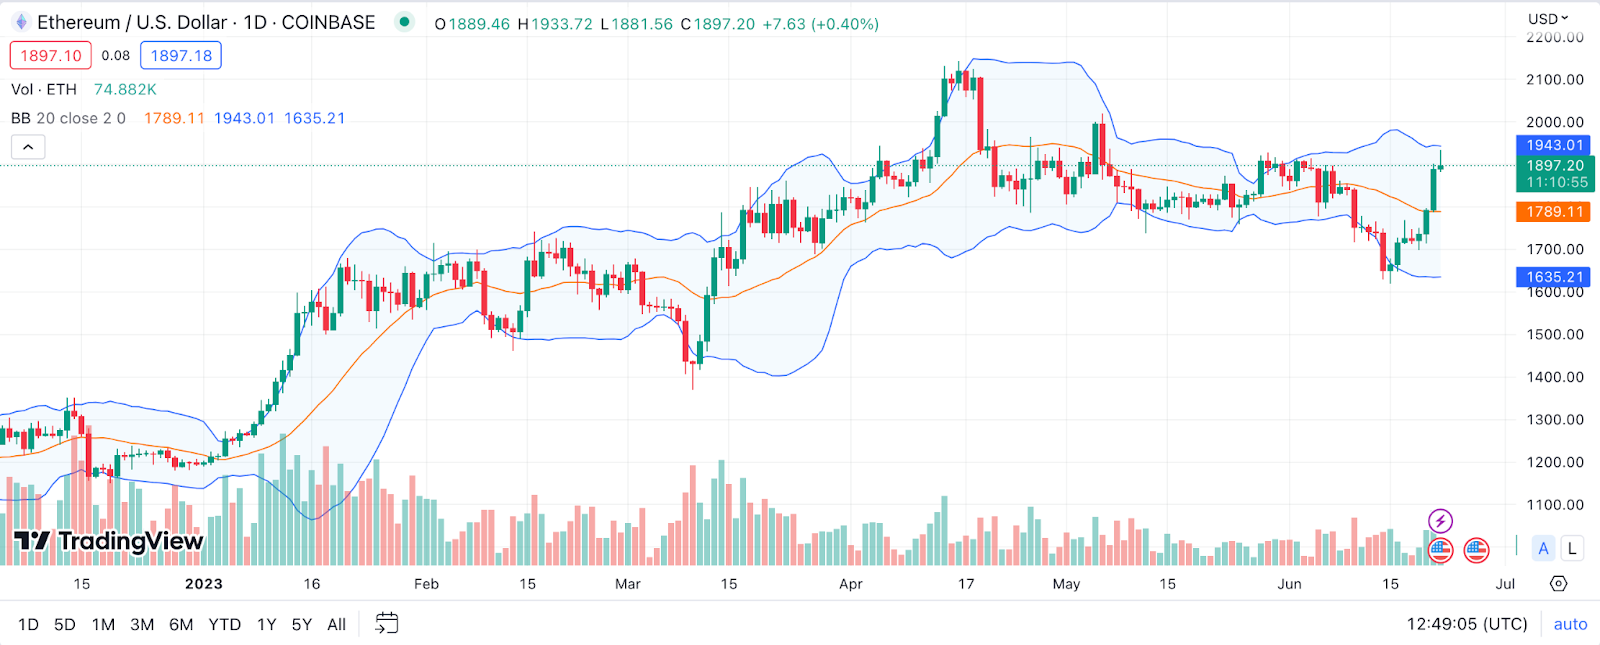
Example: When Ethereum’s price moves towards the upper band, it can be an indication that Ethereum may be overvalued, and a price correction might be on the horizon. Conversely, if Ethereum’s price drops towards the lower band, the market might be undervaluing Ethereum, thereby potentially presenting a good buying opportunity.
Stochastic Oscillator for Ethereum Price Prediction
The Stochastic Oscillator is a momentum-indicating tool that can help traders predict potential reversal points in Ethereum’s price. This indicator compares Ethereum’s closing price to a range of its prices over a certain period of time, resulting in a value between 0 and 100.
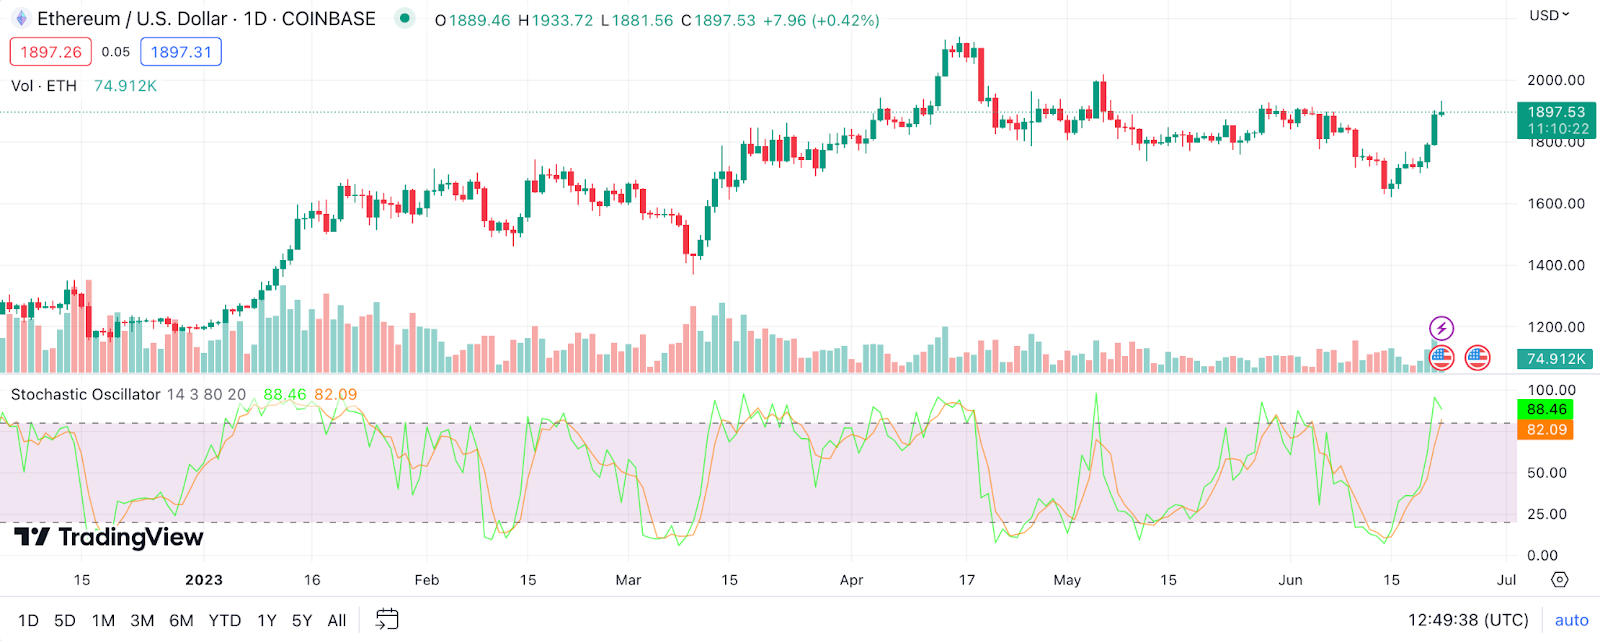
Example: Readings above 80 typically indicate that Ethereum is possibly overbought, whereas readings below 20 suggest that Ethereum might be oversold. However, during strong price trends, Ethereum’s price can stay in these overbought or oversold areas for quite some time, suggesting a strong upward or downward momentum, respectively.
Parabolic SAR (Stop and Reverse) for Ethereum Price Prediction
The Parabolic SAR is another useful tool for identifying the future short-term momentum of Ethereum. The indicator plots points on the chart to show the potential reversal of price trends.
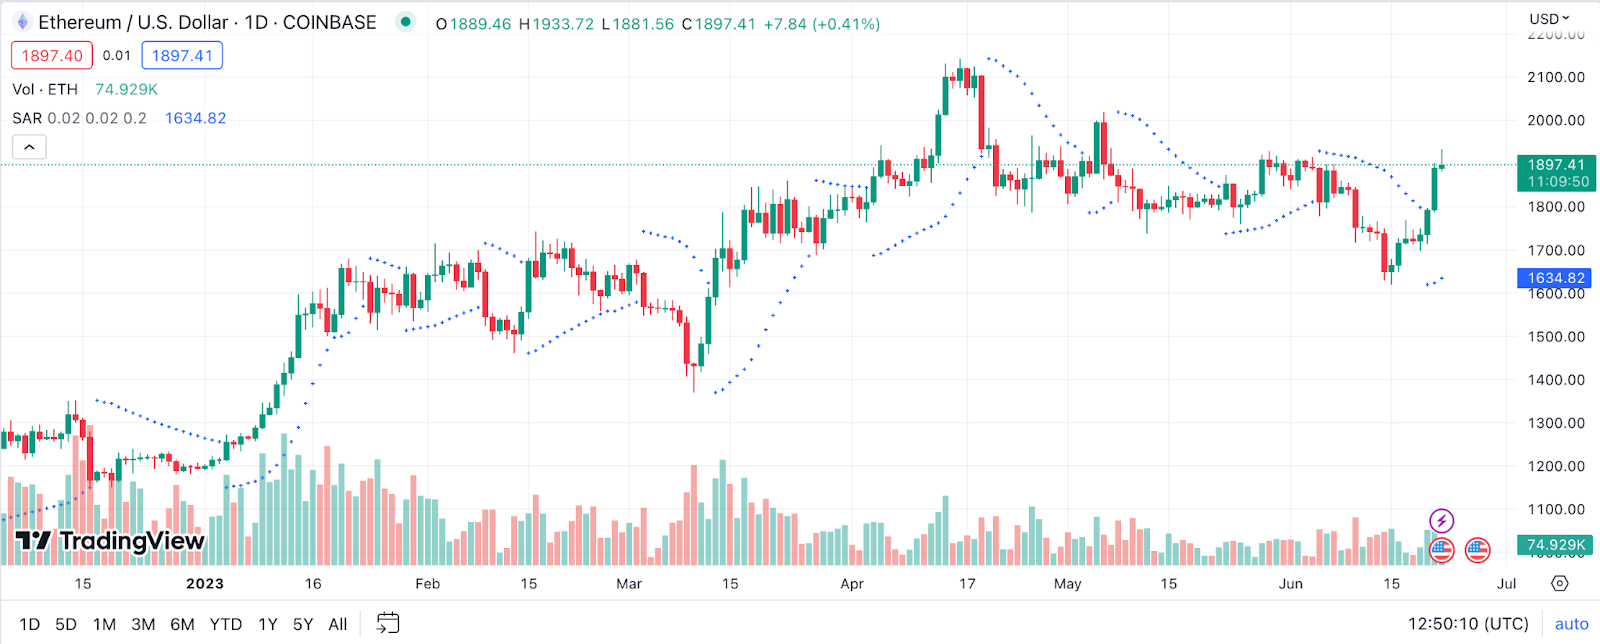
Example: For Ethereum, if the dots are plotted beneath the price, it indicates a bullish trend, suggesting that it might be a good time to enter a long position. However, if the dots appear above the price, it could signal a bearish trend, implying potential selling pressure in the market.
Ichimoku Cloud for Ethereum Price Prediction
The Ichimoku Cloud is a complex yet powerful tool that combines multiple indicators to offer a comprehensive overview of Ethereum’s price action. It consists of five lines—Tenkan-Sen, Kijun-Sen, Senkou Span A, Senkou Span B, and Chikou Span—each providing unique insights into the market’s dynamics.

Example: When Ethereum’s price is above the cloud, it suggests a bullish trend. If the price is below the cloud, a bear market may be underway. The distance between the cloud’s spans also indicates market volatility—the wider the cloud, the greater the expected volatility.
Fibonacci Retracement for Ethereum Price Prediction
Fibonacci Retracement is a technical tool widely used in trading, including Ethereum trading. It’s based on Fibonacci sequences, and these ratios (23.6%, 38.2%, 50%, 61.8%, and 100%) are used to anticipate potential price retracement areas following a market swing.

Example: If Ethereum saw a significant price increase from $1,000 to $2,000, traders may use the Fibonacci levels to predict where a correction might halt and reverse. If the price retraces to $1,618 (38.2% level), this could be a potential buying opportunity in anticipation of a bullish continuation.
Average Directional Index (ADX) for Ethereum Price Prediction
The Average Directional Index (ADX) is a powerful indicator used to measure the strength of Ethereum’s price trends. Values above 25 generally suggest a strong trend, while values below 20 might indicate a weak or non-existent trend.
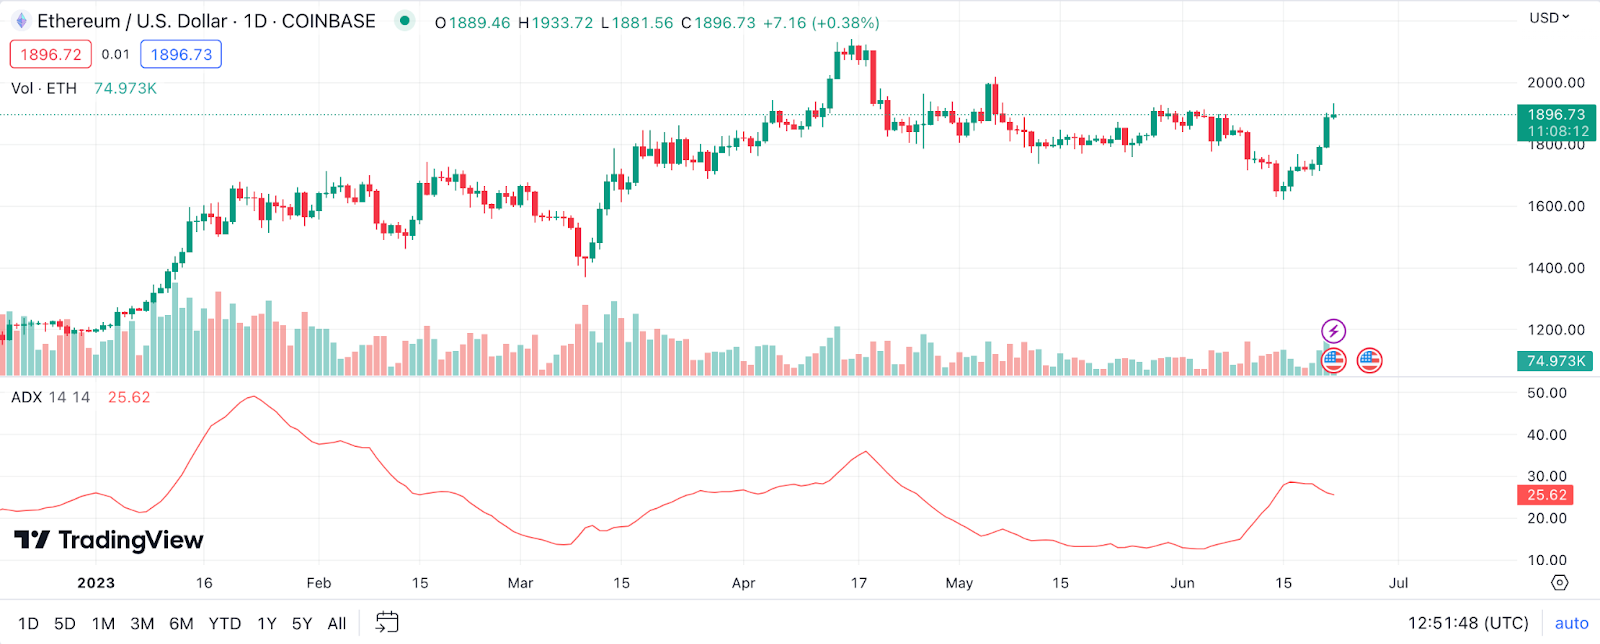
Example: If Ethereum is in a bull run and the ADX value surpasses 25, it signifies a strong upward trend, potentially reinforcing your bullish bias.
On Balance Volume (OBV) for Ethereum Price Prediction
On Balance Volume (OBV) is a momentum indicator that uses volume flow to predict changes in the price of an asset, such as ETH. The OBV increases or decreases during each trading period in correlation with the price movement. If the closing price is higher than the previous one, the volume is added to the cumulative OBV total, and if the closing price is lower, the volume is subtracted.

Example: If the OBV for ETH is rising, it indicates that volume is heavier on up days. If the price is not increasing at the same pace, it could be a sign of an upcoming bullish trend reversal. Conversely, if the OBV is declining and the price isn’t following, it might signal a potential bearish trend reversal.
Rate of Change (ROC) for Ethereum Price Prediction
The Rate of Change (ROC) is a momentum oscillator that measures the speed at which Ethereum’s price is changing. The ROC calculates the percentage difference between the current Ethereum price and the price a certain number of periods ago.
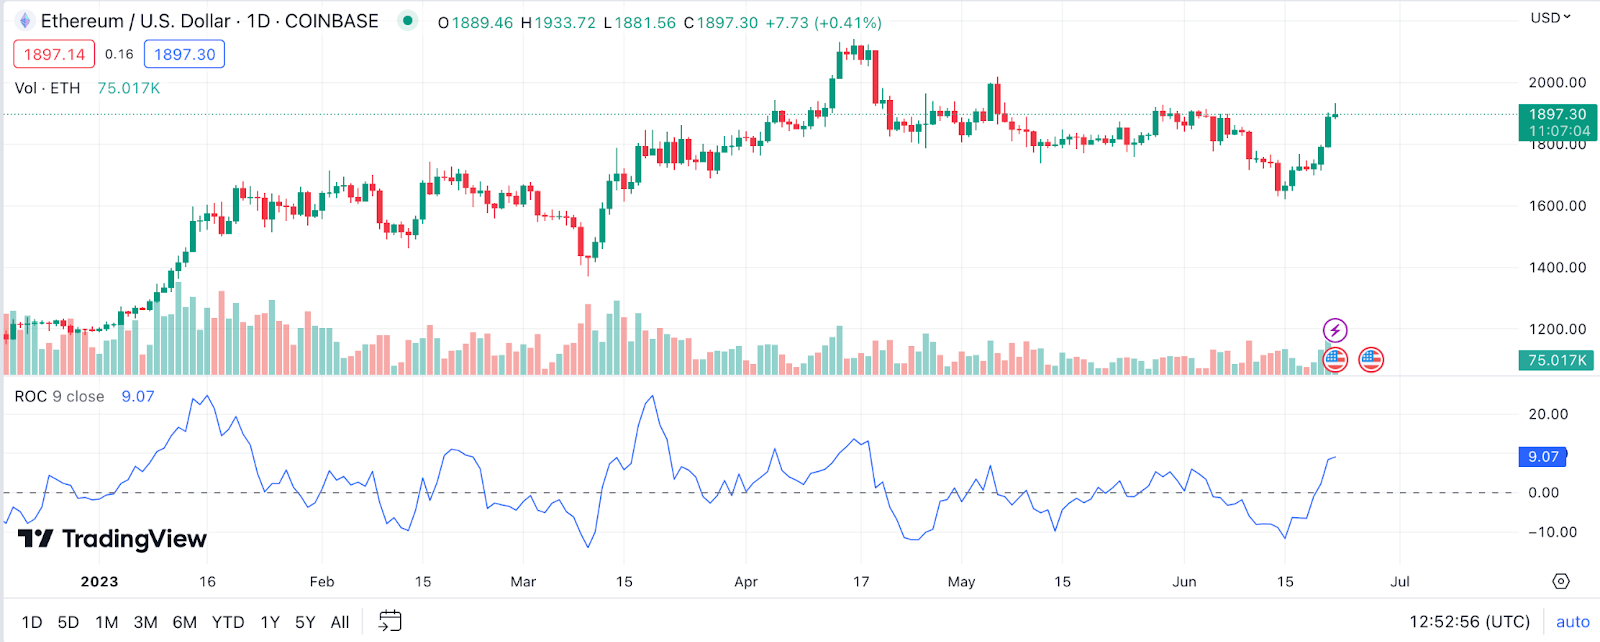
Example: If Ethereum’s price starts increasing rapidly, the ROC will rise, potentially indicating an overbought situation. Conversely, if the ROC starts falling rapidly, it may indicate an oversold condition.
Commodity Channel Index (CCI) for Ethereum Price Prediction
The Commodity Channel Index (CCI) is a dynamic technical indicator designed to discern price movements which may not be discernible by just looking at the price chart. It serves a dual purpose of determining oversold and overbought levels, essentially highlighting when Ethereum’s price may be stretching too far from its average – a hint of an impending correction.
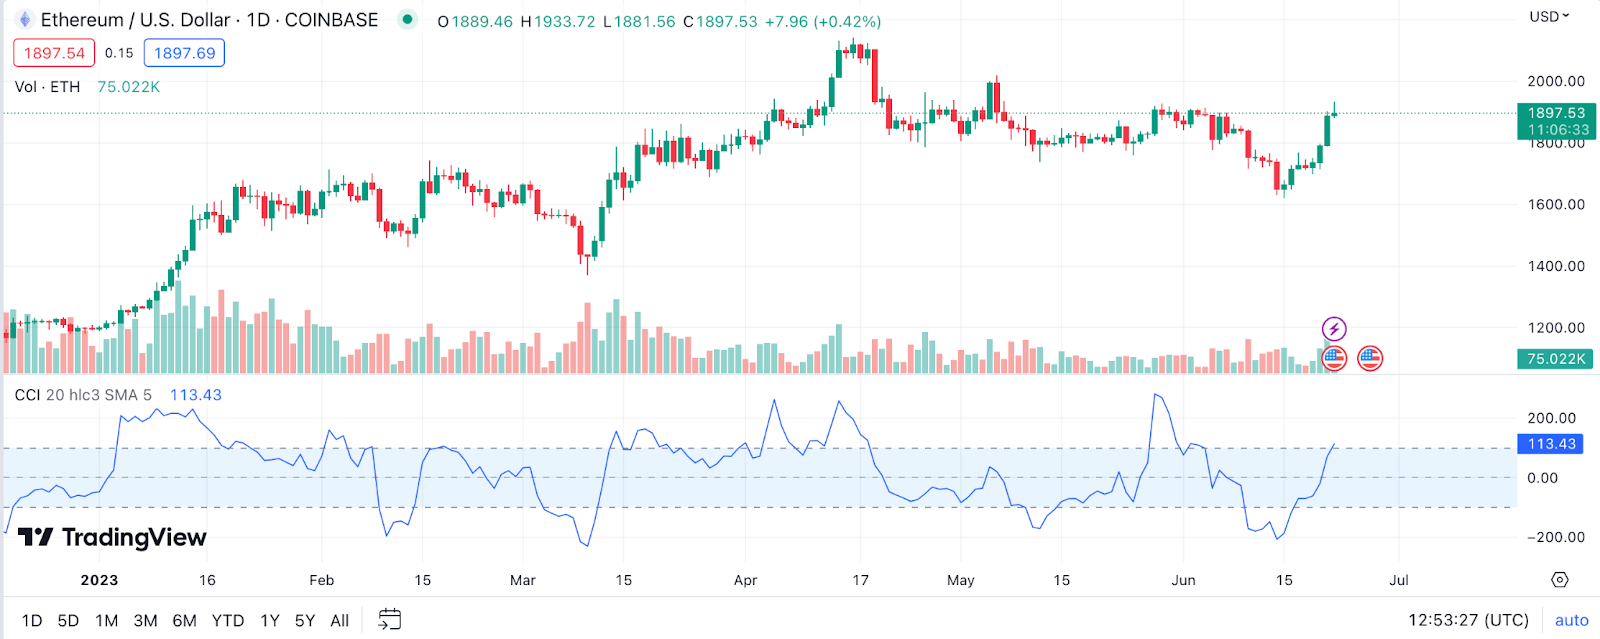
Example: If Ethereum’s price shoots up drastically causing the CCI to cross over the 100 mark, it could be an indication that the price is overbought and might be due for a drop. On the flip side, a CCI below -100 could imply an oversold condition, pointing towards a potential upward bounce.
Accumulation/Distribution Line (A/D Line) for Ethereum Price Prediction
The Accumulation/Distribution Line (A/D Line) is a volume-based indicator designed to measure the cumulative flow of money into and out of a security. The A/D line is used to assess the strength of a trend by comparing the price, inflow, and outflow of money.

Example: Let’s say, ETH’s price is rising and the A/D line is rising as well, this would indicate that the coin is in a strong upward trend as there’s a significant volume supporting the price rise. Conversely, if the A/D line is falling while the price of ETH is rising, it may signal a price reversal, as the coin could be facing a sell-off soon.
Pivot Points for Ethereum Price Prediction
Pivot points are a key tool used by traders to make informed decisions about where the price of Ethereum could potentially go. The pivot point is a technical analysis indicator used to determine the overall trend of the market over different time frames. The pivot point itself is simply the average of the high, low, and closing prices from the previous trading period.

Example: If the current price of Ethereum is above its pivot point, this is generally seen as bullish sentiment, while if it’s below the pivot point, it’s seen as bearish. This tool is crucial in setting stop-loss points and for identifying breakout opportunities.
Chaikin Money Flow (CMF) for Ethereum Price Prediction
The Chaikin Money Flow (CMF) is a technical analysis tool that is used to measure Money Flow Volume over a set period. The most commonly used period, as with many indicators, is 20 periods. The CMF is a great indicator of market strength and, when used with other indicators, can significantly help in confirming important price actions.

Example: If Ethereum is forming a bullish pattern, an accompanying bullish signal on the CMF would strengthen the case for a potential upward move.
Aroon Indicator for Ethereum Price Prediction
The Aroon Indicator is a complex structure that consists of “Aroon up” and “Aroon down”. It measures the strength of a trend and likelihood that it will continue. A high “Aroon up” combined with a low “Aroon down” can indicate a strong bullish trend in Ethereum. Conversely, a low “Aroon up” and high “Aroon down” indicate a strong bear market. The Aroon indicator can also identify trend changes when the two lines cross each other.
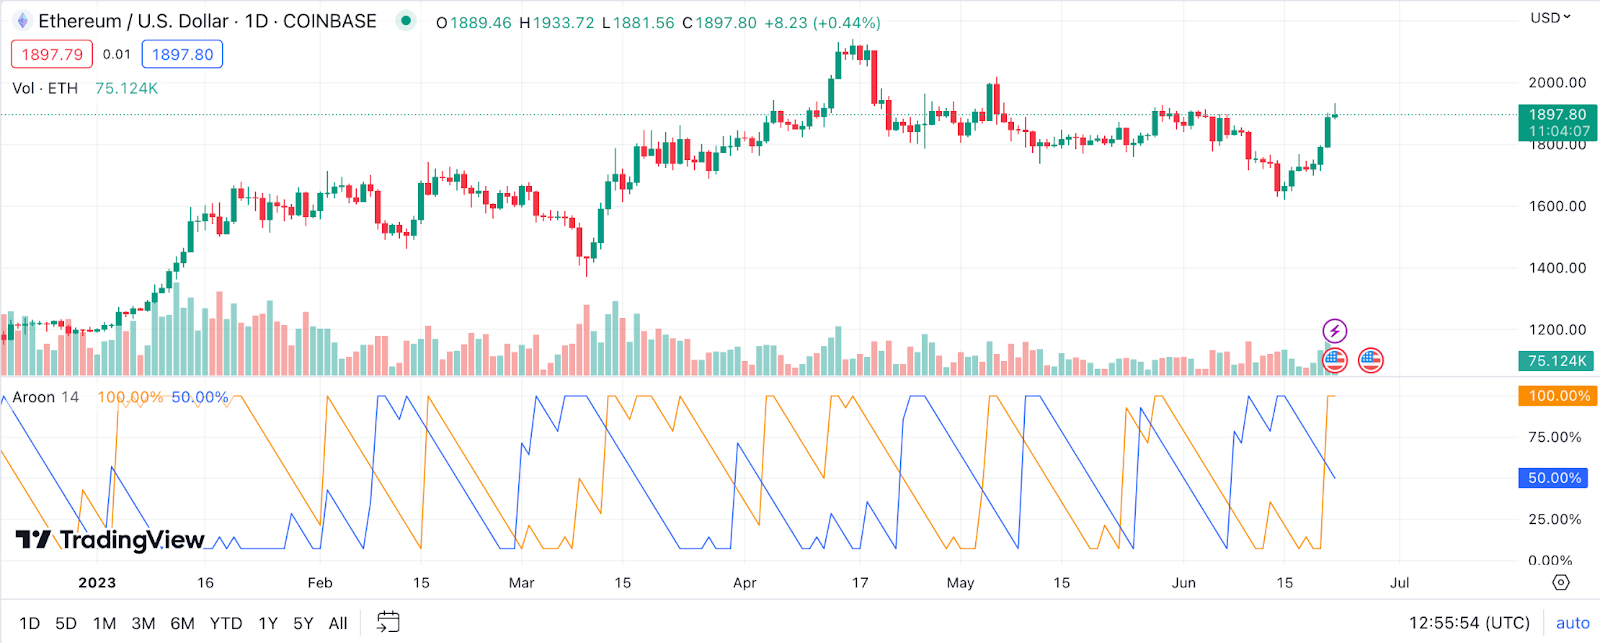
Example: If the Ethereum price has been in a strong uptrend, but the “Aroon down” crosses above “Aroon up”, it could suggest that the uptrend may be ending, and a downtrend is starting.
Gann Fan for Ethereum Price Prediction
The Gann Fan is a technical tool developed by legendary trader W.D. Gann. This tool consists of a set of diagonal lines that are used to predict key resistance and support levels, and potential tops and bottoms for Ethereum’s price. By aligning a Gann Fan with a bottom and peak price, we can generate a variety of trend lines that help in predicting future price movements.
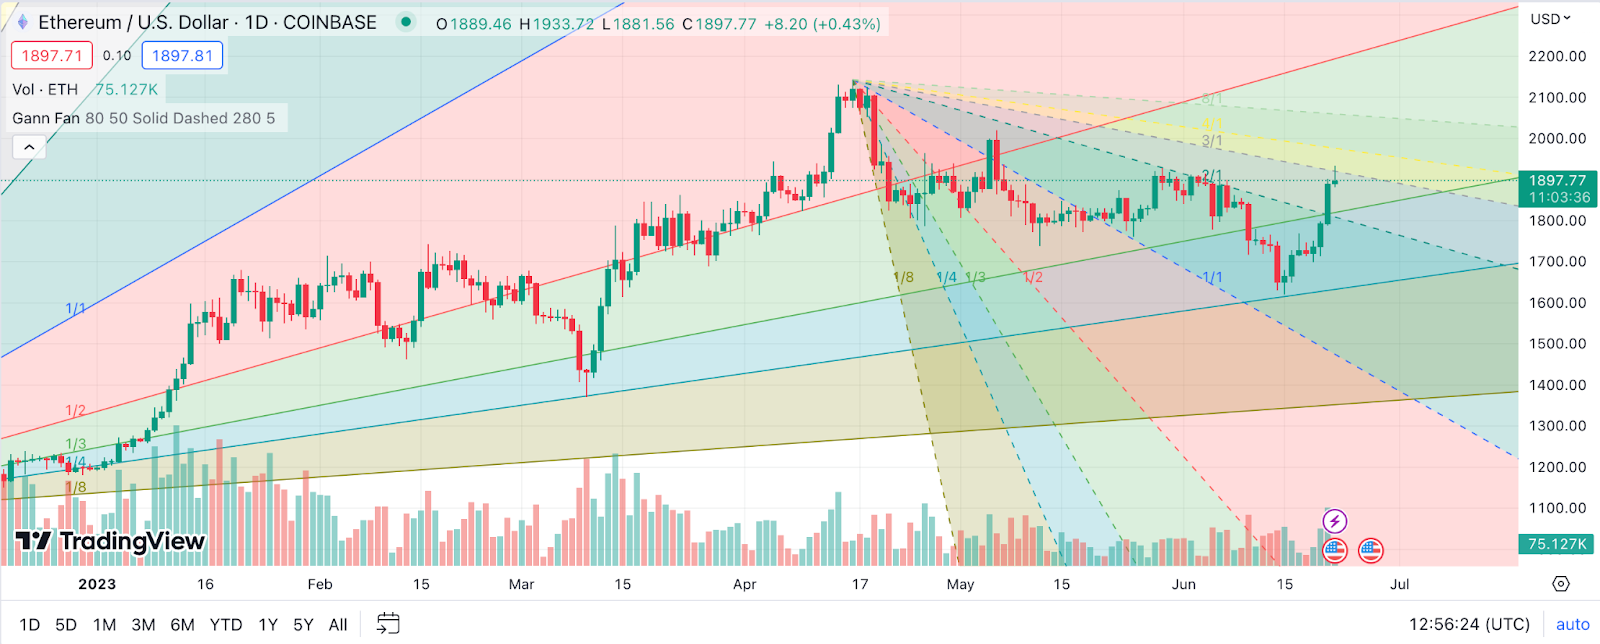
Example: If Ethereum’s price breaks above a descending Gann line, it could signal the start of a new uptrend. Similarly, a break below an ascending Gann line might suggest the start of a new downtrend.
Keltner Channel for Ethereum Price Prediction
The Keltner Channel is a volatility-based technical indicator composed of three separate lines. The middle line is an exponential moving average (EMA), and the top and bottom lines are the EMA plus and minus a multiple of the Average True Range (ATR), respectively.
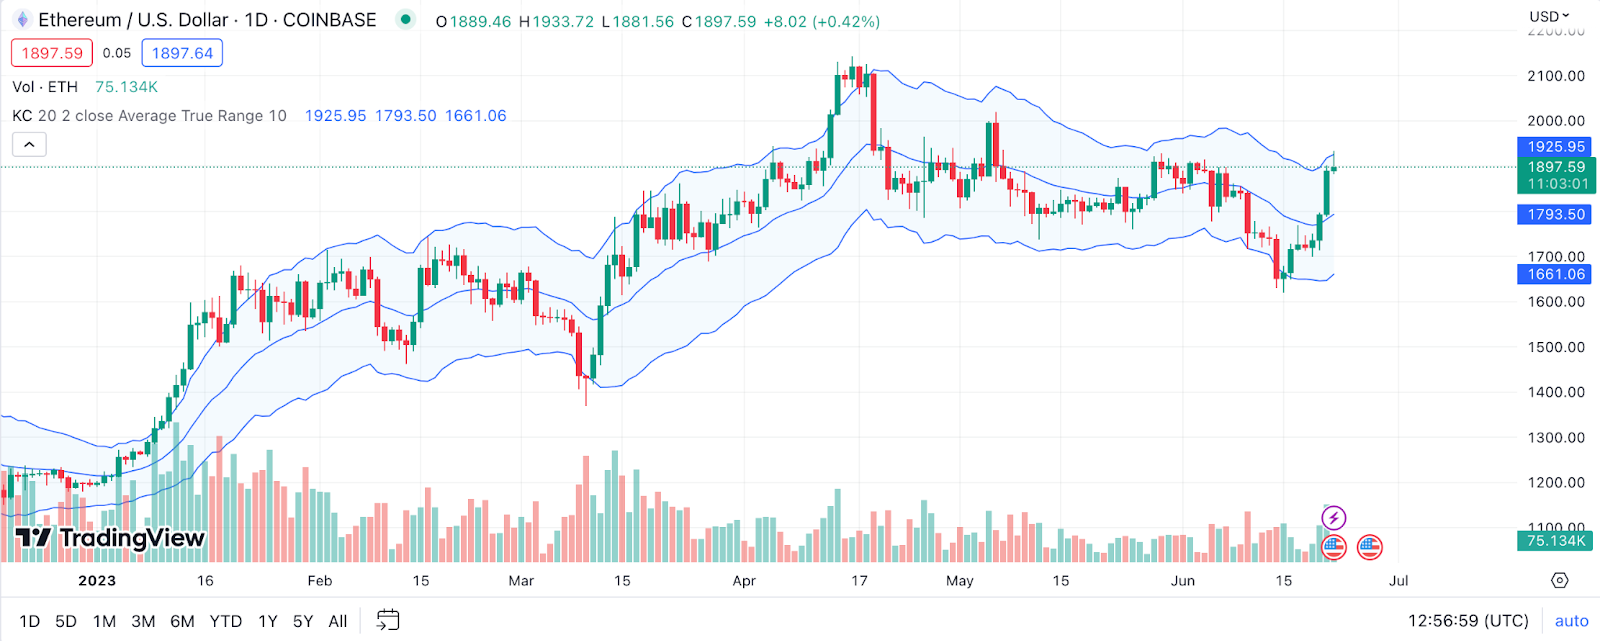
Example: In the context of Ethereum (ETH), if the price starts to touch or move outside the upper band, it could suggest that ETH is overbought and might face a reversal or pullback in the near future. Alternatively, if the price is near or below the lower band, ETH could be oversold, potentially signaling an upcoming price increase.
Money Flow Index (MFI) for Ethereum Price Prediction
Money Flow Index (MFI) is an oscillator that uses both price and volume to measure buying and selling pressure. It’s also known as volume-weighted RSI. MFI starts with the typical price for each period. A value of 80 or more is generally considered overbought, a value of 20 or less oversold.

Example: If Ethereum’s MFI is above 80, it might be a good time to sell, as it indicates that Ethereum could be overbought, and a price correction may be near. Conversely, if the MFI is below 20, it could be a good time to buy Ethereum as ETH might be oversold and a price bounce could be on the horizon.
TRIX for Ethereum Price Prediction
The TRIX indicator is a less known tool that is used for discerning trends in Ethereum’s price, with the goal of being one step ahead of market movements. It’s a momentum oscillator that filters out movements in Ethereum (ETH) price that are below a specific volatility threshold.
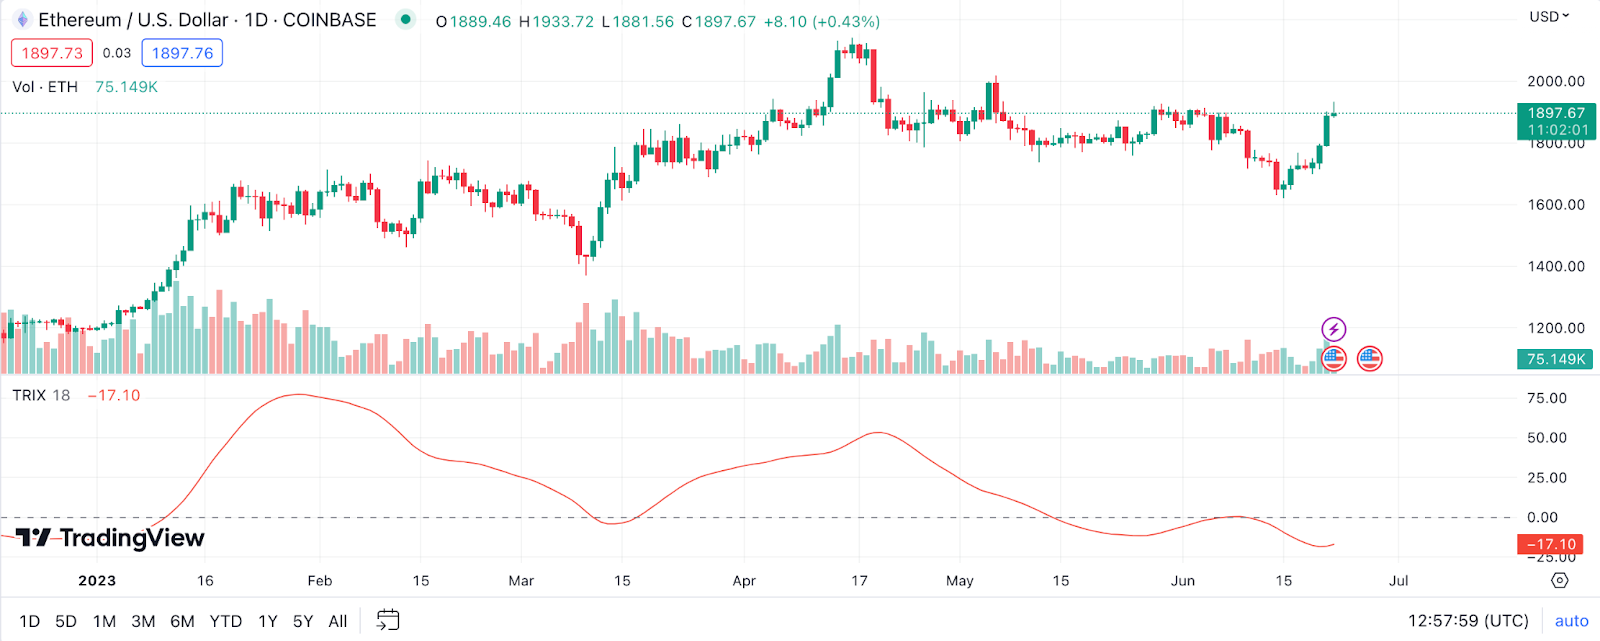
Example: When the TRIX line crosses the zero line to the upside, it could mean that Ethereum’s price is gaining upward momentum, possibly signaling a buy opportunity. Conversely, when the TRIX line crosses down through the zero line, it could mean that selling pressure is increasing, potentially indicating a sell signal.
The Zig Zag Indicator for Ethereum Price Prediction
The Zig Zag indicator is a tool that aids in analyzing price trends by filtering out smaller price changes, essentially eliminating “noise” and highlighting significant trends. For Ethereum, if the price has changed beyond a certain percentage, the Zig Zag indicator will draw a new line.
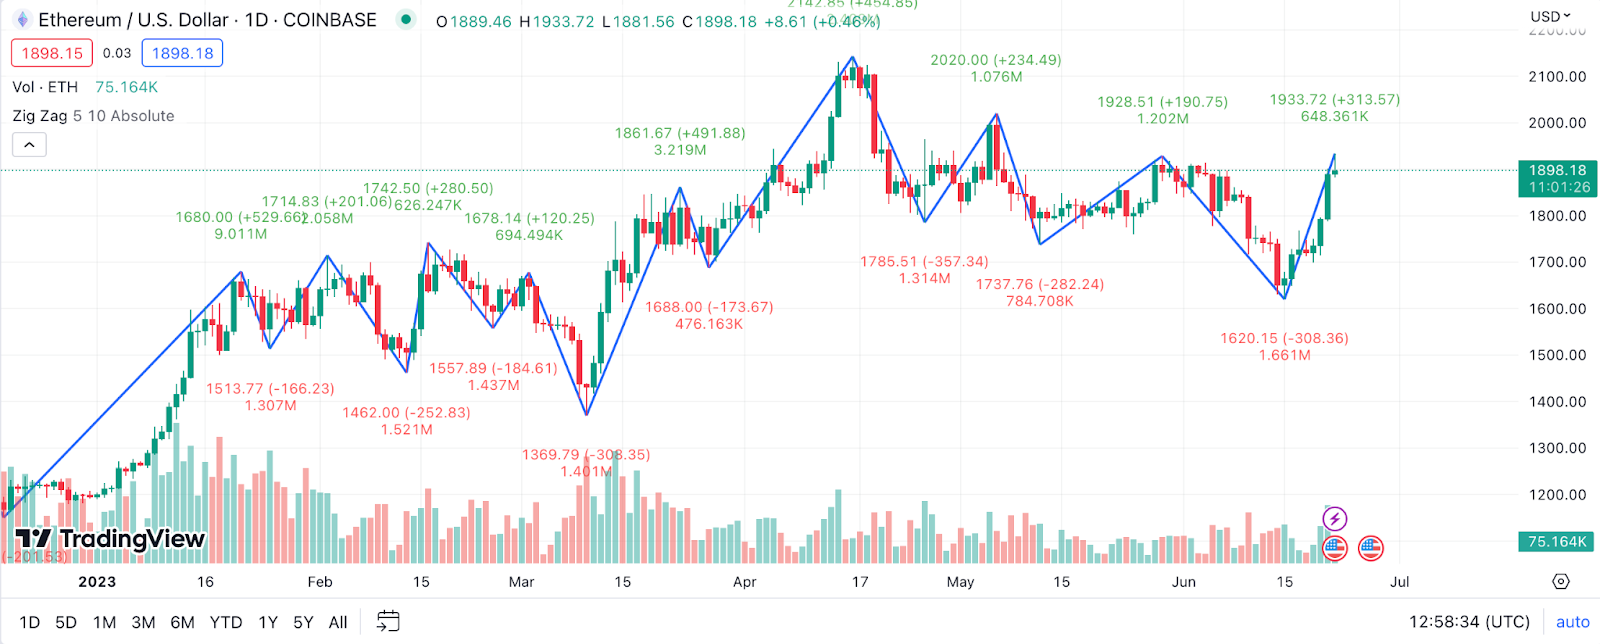
Example: If the Ethereum price reverses but not enough to surpass the set threshold, the indicator ignores this movement. Hence, this tool can be highly useful to understand the broader price trends of Ethereum, keeping track of significant upturns and downturns and ignore minor price fluctuations.
Detrended Price Oscillator (DPO) for Ethereum Price Prediction
Detrended Price Oscillator (DPO) is an indicator designed to remove trend from price to facilitate the identification of cycles within the market. When the DPO peaks above the zero line, it may indicate a price peak is in place and Ethereum may see a price decline.

Example: When the DPO bottoms below the zero line, it may suggest that a price trough has formed, and an upward price move for Ethereum may be expected. By pinpointing these cycle highs and lows, it can provide investors with information on when to enter or exit trades.
Vortex Indicator (VI) for Ethereum Price Prediction
The Vortex Indicator (VI) is designed to identify the start of a new trend or confirm an ongoing trend. Its two oscillating lines can give traders insight into trend direction and strength.
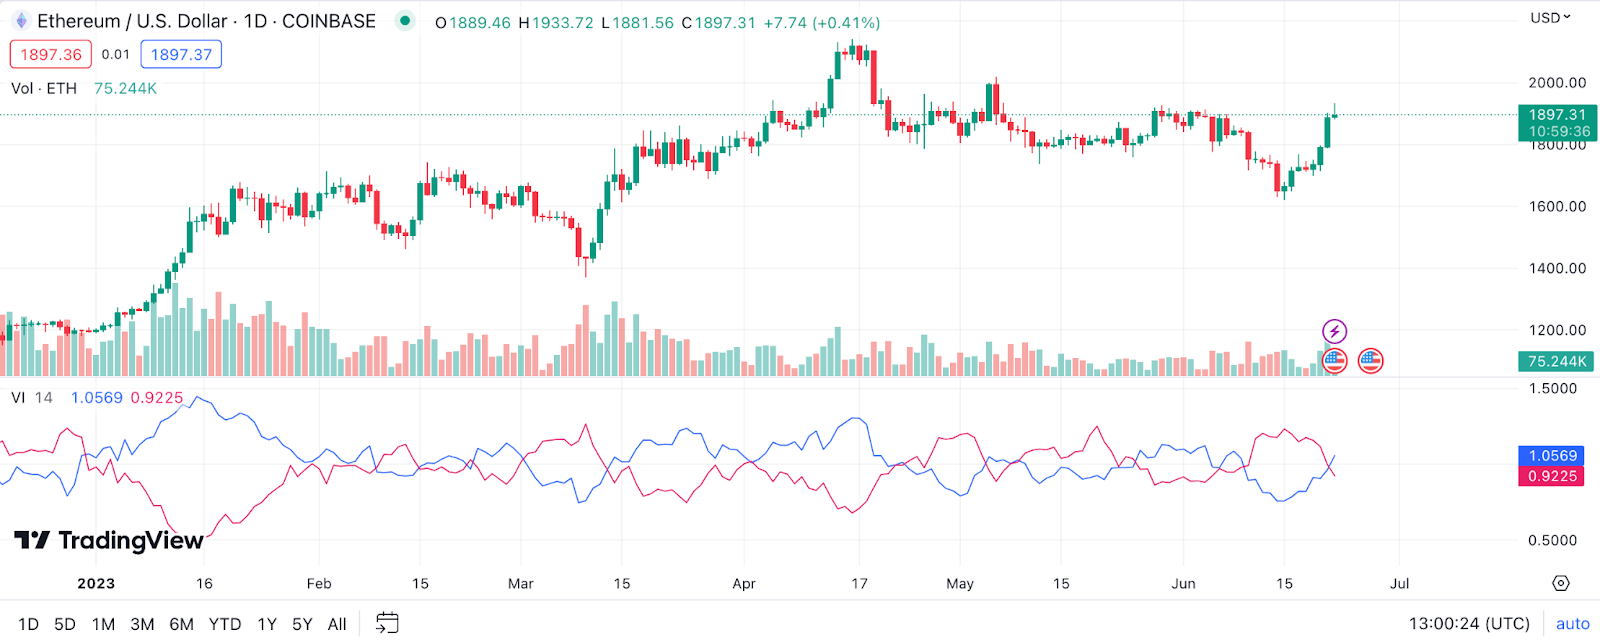
Example: When the positive VI (VI+) crosses above the negative VI (VI-), it could suggest a potential bullish trend, indicating a good time to buy Ethereum. Conversely, when the VI- crosses over the VI+, it might signal a bear market, possibly suggesting a sell-off.
Elder’s Force Index (EFI) for Ethereum Price Prediction
Elder’s Force Index (EFI) is an oscillator that uses price and volume to assess the power behind a move or to reinforce a trend direction. This can give traders of ETH a significant edge.
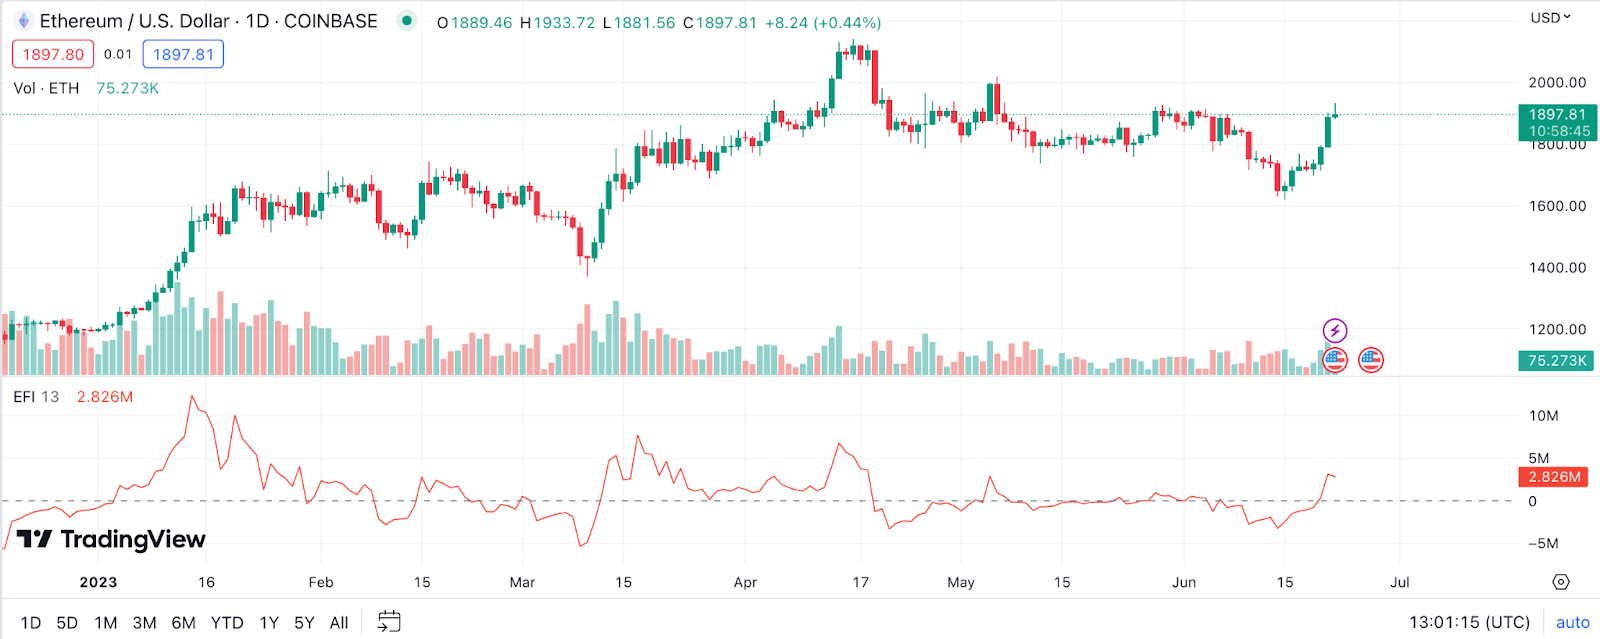
Example: When EFI is positive, it implies that the bulls have the edge and Ethereum prices might rise, and when it’s negative, it indicates that the bears have taken over, suggesting a potential price drop.
Williams %R for Ethereum Price Prediction
Williams %R, also known as the Williams Percent Range, is a type of momentum indicator that moves between 0 and -100 and measures overbought and oversold levels.

Example: If the Williams %R crosses above the -20 line, Ethereum could be considered overbought, which may be a selling signal. However, if it crosses below the -80 line, Ethereum could be deemed oversold, potentially signaling a good buying opportunity.
Combining Technical Indicators for Accurate ETH Price Prediction
In the exciting world of cryptocurrency trading, where volatility is the norm, technical indicators serve as navigational beacons, helping traders make more informed decisions. But is relying on a single indicator enough? The answer is a resounding “no”. Let’s delve deeper into why utilizing a combination of these indicators can offer a more precise price prediction for ETH prices.
The Importance of Using Multiple Technical Indicators for ETH Price Prediction
In the dynamic world of crypto trading, relying solely on one technical indicator is much like trying to understand a movie plot by watching a single scene. It’s crucial to comprehend that indicators are not prophetic; they merely shed light on specific aspects of the price behavior. For instance, some indicators might focus on trend identification, others on momentum, and some on volume change.
Utilizing a single indicator may lead to misguided decisions because each tool has its inherent limitations and is susceptible to false signals. Conversely, employing a mix of indicators can assist in highlighting diverse aspects of price action, thereby providing a more comprehensive and nuanced view of the market.
When we focus specifically on Ethereum, given its volatility and rapid price changes, a single technical indicator might not capture the full spectrum of its price behavior. This is where the application of multiple indicators becomes even more critical. Multiple indicators can confirm each other’s signals, reducing the chances of false positives, and providing a more reliable analysis.
Another important aspect to note is that the crypto market is open 24/7, unlike traditional markets. This increases the possibility of price swings and hence raises the need for a more robust analytical framework, which can be achieved by employing multiple technical indicators. Therefore, in the journey of Ethereum price prediction, the combined strength of different technical indicators often proves to be a more trustworthy companion than a solitary indicator.
How to Combine Various Indicators for Ethereum Price Prediction
Here are some tips on how to combine various technical indicators for a comprehensive analysis of Ethereum (ETH) price:
- Use Indicators That Complement Each Other: Ensure the indicators you use offer different types of information. For example, combining a trend indicator like Moving Averages with a momentum indicator like the Relative Strength Index can help confirm potential bearish or bullish signals.
- Avoid Redundancy: Using indicators that provide the same type of information can lead to redundancy and doesn’t necessarily improve your analysis. For example, using the MACD along with the RSI, both momentum indicators, might not provide additional beneficial insights.
- Use Different Time Frames: Apply your chosen indicators on different time frames to understand both short-term and long-term trends. This can provide a broader perspective of Ethereum’s price movements.
- Confirm Signals: If multiple indicators give the same signal, it could confirm the predicted trend. For instance, if the RSI shows Ethereum is overbought and the Bollinger Bands are contracted, it may reinforce the sell signal.
- Manage Risks: Always remember that no set of indicators is foolproof. Always use risk management strategies alongside technical analysis to protect your investments.
Remember, using a mix of technical indicators can help you identify more accurate entry and exit points, but it’s not a guarantee. It’s essential to continually adapt your strategies based on market conditions and stay updated on news related to Ethereum. With a disciplined and informed approach, your technical analysis of Ethereum (ETH) price can become a strong tool in your trading arsenal.
The Pillars of ETH Price Prediction: Fundamental Factors
Cryptocurrency, as a new and promising field, is often as volatile as it is innovative. Forecasting the price of Ethereum (ETH), one of the market leaders, requires a deep understanding of several fundamental factors. I’d like to share some insights into what I consider the pillars of Ethereum (ETH) price prediction, based on my own experience and expertise.
Adoption Rate in ETH Price Prediction
Adoption is the beating heart of any cryptocurrency, serving as the lifeline that can make or break its success. Ethereum, being a frontrunner in the crypto world, is no different. The adoption rate of Ethereum is a metric that, in my opinion, is a paramount factor in predicting the price of ETH.
When assessing the adoption rate of Ethereum, it’s beneficial to look at the following key metrics:
- Number of Wallets: A burgeoning number of Ethereum wallets is a strong indicator of increasing adoption. More wallets mean more users, which invariably points towards a thriving ecosystem.
- Transaction Volume: The number of ETH coins being traded daily can provide valuable insights. A surge in volume often means higher adoption and can hint at price movements.
- Network Utilization: How occupied the Ethereum network is, is another important metric. Higher network utilization suggests more transactions are happening, possibly driving up demand for ETH.
- DApp Usage: The number and activity level of decentralized applications (DApps) built on Ethereum offer a view into its adoption. A rise in DApp usage can indicate more reliance on the Ethereum network.
- Gas Usage: The total amount of gas used in transactions can signal how much computation is happening on Ethereum. An increase in gas usage could indicate that more complex operations are being executed, a sign of increased adoption.
- DeFi Participation: The total value locked in DeFi protocols on Ethereum is a strong measure of adoption within the finance industry. Growth in this area can drive up demand for ETH.
Regulatory Developments in ETH Price Prediction
Just like the winds can change the direction of a sailing ship, regulatory developments can swiftly alter the course of a cryptocurrency. For Ethereum, staying updated on regulatory shifts and understanding their potential impact is a key facet in making informed predictions about ETH’s price.
Examples of regulatory changes and their potential impact on ETH include:
- National Legislation: If a country changes its stance towards crypto, it could greatly affect ETH. For example, if a major economy bans or restricts Ethereum, the price may drop. Conversely, if a country adopts a crypto-friendly stance, ETH could benefit.
- SEC Regulations: The US Securities and Exchange Commission has significant influence over crypto. New guidelines or interpretations could impact Ethereum’s status, affecting its price.
- Tax Laws: Changes in taxation related to cryptocurrency can influence people’s willingness to invest in or hold ETH.
- Global Standards: Changes in global standards like the Financial Action Task Force (FATF) recommendations can impact how exchanges and other entities handle ETH, affecting its liquidity and price.
- AML and KYC Regulations: Tighter anti-money laundering (AML) or know-your-customer (KYC) regulations could reduce the level of anonymity associated with ETH, possibly influencing demand and price.
Utility in ETH Price Prediction
The practicality of a cryptocurrency in real-world applications plays a vital role in its long-term success. Ethereum’s utility isn’t just about its value as a digital currency; it’s also about how its underlying technology can be harnessed.
When considering the utility of Ethereum, it’s worthwhile to explore these key areas:
- Smart Contracts: Ethereum’s ability to execute smart contracts has a wide array of uses, from automating insurance payouts to creating self-executing agreements in business.
- Decentralized Finance (DeFi): Ethereum has been at the forefront of the DeFi revolution, allowing for decentralized borrowing, lending, and trading.
- Non-Fungible Tokens (NFTs): Ethereum’s support for NFTs has enabled the tokenization of unique digital assets, sparking a revolution in the art world and beyond.
- Decentralized Autonomous Organizations (DAOs): Ethereum allows for the creation of DAOs, which could redefine how organizations are structured and run.
- Supply Chain Management: Ethereum’s blockchain technology can provide transparency and traceability in supply chains, ensuring authenticity and reducing fraud.
Market Sentiment: How Ethereum (ETH) Price Prediction Works
The cryptocurrency market is highly sentiment-driven. News, rumors, and public perception can cause wild swings in the price of ETH. Understanding market sentiment is like having your finger on the pulse of the crypto world.
Here are some factors and tools used to gauge market sentiment for ETH:
- Social Media Trends: Platforms like Twitter and Reddit are often where crypto news breaks first. Tracking these platforms can provide early warning signs of price movements.
- News Sentiment Analysis: Some tools use AI to analyze the sentiment of news articles and posts about Ethereum.
- Fear and Greed Index: This tool looks at factors like volatility and social media to measure the market’s overall emotional state.
- Surveys and Polls: These can provide direct insight into what investors are thinking and feeling about Ethereum’s future.
- Influencer Opinions: Prominent figures in the crypto world can have a significant impact on sentiment, swaying it positive or negative.
- Google Trends: Search volume for Ethereum-related terms can be a good indicator of public interest and sentiment.
To navigate the choppy waters of Ethereum’s price prediction, understanding the fundamental factors that drive its value is vital. Assessing the adoption rate of Ethereum through various metrics offers insights into its growing prominence and usage. Keeping abreast of regulatory developments helps to predict potential impacts on Ethereum’s trajectory and price prediction.
Moreover, it’s important to comprehend Ethereum’s multifaceted utility and its practical implications in real-world applications. And lastly, staying tuned into market sentiment gives you a finger on the pulse of investor attitudes and expectations, guiding you in interpreting the potential effect on Ethereum’s price.
The Bottom Line: Making Your Own Ethereum Price Predictions
In wrapping up our deep dive into the world of Ethereum price predictions, we’ve journeyed through a landscape of expert opinions, technical indicators, and fundamental analysis. We’ve discovered that, like any asset, Ethereum’s future isn’t written in stone, but can be better understood through the lens of comprehensive research and a diversity of analytical perspectives.
It’s important to remember that predictions are, at their best, educated guesses grounded in data, and at their worst, speculation. As always, a wise investor combines these tools with their intuition, risk tolerance, and personal financial goals. After all, in the unpredictable world of crypto, it’s not just about predicting the waves, but learning how to surf them. Stay curious, stay informed, and you’ll continue to navigate the turbulent seas of Ethereum trading and price prediction with confidence and insight.
FAQ
When Will Ethereum (ETH) Price Go Up?
In the world of crypto, timing is a complex and often unpredictable element. While our research and technical analysis point to a generally upward trajectory for Ethereum cost, the specific timings of these increases are influenced by a multitude of factors. Global events, investor sentiment, technical advancements, the coin’s past performance, and general market volatility all play crucial roles in determining price movements. Therefore, it’s important for investors to stay informed, conduct regular market analyses, and use a range of tools and indicators to make informed decisions. Investing in Ethereum, like any other crypto, requires patience and a long-term perspective.
Should I Buy Ethereum?
The decision to buy Ethereum, or any other cryptocurrency for that matter, hinges on your personal financial situation, your risk appetite, and your understanding of the cryptocurrency market. Ethereum, being the second-largest cryptocurrency by market capitalization and having a wide-ranging ecosystem of decentralized applications (dApps), certainly offers potential for growth. However, as with all investments, Ethereum comes with its own set of risks, including high volatility and regulatory scrutiny. It’s always recommended that you conduct your own thorough research, and possibly seek investment advice from a financial advisor before making investment decisions.
How High Can ETH Go?
Predicting the upper limit for Ethereum’s price is an immensely complex task, laden with uncertainties. Ethereum has shown immense growth potential in the past, thanks to its versatile platform that supports smart contracts and dApps. This makes it unique and much more than just a digital currency. However, its price is influenced by a broad range of factors, from technological developments and adoption rates to regulatory changes and macroeconomic trends. Thus, while it is possible that Ethereum’s price could reach unprecedented highs, it is also subjected to periods of significant volatility. Remember to invest only what you can afford to lose and make decisions based on comprehensive research.
Will ETH Crash Again in 2024?
Crypto markets are notoriously volatile, and price drops are part of the landscape, as are price surges. Predicting a specific crash for Ethereum or any other crypto is challenging as it depends on numerous factors, many of which are unpredictable or external to the crypto market itself such as regulatory changes, technological advancements, investor sentiment, and macroeconomic factors. As a potential investor, it’s vital to be aware of this volatility and make sure any investment in Ethereum fits with your overall investment strategy and risk tolerance. As always, thorough research and possibly professional advice are key when navigating these waters.