Hey there, wonderful readers! I’m truly thrilled to have you here, and today, we’re diving into something incredibly intriguing: The EOS price prediction from 2024 to 2030. Predicting the price of any cryptocurrency is more of an art than a science, and EOS is no different. This roller-coaster ride of numbers and percentages can seem a little daunting, but don’t worry, we’ll be tackling it together!
The world of cryptocurrency is ever-changing, making it a challenging task to predict prices accurately. However, understanding the past and the purpose of these digital assets, like EOS, can provide vital clues to future trends. With the right blend of historical analysis, an understanding of the origin and purpose of EOS blockchain protocol, and the application of advanced predictive tools, we might just be able to peek into the future.
Now, why is it important to predict EOS coin’s value, you might ask? Well, a deeper understanding of price trends aids investors and traders in making informed decisions. Knowing where the price could potentially go means you can strategize your investment plans accordingly, minimizing risk and maximizing returns. It’s like having a roadmap for a journey in the volatile world of crypto!
Now that we’ve set the stage, I invite you to join me in this exciting exploration. We’ll dig deeper into EOS’s price history, examine the tools traders use for forecasts, and discuss expert opinions on EOS’s future. Whether you’re a seasoned investor or a newbie, this article promises to enlighten and engage. So, buckle up, and let’s dive right into the world of EOS price prediction! You’re not going to want to miss this.
EOS (EOS) Overview
| EOS Price | $0.5801 |
| EOS Price Change 24h | 2.76% |
| EOS Price Change 7d | 6.45% |
| EOS Market Cap | $0.00 |
| EOS Circulating Supply | 0.00 |
| EOS Trading Volume | $2,708,102.38 |
| EOS All-Time Low (ATL) | $22.89 |
| EOS All-Time Low (ATL) | $0.4802 |
A Brief History: EOS and Its Purpose
Let’s embark on a journey back in time to uncover the origin story of EOS and its purpose. EOS was conceived as an ambitious project by Block.one, a blockchain software company. Launched in June 2018, EOS’s primary goal was to revolutionize the world of blockchain by offering scalable, flexible, and user-friendly solutions for the development and execution of decentralized applications (dApps). Imagine EOS as a skyscraper where each floor represents a dApp with its own unique functionality, and the building’s infrastructure, the EOS blockchain, provides the needed support, security, and resources.
The EOS token acts as a kind of ‘digital real estate’ in this building. The more tokens a developer holds, the more resources they can access on the EOS network. But it isn’t just a haven for developers. For the regular Joe and Jane, EOS promises quicker and cheaper transactions compared to many other cryptocurrencies. The blend of scalability, usability, and performance make EOS a serious contender in the crypto arena, thus making it a fascinating subject for our EOS price prediction.
Now, no cryptocurrency story is complete without a dramatic narrative of price swings, and EOS has its share of riveting tales. Buckle up as we traverse through some of the most memorable moments in EOS’s price history:
- The EOS ICO, which ran from 2017 to 2018, ended with EOS priced around $14, a significant surge from its initial offering.
- In April 2018, EOS coin experienced a bull run that saw its price spike to an all-time high of nearly $22.
- The crypto winter of 2018 wasn’t kind to EOS as its price plummeted to less than $2 by the end of the year.
- A recovery was seen in 2019 with a peak of around $8 in June, only to see a gradual decline through the rest of the year.
- Despite the global pandemic in 2020, EOS coin managed a stable range of $2-$3 for most of the year, showing resilience in an uncertain period.
As we journey forward in time, these historical price movements in EOS price history give us an invaluable perspective. The past, they say, is a good indicator of the future. So, armed with this knowledge, let’s dive deeper into the world of EOS price prediction. Remember, knowledge is power and it’s high time we wielded it.
EOS – EOS Price Prediction For Today, Tomorrow, This Week, and Next 30 Days
| Date | Price | Change |
|---|---|---|
| July 19, 2025 | 0.58 | -0.37% |
| July 20, 2025 | 0.57 | -0.88% |
| July 21, 2025 | 0.58 | 0.68% |
| July 22, 2025 | 0.57 | -0.31% |
| July 23, 2025 | 0.58 | 0.75% |
| July 24, 2025 | 0.58 | 0.50% |
| July 25, 2025 | 0.58 | 0.47% |
| July 26, 2025 | 0.59 | 0.63% |
| July 27, 2025 | 0.59 | 0.36% |
| July 28, 2025 | 0.59 | -0.53% |
| July 29, 2025 | 0.59 | -0.34% |
| July 30, 2025 | 0.59 | 0.57% |
| July 31, 2025 | 0.59 | -0.56% |
| August 01, 2025 | 0.59 | 0.35% |
| August 02, 2025 | 0.58 | -0.45% |
| August 03, 2025 | 0.58 | -0.04% |
| August 04, 2025 | 0.59 | 0.48% |
| August 05, 2025 | 0.59 | 0.14% |
| August 06, 2025 | 0.59 | -0.47% |
| August 07, 2025 | 0.58 | -0.68% |
| August 08, 2025 | 0.58 | 0.52% |
| August 09, 2025 | 0.58 | -0.52% |
| August 10, 2025 | 0.59 | 0.63% |
| August 11, 2025 | 0.59 | 0.92% |
| August 12, 2025 | 0.59 | -0.81% |
| August 13, 2025 | 0.58 | -0.43% |
| August 14, 2025 | 0.59 | 0.90% |
| August 15, 2025 | 0.59 | -0.08% |
| August 16, 2025 | 0.59 | -0.03% |
| August 17, 2025 | 0.59 | 0.69% |
EOS Price Prediction 2024
After analyzing EOS’s future price data for 2024, we found that the projected minimum price is $0.5219, while the average price and maximum one are $0.6089 and $0.6959, respectively.
Our assessment of future returns based on this data suggests that EOS price prediction 2024 is relatively stable, with moderate growth expected.
The narrow price range implies that the market may not anticipate significant fluctuations in value, but there is still potential for substantial returns for those willing to take on high risks associated with investing in EOS.
Nonetheless, cryptocurrency investors must be cautious and carry out thorough research before making any investment decisions in this space due to the historical volatility of cryptocurrencies and the continuously evolving market landscape.
| Month | Minimum Price | Average Price | Maximum Price |
|---|---|---|---|
| February 2024 | 0.7996 | 0.8303 | 0.8644 |
| March 2024 | 0.8212 | 0.8527 | 0.8877 |
| April 2024 | 0.8434 | 0.8758 | 0.9117 |
| May 2024 | 0.8661 | 0.8994 | 0.9363 |
| June 2024 | 0.8895 | 0.9237 | 0.9616 |
| July 2024 | 0.9135 | 0.9486 | 0.9875 |
| August 2024 | 0.9382 | 0.9743 | 1.0142 |
| September 2024 | 0.9635 | 1.0006 | 1.0416 |
| October 2024 | 0.9896 | 1.0276 | 1.0697 |
| November 2024 | 1.0163 | 1.0553 | 1.0986 |
| December 2024 | 1.0437 | 1.0838 | 1.1283 |
| January 2025 | 1.0719 | 1.1131 | 1.1587 |
January 2024: EOS Price Forecast
As we enter 2024, EOS opens the year with a potential minimum price of $0.7734. Our team’s analysis suggests an average trading range around $0.8121, with the possibility of peaks reaching as high as $0.8476. This upward trend indicates a robust start for EOS, reflecting increased investor confidence and market stability.
EOS Price Forecast for February 2024
February brings a cautiously optimistic outlook for EOS with a minimum price of $0.7996, suggesting a stable base for the asset. The average price hovers at $0.8303, pointing to a resilient mid-market value, while the maximum price reaches $0.8644. This upward trend reflects confidence in EOS’s adoption and utility within the cryptocurrency ecosystem.
March 2024: EOS Price Forecast
For March, our analysis reveals a consistent ascent in EOS valuation. We’re looking at a minimum price of $0.8212, indicating a strong support level. The average price climbs to $0.8527, demonstrating sustained investor interest, and a maximum price of $0.8877, suggesting the potential for significant peaks should market conditions prove favorable.
EOS Price Forecast for April 2024
April’s forecast for EOS signals a robust market presence with a minimum price of $0.8434. The asset’s average price is expected to appreciate to $0.8758, potentially due to increasing blockchain adoption. Meanwhile, the maximum price might reach $0.9117, which could be propelled by positive market sentiment and innovative platform updates.
May 2024: EOS Price Forecast
May projects a promising trajectory for EOS, with a minimum price of $0.8661 indicating steady growth. The average price is predicted to be $0.8994, which may attract a broader investment base. The maximum price could ascend to $0.9363, potentially reflecting a peak in trading activity and investor optimism.
EOS Price Forecast for June 2024
As we move into June, EOS’s financial outlook appears to strengthen, with a minimum price of $0.8895 serving as a testament to its resilience. The average price is expected to edge up to $0.9237, mirroring an increasing trust in the asset’s long-term value. A maximum price of $0.9616 could be in sight if bullish market trends persist.
July 2024: EOS Price Forecast
July’s data suggests EOS will continue its upward climb with a minimum price of $0.9135, reinforcing the notion of a bullish trend. The average price is set to rise to $0.9486, indicating a consolidating market position. The maximum price forecast of $0.9875 could mark the zenith of this month’s price range, potentially setting new records.
EOS Price Forecast for August 2024
In August, EOS is poised to maintain its upward trajectory with a minimum price of $0.9382, suggesting a robust baseline. The average price is anticipated to be $0.9743, which might reflect growing adoption in decentralized applications. The maximum price is projected to break the $1 threshold, standing at $1.0142, hinting at a particularly bullish period.
September 2024: EOS Price Forecast
September sees EOS potentially hitting a pivotal point, with a minimum price of $0.9635 indicating strong market support. The average price is expected to cross the symbolic $1 mark, landing at $1.0006, which could signify a major milestone for the cryptocurrency. The maximum price is predicted to be $1.0416, possibly as a result of heightened investor confidence.
EOS Price Forecast for October 2024
For October, EOS’s price forecast suggests a continuation of the growth trend, with the minimum price expected at $0.9896. The average price is seen reaching $1.0276, pointing to a robust demand. A maximum price of $1.0697 could be driven by speculative trading and potential strategic partnerships or developments within the EOS network.
November 2024: EOS Price Forecast
November’s analysis for EOS indicates an optimistic end-of-year sentiment with a minimum price of $1.0163, reaffirming the asset’s growth. The average price is calculated to be $1.0553, likely influenced by the cumulative effect of the year’s positive developments. The maximum price might peak at $1.0986, potentially spurred by end-of-year rallies.
XLM Price Forecast for December 2024
Wrapping up the year, December’s forecast shows no signs of a slowdown for EOS, with a minimum price of $1.0437 suggesting a new support level. The average price aims higher at $1.0838, a reflection of the year’s positive adoption trends. The maximum price takes a confident leap to $1.1283, possibly as traders capitalize on the festive season’s increased trading volumes.
EOS Price Prediction 2025
Fast-forwarding to 2025, EOS seems to carry on its upward trend. The token’s minimum price is anticipated to rise to a solid $0.94. On the brighter side, the average price might reach a handsome $1.11. Buckle up, because we’re expecting a maximum price of about $1.33.
| Month | Minimum Price | Average Price | Maximum Price |
|---|---|---|---|
| February 2025 | 0.9396 | 0.9757 | 1.0157 |
| March 2025 | 0.9649 | 1.0020 | 1.0431 |
| April 2025 | 0.9910 | 1.0290 | 1.0712 |
| May 2025 | 1.0177 | 1.0568 | 1.1002 |
| June 2025 | 1.0452 | 1.0854 | 1.1299 |
| July 2025 | 1.0734 | 1.1147 | 1.1604 |
| August 2025 | 1.1024 | 1.1448 | 1.1917 |
| September 2025 | 1.1322 | 1.1757 | 1.2239 |
| October 2025 | 1.1627 | 1.2074 | 1.2569 |
| November 2025 | 1.1941 | 1.2400 | 1.2909 |
| December 2025 | 1.2264 | 1.2735 | 1.3257 |
| January 2026 | 1.2595 | 1.3079 | 1.3615 |
EOS Price Prediction 2026
Sailing into 2026, our experts anticipate EOS to maintain its bullish momentum. Our price prediction sees a minimum price of $1.25, while the average value could leap to around $1.48. Hold onto your hats, because the maximum price might soar to an astonishing $1.76.
| Month | Minimum Price | Average Price | Maximum Price |
|---|---|---|---|
| February 2026 | 1.2461 | 1.2940 | 1.3471 |
| March 2026 | 1.2798 | 1.3290 | 1.3834 |
| April 2026 | 1.3143 | 1.3648 | 1.4208 |
| May 2026 | 1.3498 | 1.4017 | 1.4592 |
| June 2026 | 1.3863 | 1.4395 | 1.4986 |
| July 2026 | 1.4237 | 1.4784 | 1.5390 |
| August 2026 | 1.4621 | 1.5183 | 1.5806 |
| September 2026 | 1.5016 | 1.5593 | 1.6232 |
| October 2026 | 1.5422 | 1.6014 | 1.6671 |
| November 2026 | 1.5838 | 1.6447 | 1.7121 |
| December 2026 | 1.6266 | 1.6891 | 1.7583 |
| January 2027 | 1.6705 | 1.7347 | 1.8058 |
EOS Price Prediction 2027
Looking ahead to 2027, EOS price prediction model promises an intriguing scenario. We predict a minimum price set to rest at $1.65. But keep your eyes open for an average price that could shoot up to roughly $1.96. The year could see a high tide with a maximum price possibly touching $2.33.
| Month | Minimum Price | Average Price | Maximum Price |
|---|---|---|---|
| February 2027 | 1.6516 | 1.7151 | 1.7854 |
| March 2027 | 1.6962 | 1.7614 | 1.8336 |
| April 2027 | 1.7420 | 1.8090 | 1.8831 |
| May 2027 | 1.7891 | 1.8578 | 1.9340 |
| June 2027 | 1.8374 | 1.9080 | 1.9862 |
| July 2027 | 1.8870 | 1.9595 | 2.0398 |
| August 2027 | 1.9379 | 2.0124 | 2.0949 |
| September 2027 | 1.9902 | 2.0667 | 2.1514 |
| October 2027 | 2.0440 | 2.1225 | 2.2095 |
| November 2027 | 2.0992 | 2.1798 | 2.2692 |
| December 2027 | 2.1558 | 2.2387 | 2.3305 |
| January 2028 | 2.2141 | 2.2991 | 2.3934 |
EOS Price Prediction 2028
As we step into 2028, EOS price prediction continues its positive march. The minimum price is predicted to reach $2.19, and the average price doesn’t plan on falling behind, speculated to hit $2.59. Meanwhile, the maximum price might just make headlines, rocketing to an exciting $3.08.
| Month | Minimum Price | Average Price | Maximum Price |
|---|---|---|---|
| February 2028 | 2.1857 | 2.2697 | 2.3627 |
| March 2028 | 2.2447 | 2.3310 | 2.4265 |
| April 2028 | 2.3053 | 2.3939 | 2.4920 |
| May 2028 | 2.3676 | 2.4585 | 2.5593 |
| June 2028 | 2.4315 | 2.5249 | 2.6284 |
| July 2028 | 2.4971 | 2.5931 | 2.6994 |
| August 2028 | 2.5646 | 2.6631 | 2.7723 |
| September 2028 | 2.6338 | 2.7350 | 2.8471 |
| October 2028 | 2.7049 | 2.8088 | 2.9240 |
| November 2028 | 2.7779 | 2.8847 | 3.0029 |
| December 2028 | 2.8529 | 2.9626 | 3.0840 |
| January 2029 | 2.9300 | 3.0425 | 3.1673 |
EOS Price Prediction 2029
Moving onto 2029, the EOS train doesn’t seem to stop. We’re foreseeing a minimum price of $2.9. But the real magic might happen with an average price potentially climbing to a solid $3.44. The year could end with a bang, with the maximum value reaching a grand $4.09.
| Month | Minimum Price | Average Price | Maximum Price |
|---|---|---|---|
| February 2029 | 2.8978 | 3.0091 | 3.1325 |
| March 2029 | 2.9760 | 3.0904 | 3.2171 |
| April 2029 | 3.0564 | 3.1738 | 3.3039 |
| May 2029 | 3.1389 | 3.2595 | 3.3931 |
| June 2029 | 3.2236 | 3.3475 | 3.4847 |
| July 2029 | 3.3107 | 3.4379 | 3.5788 |
| August 2029 | 3.4001 | 3.5307 | 3.6755 |
| September 2029 | 3.4919 | 3.6260 | 3.7747 |
| October 2029 | 3.5861 | 3.7239 | 3.8766 |
| November 2029 | 3.6830 | 3.8245 | 3.9813 |
| December 2029 | 3.7824 | 3.9277 | 4.0888 |
| January 2030 | 3.8845 | 4.0338 | 4.1992 |
EOS Price Prediction 2030
As we welcome the dawn of a new decade in 2030, EOS price prediction is geared to make strides. The projected minimum price stands at $3.84. However, the showstopper could be the average price, potentially surging to a sweet $4.55. Don’t take your eyes off the prize as the maximum price might spike to an unbelievable $5.41.
| Month | Minimum Price | Average Price | Maximum Price |
|---|---|---|---|
| February 2030 | 3.8373 | 3.9848 | 4.1481 |
| March 2030 | 3.9409 | 4.0923 | 4.2601 |
| April 2030 | 4.0473 | 4.2028 | 4.3752 |
| May 2030 | 4.1566 | 4.3163 | 4.4933 |
| June 2030 | 4.2688 | 4.4329 | 4.6146 |
| July 2030 | 4.3841 | 4.5525 | 4.7392 |
| August 2030 | 4.5025 | 4.6755 | 4.8672 |
| September 2030 | 4.6240 | 4.8017 | 4.9986 |
| October 2030 | 4.7489 | 4.9313 | 5.1335 |
| November 2030 | 4.8771 | 5.0645 | 5.2721 |
| December 2030 | 5.0088 | 5.2012 | 5.4145 |
| January 2031 | 5.1440 | 5.3417 | 5.5607 |
EOS Price Prediction 2031
As EOS price prediction sails into 2031, the bullish momentum persists. We’re predicting a minimum price of $5.08. The average price is anticipated to inch up to a comfortable $6.03. Hang tight, because the maximum value might just surprise us all, peaking at a striking $7.17.
| Month | Minimum Price | Average Price | Maximum Price |
|---|---|---|---|
| February 2031 | 5.0835 | 5.2788 | 5.4952 |
| March 2031 | 5.2207 | 5.4213 | 5.6436 |
| April 2031 | 5.3617 | 5.5677 | 5.7960 |
| May 2031 | 5.5064 | 5.7180 | 5.9524 |
| June 2031 | 5.6551 | 5.8724 | 6.1132 |
| July 2031 | 5.8078 | 6.0310 | 6.2782 |
| August 2031 | 5.9646 | 6.1938 | 6.4477 |
| September 2031 | 6.1257 | 6.3610 | 6.6218 |
| October 2031 | 6.2911 | 6.5328 | 6.8006 |
| November 2031 | 6.4609 | 6.7092 | 6.9842 |
| December 2031 | 6.6354 | 6.8903 | 7.1728 |
| January 2032 | 6.8145 | 7.0763 | 7.3665 |
EOS Price Prediction 2032
Fast-forwarding to 2032, EOS price prediction appears to end on a high note. Our forecast places the minimum price at a solid $6.74. On a brighter note, the average price could scale up to a remarkable $7.99. Gear up for a thrilling climb with the maximum value potentially hitting a whopping $9.5.
| Month | Minimum Price | Average Price | Maximum Price |
|---|---|---|---|
| February 2032 | 6.7351 | 6.9939 | 7.2806 |
| March 2032 | 6.9169 | 7.1827 | 7.4772 |
| April 2032 | 7.1037 | 7.3766 | 7.6791 |
| May 2032 | 7.2955 | 7.5758 | 7.8864 |
| June 2032 | 7.4925 | 7.7804 | 8.0993 |
| July 2032 | 7.6948 | 7.9904 | 8.3180 |
| August 2032 | 7.9025 | 8.2062 | 8.5426 |
| September 2032 | 8.1159 | 8.4277 | 8.7733 |
| October 2032 | 8.3350 | 8.6553 | 9.0101 |
| November 2032 | 8.5601 | 8.8890 | 9.2534 |
| December 2032 | 8.7912 | 9.1290 | 9.5033 |
| January 2033 | 9.0286 | 9.3755 | 9.7599 |
The Main Questions Of Critical Thinking When We Talk About EOS Coin Price Forecast
Critical thinking is vital in analyzing and understanding price predictions about the future price of EOS. Here are three critical thinking questions that could guide our exploration:
- What drives the divergence in expert opinions? Given the same information, experts may arrive at different EOS price predictions. What are the factors behind these differences? Do they arise from variations in interpretation, bias, methodology, or assumptions about the future?
- How does market psychology affect EOS price predictions? The price of cryptocurrencies, including EOS, is not only influenced by economic factors but also by the emotions and behavior of traders. How does this market psychology factor into the price predictions? And how can this impact the accuracy of these EOS price predictions?
- What are the implications of regulatory changes? Regulatory shifts can significantly affect the crypto market. How might potential regulatory changes, like those concerning privacy, security, or taxation, influence the future price of EOS? Are these potential changes considered in the EOS price predictions?
By considering these questions, we can gain a deeper understanding of the EOS price prediction model and potentially improve our ability to anticipate future price movements.
EOS Future Price Predictions by Experts
Diving into expert opinions about the EOS price predictions can be a thrilling venture as these views vary greatly based on their perspective, analysis, and personal biases. Experts tend to base their price predictions on a combination of market trends, technical analysis, fundamental analysis, and sometimes even personal intuition.
- Trading Beasts’ price prediction: According to the Trading Beast EOS forecast, the average price in January 2024 will be $2.81. The source predicts a bullish trend that will last all the way to December — the EOS cost will reach $3.64 (average closing price). To put it into perspective, this is a 40% growth in one year. Trading Beasts did not want to look so far into the future. The price prediction is limited to 2025. At the beginning of 2025, the EOS value will be $3.70 (average price). In the middle of the year, in June, the EOS price will rise to $3.99. The year is predicted to end at $4.31.
- Wallet Investor’s price prediction: January 2024, according to Wallet Investor’s EOS price prediction, will start with $3.06. Following the same dynamic as the years prior, EOS might reach the year’s highest price point in May – an average value of $7.55 and a maximum closing price of $10.72. Unfortunately, these prices won’t last long, and EOS price will enter a bear market for the rest of 2024. The average closing price in December is $3.76. January 2025 will begin with $3.82 (average price). The steady uptrend might bring the EOS cost to over $8.30 (even reaching $11.84 as the maximum value). By the end of the year, EOS price might settle at 4.50, which is much lower than its mid-year performance but still higher than what it was in January. From January 2026 to May 2026, EOS might gain momentum and grow from $4.54 to $9.02. At this point, it’s quite predictable that Wallet Investor’s price prediction envisions a downtrend that continues for the rest of the year. The year’s closing price might be $5.22. The first few months of 2027 might bring EOS to an average price of $5.85. That said, the price prediction doesn’t go further than February.
- Long Forecast’s price prediction: According to Long Forecast’s price prediction, 2024 is likely to bring high volatility to EOS price. January will open with $2.39, and there might be a short-lived uptrend until the end of February (closing price – $3.04). EOS might be trading over $2.00 in the following months and could eventually drop to $1.71-1.97 in November. 2025 will open at $2.13 (average price). There will be some ups and downs – the price will surpass $3.40 in April, fall back to $3.07, and go up to $3.51, only to enter a bearish trend once again. By December 2025, the price is expected to be at $2.45 (average trading price).
- Coin Price Forecast’s price prediction: EOS price will soar to $3.55 within the first half of the year and finish 2024 at $4.08. Coin Price Forecast predicts that the coin’s value might double compared to its trading price in 2024. Coin Price Forecast’s price prediction experts bring in the most optimistic forecast for the period of 2025-2030. The value in the middle and the end of 2025 are set at $4.86 and $5.41, respectively. If you compare it to where this source puts EOS price by 2030 — $7.03 and $7.38 — you can see that the price surge is expected to be quite significant. This is more than 250% higher than EOS’ trading price in 2024.
Decoding the Charts: EOS Technical Price Analysis
Are you intrigued by the art of deciphering a cryptocurrency price chart, particularly EOS? Well, you’re not alone! As a crypto enthusiast and someone who enjoys guiding others through the complex world of digital assets, I’m here to shed light on the fascinating world of technical analysis in price prediction. Buckle up as we embark on this journey!
Before we plunge into the intricacies, let’s take a moment to skim over some fundamental concepts and tools used in technical analysis. They form the backbone of our discussion:
- Price Chart: The first tool in our technical analysis toolkit. A price chart offers a graphical representation of price movements over a specific period, helping us track patterns and trends for a price prediction.
- Moving Averages: These indicators help smoothen price data by creating a constantly updated average price.
- Relative Strength Index (RSI): A momentum oscillator that measures the speed and change of price movements.
- Fibonacci Retracement: A tool used to identify potential support and resistance levels.
Now, let’s delve deeper.
Technical Indicators in EOS Price Predictions: Origin and Purpose
Technical indicators, also known as the ‘compass’ of the trading world, came into existence to make sense of the financial markets’ wild price fluctuations. Traders and investors needed something to guide them through the jungle of numbers, and that’s where technical indicators stepped in. These are mathematical calculations based on a security’s price and volume. The results are used to predict future price changes and identify trading opportunities. They’re our guiding star, illuminating the path in the ever-turbulent financial markets!
The Role of Technical Indicators for EOS Price Predictions
In financial markets, technical indicators are akin to a weather forecast. Just as meteorologists predict the weather using temperature, humidity, and wind speed data, traders use technical indicators to forecast price movements. They help gauge the market’s momentum, identify trend reversals, and spotlight potential entry and exit points. Without these nifty tools, trading would be like sailing a ship without a compass – aimless and fraught with danger.
How Technical Indicators Can Be Used in EOS Price Predictions
When it comes to EOS price prediction, technical indicators can be a game-changer. They can reveal hidden patterns in the EOS price data and provide invaluable insights into market sentiment and price prediction.
For instance, if EOS price is trending upwards and the RSI is below 70, it may suggest that EOS is experiencing a bullish momentum and it’s not yet overbought. Conversely, if the Moving Average indicates a downtrend, it might be a signal to tread with caution.
In a nutshell, technical indicators serve as our trusty companions on the exhilarating journey of EOS price prediction. They help us chart the course and navigate the turbulent waves of the crypto ocean. So, whether you’re a seasoned trader or just starting, understanding these indicators can unlock the door to more informed decision-making.
I know how important it is to have a solid understanding of the most common technical indicators used for both crypto prices and predicting the price of EOS. Thus, in this section, I’ll share with you the essential indicators that I’ve found particularly helpful in my own trade journey, and I’ll provide real-life examples of how to apply them to EOS prediction.
Moving Averages (MAs) for EOS Price Prediction
At the core of technical analysis are Moving Averages (MAs). These serve to smooth out price data, creating a line that helps identify trends.
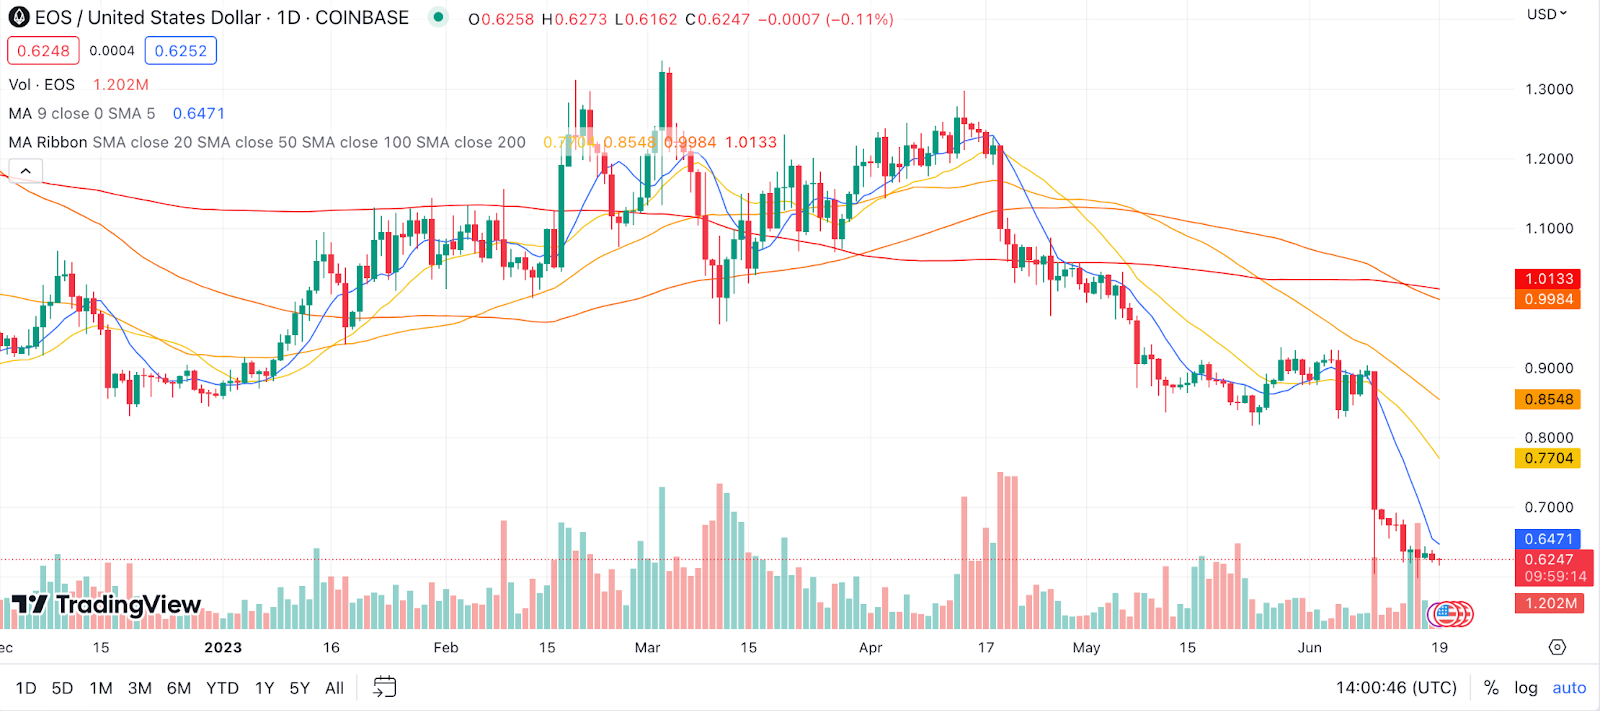
Example: In the context of EOS forecast, if you observe the 50-day MA moving above the 200-day MA, it may indicate an emerging bullish trend. This could be a sign to EOS investors and traders to consider buying. On the other hand, if the 50-day MA crosses below the 200-day MA, it signals a potential bearish trend. Investors and traders might see this as a warning to sell or hold off on buying EOS. Keep in mind that these trends are not set in stone and should be considered in conjunction with other indicators.
Relative Strength Index (RSI) in EOS Price Prediction
The Relative Strength Index (RSI) is a momentum oscillator that measures the speed and change of rate movements. It provides readings between zero and 100, and traders typically consider an asset overbought when the RSI is above 70 and oversold when it’s below 30.

Example: When applied to EOS forecast, if the price has seen rapid increases and the RSI value goes over 70, it could suggest that EOS is currently overbought. This often precedes a price correction or a downturn. Conversely, if the RSI dips below 30, it’s an indication that EOS is oversold, which might be followed by a price increase. By keeping an eye on these levels, you can get an idea of possible future price changes.
Moving Average Convergence Divergence (MACD) – EOS Prediction
The MACD is another momentum-based indicator. It shows the relationship between two moving averages of a security’s price and comprises two lines: the MACD line and the signal line.

Example: For EOS forecast, the MACD is calculated by subtracting the 26-day exponential moving average (EMA) from the 12-day EMA. A nine-day EMA of the MACD, called the “signal line,” is then plotted on top of the MACD line, which functions as a trigger for buy and sell signals. If the MACD crosses above the signal line, it suggests a bullish signal, indicating a good time to buy EOS. Conversely, a MACD line crossing below the signal line gives a bearish signal and might be a good time to sell EOS.
Bollinger Bands for EOS Price Prediction Forecast
Bollinger Bands are a volatility indicator that consists of a moving average and two standard deviations plotted above and below the moving average. They are used to identify overbought and oversold conditions, as well as to determine the strength and direction of a trend.
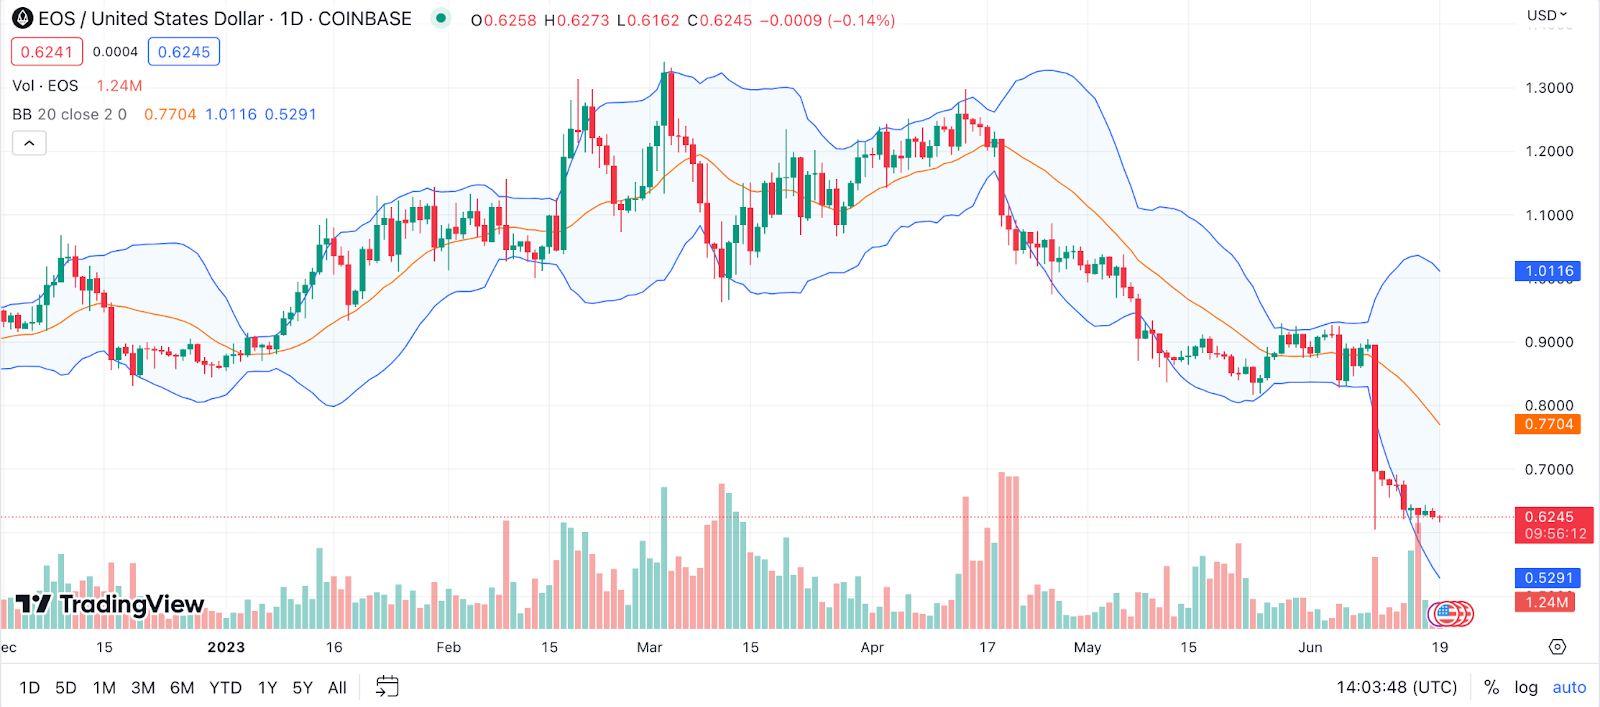
Example: When the price of EOS touches the upper Bollinger Band, it might indicate that the market is overbought, suggesting a potential price decrease. On the other hand, if the price touches the lower band, it might indicate the market is oversold, suggesting a potential price increase.
Stochastic Oscillator for EOS Price Prediction Forecast
The Stochastic Oscillator, a momentum indicator, compares a specific closing price of EOS to its price range over a certain time frame. The oscillator generates values between 0 and 100, effectively identifying potential overbought and oversold zones.

Example: Suppose the Stochastic Oscillator gives a reading above 80 for EOS. In that case, it suggests the cryptocurrency might be overbought, and traders might anticipate a bearish reversal. On the other hand, if the oscillator reading drops below 20, it implies that EOS might be oversold, indicating a potential upcoming bullish reversal. These oscillator readings, coupled with other technical indicators, can provide a more comprehensive view of EOS’s potential rate movements.
Parabolic SAR (Stop and Reverse) for EOS Price Prediction Forecast
Parabolic SAR (Stop and Reverse) is a popular trend-following indicator developed by J. Welles Wilder. It is designed to provide potential entry and exit points in the market, represented by dots placed above or below the EOS price chart.

Example: When the dots are below the price, this signifies an upward trend, suggesting a good time to buy EOS. Conversely, when the dots are above the price, it indicates a downward trend, potentially signaling a time to sell or short EOS. The indicator flips sides when the trending price reverses by the amount of a predefined step. For instance, if EOS was on an uptrend with the Parabolic SAR dots below it, but the price falls by the defined step, the dots would then appear above the price, signaling the potential start of a downtrend.
Ichimoku Cloud for EOS Price Prediction
The Ichimoku Cloud, or Ichimoku Kinko Hyo, is a comprehensive indicator that offers information about support and resistance levels, the direction of the trend, and the momentum of EOS. The “cloud” refers to the area between the two leading spans and can be colored or shaded for visual emphasis.

Example: If EOS price today is above the cloud, it’s typically a bullish signal, and if the price is below the cloud, it’s a bearish signal. When the price enters the cloud, the trend is considered neutral. For instance, if we see EOS price rise from below to above the cloud, it could be a sign of a bullish reversal, signaling a good time to buy.
Fibonacci Retracement for EOS Price Prediction
Fibonacci Retracement is a technical tool that uses horizontal lines to indicate potential areas of support or resistance at the key Fibonacci levels before the price of EOS continues in the original direction. These levels are derived from the Fibonacci sequence, a series of numbers where each number is the sum of the two preceding ones. Commonly used levels are 23.6%, 38.2%, 50%, 61.8%, and 100%.
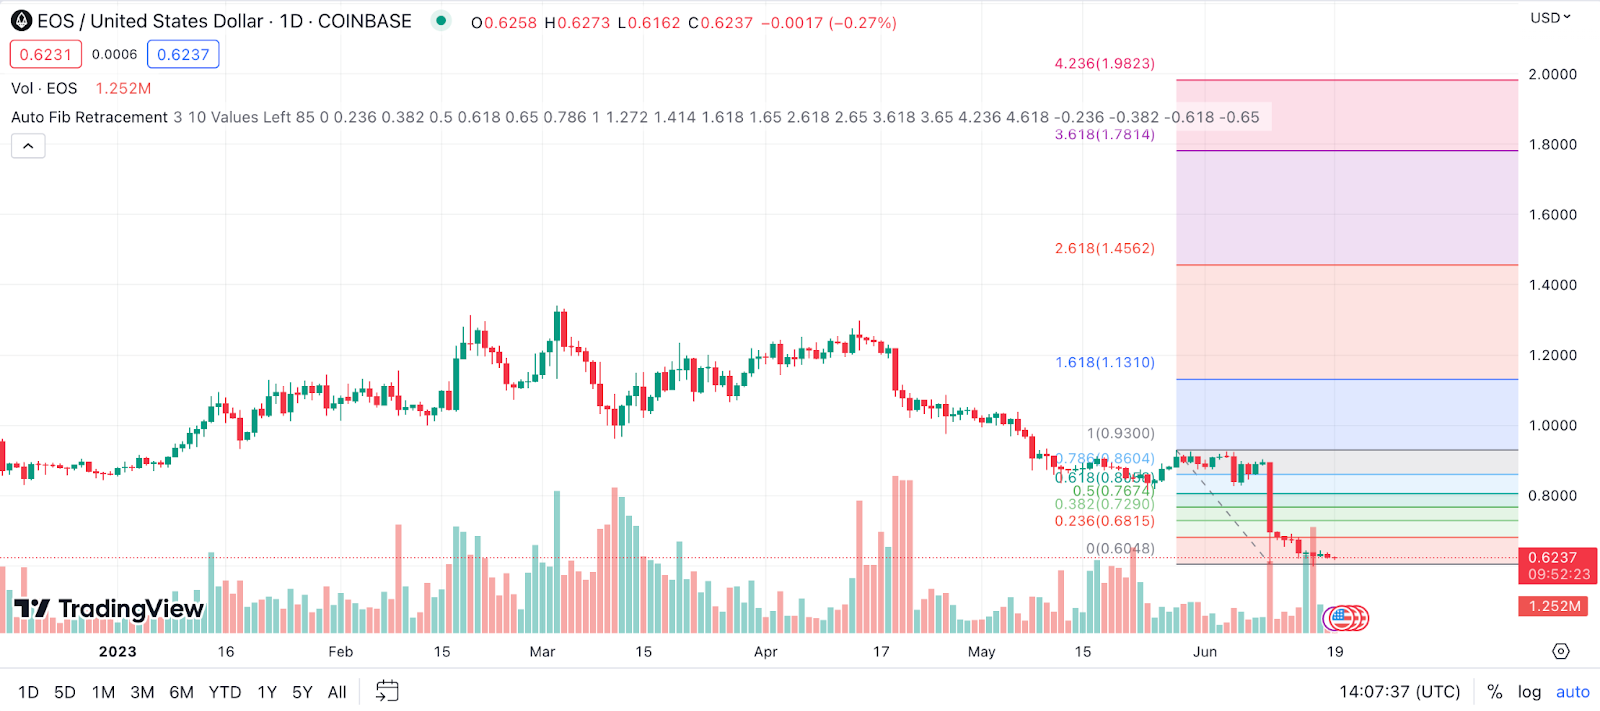
Example: If EOS price increased from $1 to $2, then dropped to $1.50, it has retraced 50% of the previous move. Traders might see this 50% level as a potential area of support or resistance in the future.
Average Directional Index (ADX) for EOS Price Prediction
The Average Directional Index (ADX) is a technical analysis indicator used by traders to determine the strength of a trend. It oscillates between 0 and 100, with readings above 20 indicating a strong trend and readings below 20 indicating a weak trend.

Example: For EOS price prediction, if the ADX is above 20 and the positive directional indicator is above the negative directional indicator, it suggests a strong upward trend. Conversely, if the ADX is above 20 and the negative directional indicator is above the positive one, it suggests a strong downward trend. For instance, if EOS has an ADX reading of 30 with the positive directional indicator prevailing, it indicates a strong bullish momentum and could suggest a good time to buy.
On Balance Volume (OBV) for EOS Price Prediction
The On Balance Volume (OBV) indicator applies a running total to volume and is designed to show the relation between price changes and volume. When EOS price closes higher than the previous close, all of the day’s volume is considered up-volume. When the EOS price closes lower than the previous close, all of the day’s volume is considered down-volume. The OBV is a running total of volume, increasing or decreasing each day according to the day’s close.
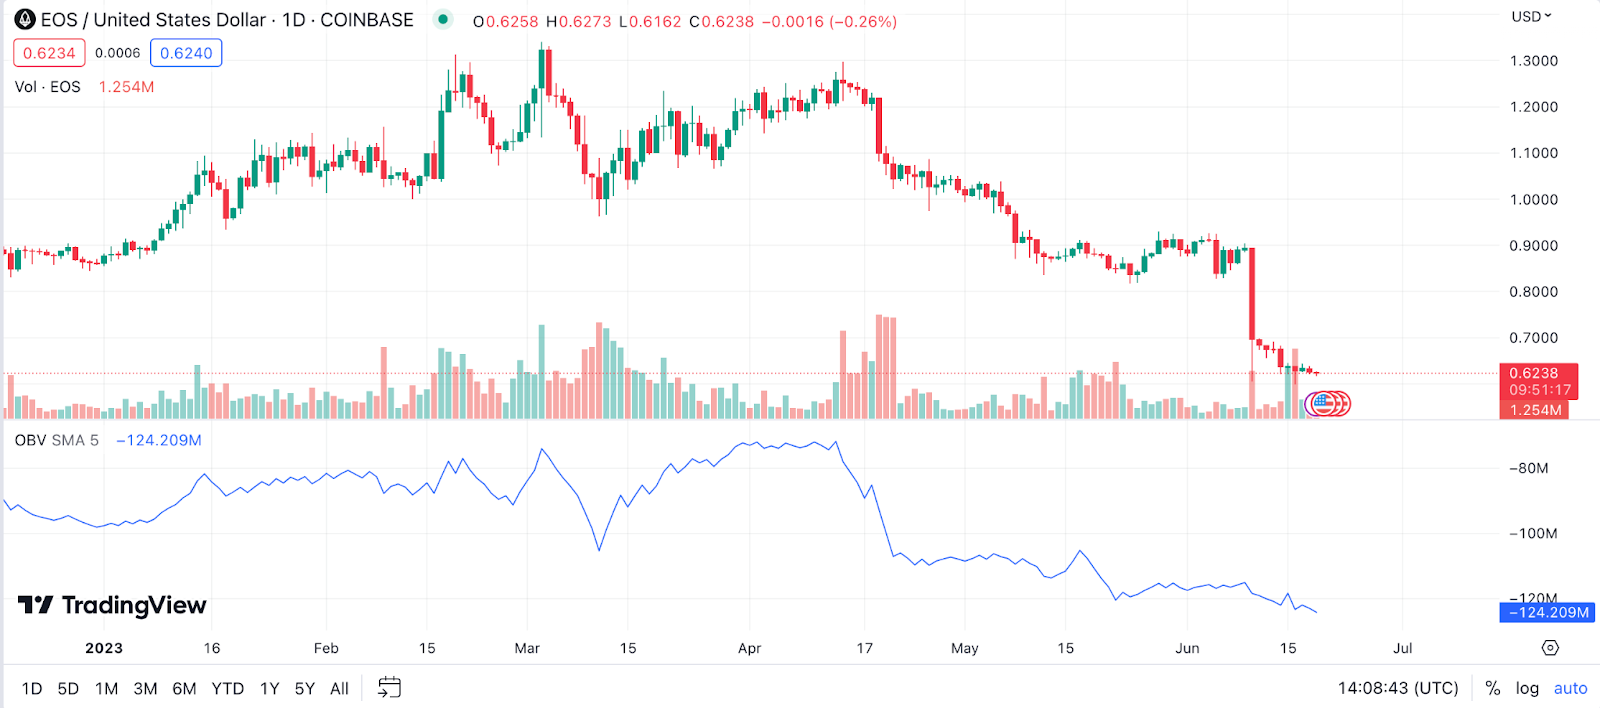
Example: If the EOS price shows an uptrend while the OBV shows a downtrend, this negative divergence could indicate that the uptrend is lacking volume support and may soon reverse.
Rate of Change (ROC) for EOS Price Prediction
The Rate of Change (ROC) is a momentum oscillator that measures the percentage change in price from one period to the next. The ROC rises when the prices trend up and falls when the prices trend down. If the ROC is rising, it suggests that the rate of the EOS price increase is speeding up, while a falling ROC suggests that it is slowing down.
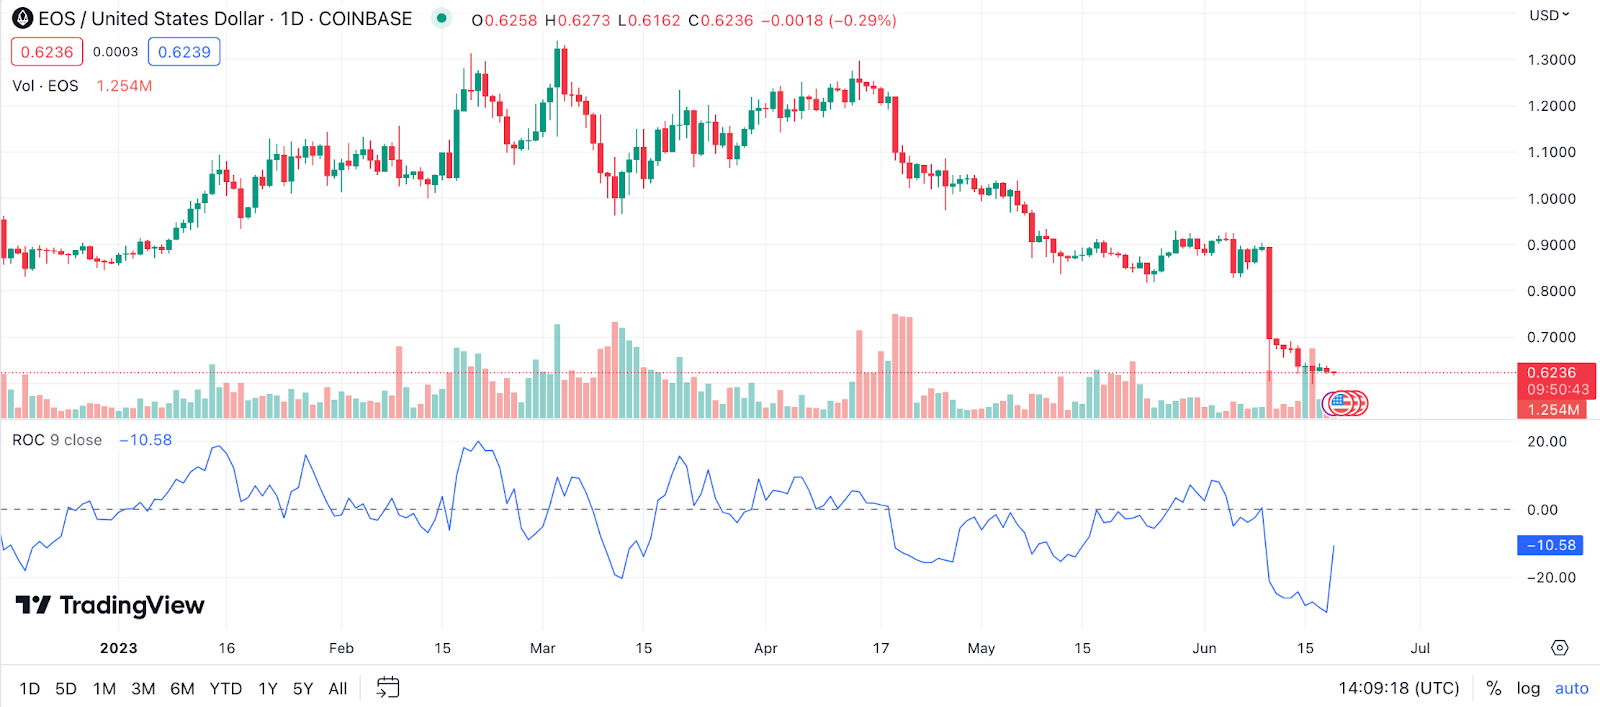
Example: If EOS price jumps from $2 to $4 over 10 days, the ROC at the end of the 10-day period is 100%. If EOS price then falls to $3 over the next 10 days, the ROC at the end of this 10-day period would be -33.33%. Traders often look for divergence and centerline crossovers in the ROC for potential buy and sell signals.
Commodity Channel Index (CCI) for EOS Price Prediction
The Commodity Channel Index (CCI) is a momentum-based oscillator used to help determine when an investment vehicle is reaching a condition of being overbought or oversold. It is also used to gauge the direction and strength of the prevailing trend.

Example: With EOS price prediction, if the CCI is above 100, this signifies that the price may be overbought, and a price reversal may be forthcoming. Conversely, if the CCI is below -100, then the price may be oversold, indicating a potential price rally. Thus, EOS traders often use CCI in conjunction with other indicators to make buy or sell decisions.
Accumulation/Distribution Line (A/D Line) for EOS Price Prediction
The Accumulation/Distribution Line is a volume-based indicator designed to measure the cumulative flow of money into and out of a security. It can help to confirm the strength of trends and predict future price changes.
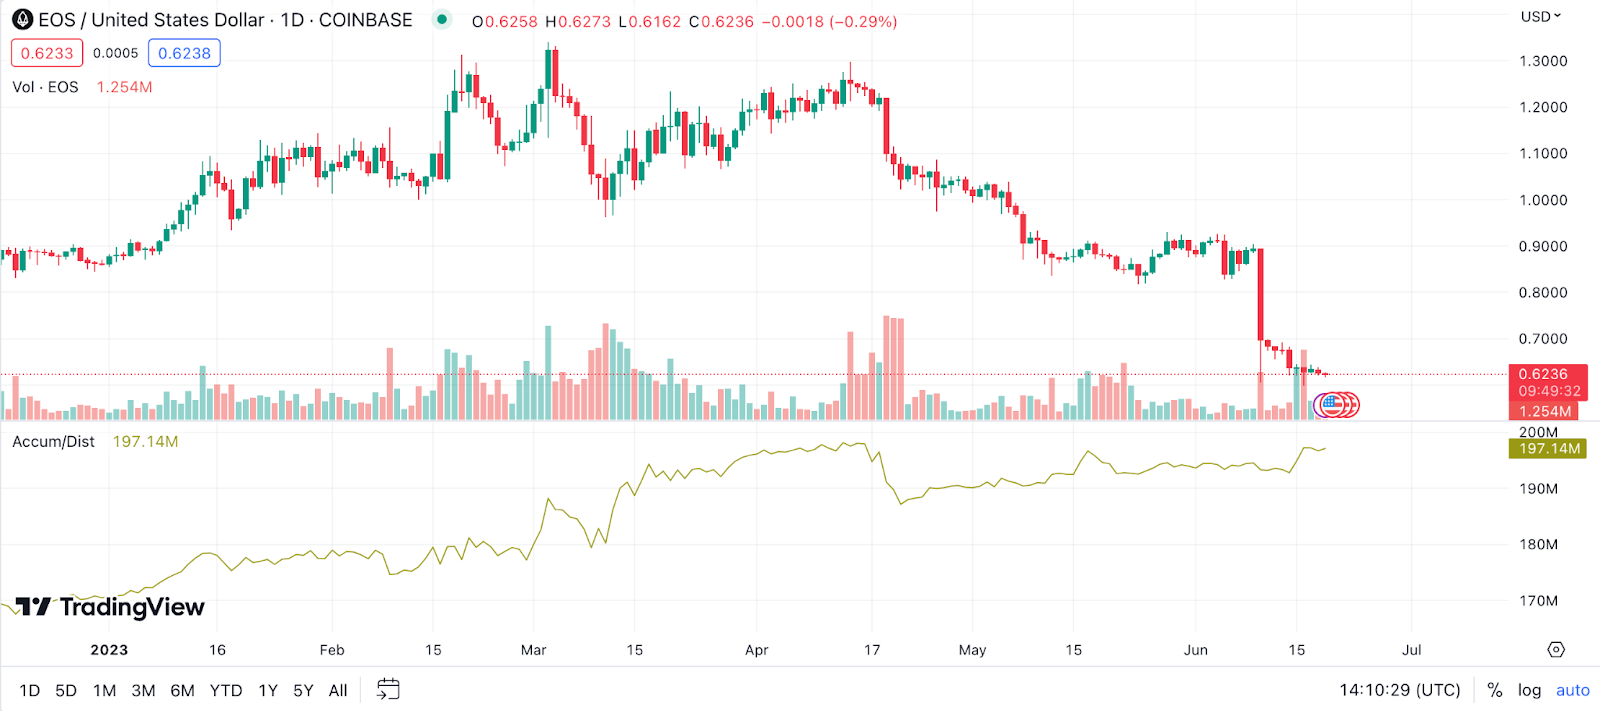
Example: When applied to EOS price prediction, if the price is rising and the A/D Line is trending upwards, it suggests that buying pressure is prevailing and the upward trend is likely to continue. On the other hand, if the EOS price is declining and the A/D Line is trending downwards, it signifies increasing selling pressure, and the downward trend could persist. Divergences between the EOS price and the A/D Line can also signal potential price reversals.
Pivot Points for EOS Price Prediction
Pivot Points are a type of technical indicator that provide a set of significant levels traders can use to gauge rate movement and make price predictions. In the context of EOS, Pivot Points can provide an understanding of potential resistance or support levels.

Example: If EOS price is trading above the pivot point, this could indicate bullish sentiment, and the first level of resistance might serve as a target price for a long position. Conversely, if EOS is trading below the pivot point, this could signal bearish sentiment, and the first level of support might serve as a target price for a short position.
Chaikin Money Flow (CMF) for EOS Price Prediction
Chaikin Money Flow (CMF) is a technical analysis indicator used to measure Money Flow Volume over a set period. The CMF is a volume-weighted average of accumulation and distribution over a specified period.

Example: When applied to EOS price prediction, a positive CMF would indicate buying pressure, which could result in a rise in EOS prices. On the other hand, a negative CMF would suggest selling pressure, which could possibly push EOS prices lower. The CMF can also produce divergent signals when compared with price, thus providing clues about potential reversals.
Aroon Indicator for EOS Price Prediction
The Aroon Indicator is a technical indicator used to identify trend changes and the strength of a trend by using the time elapsed since the lowest and highest price points over a certain period. It consists of two lines: Aroon Up, which measures the strength of the uptrend, and Aroon Down, which measures the strength of the downtrend.
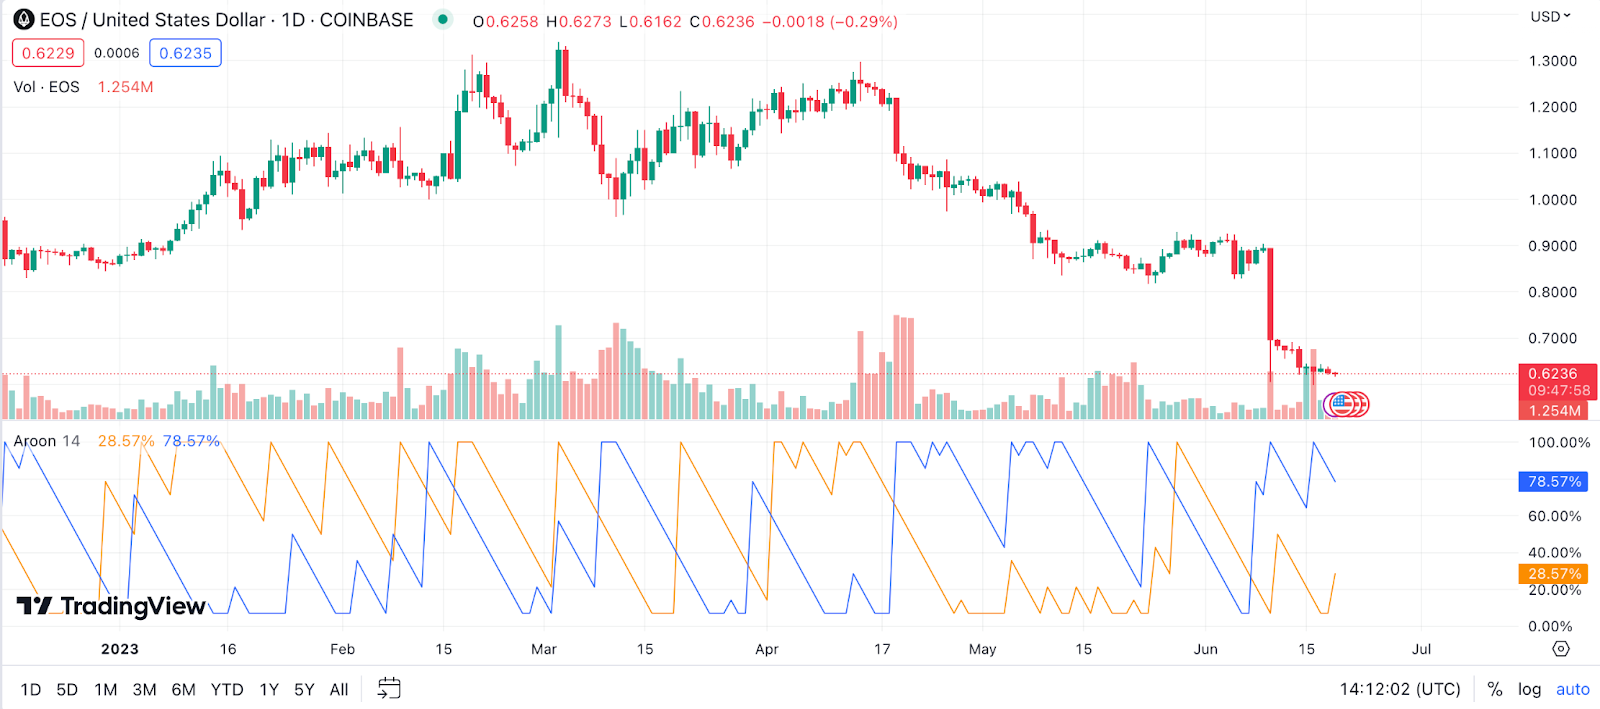
Example: In the context of EOS price prediction, if the Aroon-Up crosses above the Aroon-Down, it indicates a bullish momentum, which could imply a possible appreciation in the value of EOS. On the flip side, if the Aroon-Down crosses above the Aroon-Up, it signals a bearish trend, which could lead to a depreciation in the value of EOS. Therefore, the Aroon Indicator can be a potent tool for EOS traders, helping them gauge the strength and direction of a trend.
Gann Fan for EOS Price Prediction
The Gann Fan is a technical analysis tool created by W.D. Gann. It consists of a series of diagonal lines called Gann angles, used to predict price changes through the relation of time and price. In terms of EOS, the Gann Fan can be used to predict future prices by extending the lines of the fan into the future.
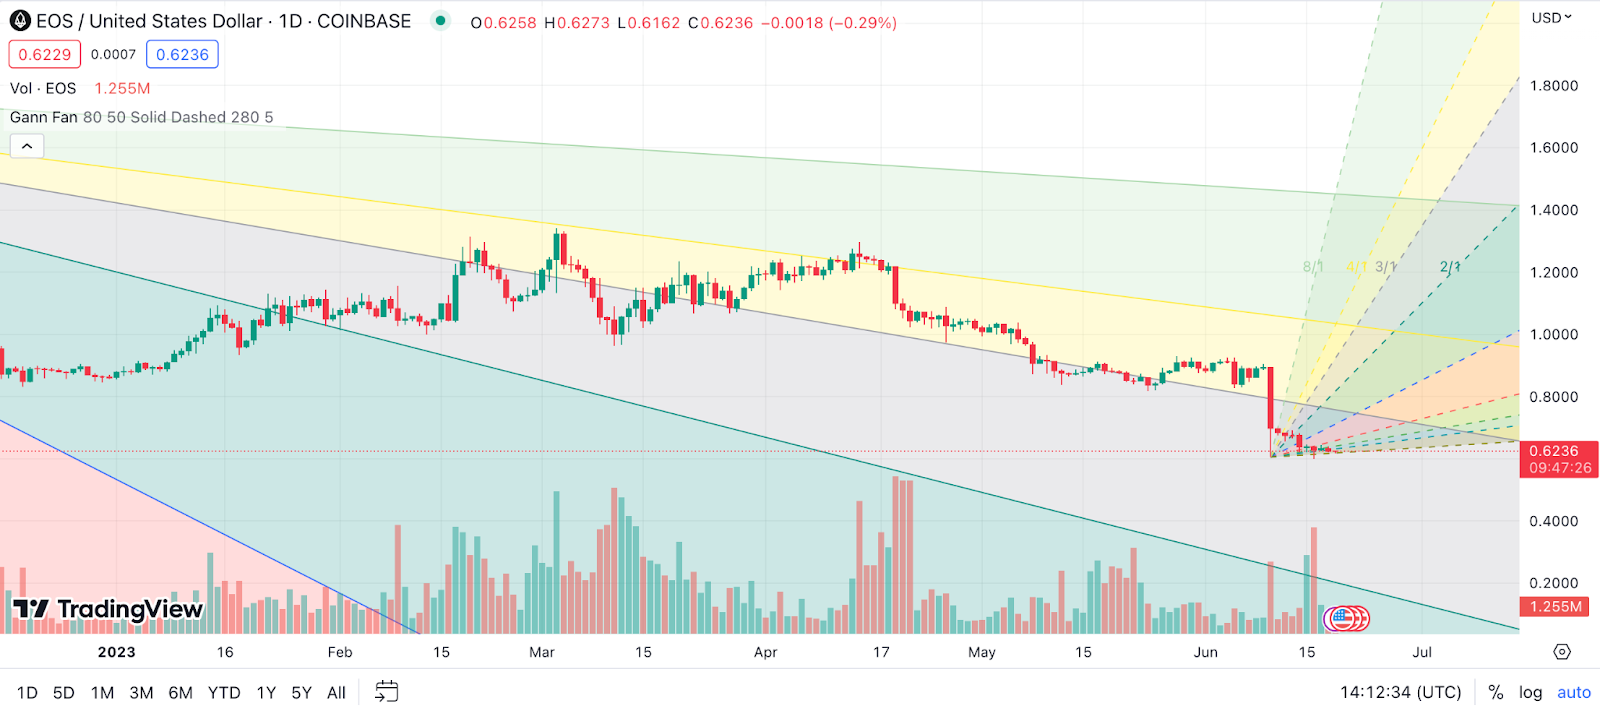
Example: If the EOS price falls below one of these lines, it could be a sign of a bearish trend, while rising above could indicate a bullish momentum. It’s important to remember that the Gann Fan is most reliable when used in conjunction with other indicators.
Keltner Channel for EOS Price Prediction
The Keltner Channel is a volatility-based indicator that depicts the price levels of EOS relative to bands of the upper, middle, and lower range. These channels can provide insight into potential reversals or breakout points.

Example: When the EOS price moves above the upper band, it may signify a strong upward trend, hinting at a possible increase in price. Conversely, if EOS price breaks below the lower band, it may indicate a strong downward trend, suggesting a potential decrease in price. The middle band often serves as a level of mean reversion, where price tends to return.
Money Flow Index (MFI) for EOS Price Prediction
The Money Flow Index (MFI) is often referred to as a volume-weighted Relative Strength Index (RSI). This oscillator moves between 0 and 100 and measures the speed and change of EOS price movements.

Example: When EOS’s MFI is above 80, the asset is considered overbought, and it’s a possible sign that there could be a price pullback. Conversely, an MFI value below 20 signifies an oversold condition, suggesting a potential price rebound. Keeping an eye on the MFI can help EOS traders anticipate reversals and take advantage of price fluctuations.
TRIX for EOS Price Prediction
TRIX is a momentum oscillator that displays the percent rate of change of a triple exponentially smoothed moving average of an asset’s closing price. Its primary function is to discern significant market trends, removing insignificant price fluctuations.
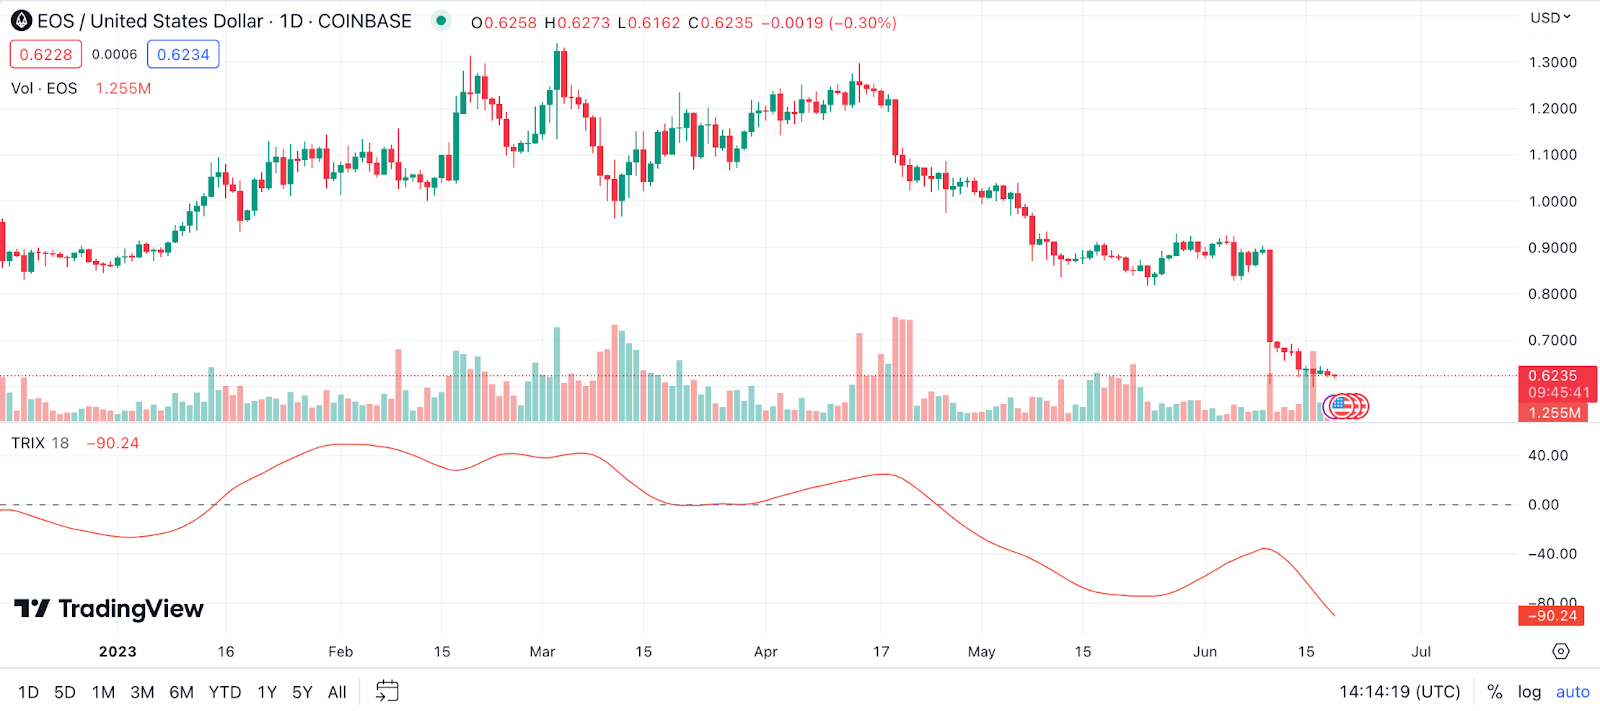
Example: If the TRIX line crosses above the signal line or zero, it could be a bullish sign and might suggest a good time to buy EOS. Conversely, if the TRIX line crosses below the signal line or zero, it could indicate a bearish market, suggesting a good time to sell. The divergence between EOS price and the TRIX can also give signals about market reversals.
The Zig Zag Indicator for EOS Price Prediction
The Zig Zag indicator is known for its ability to filter out insignificant rate movements, which can be particularly useful when analyzing EOS price trends. It is not predictive in nature but rather, it helps identify previous patterns, which can be key to anticipating future price changes.
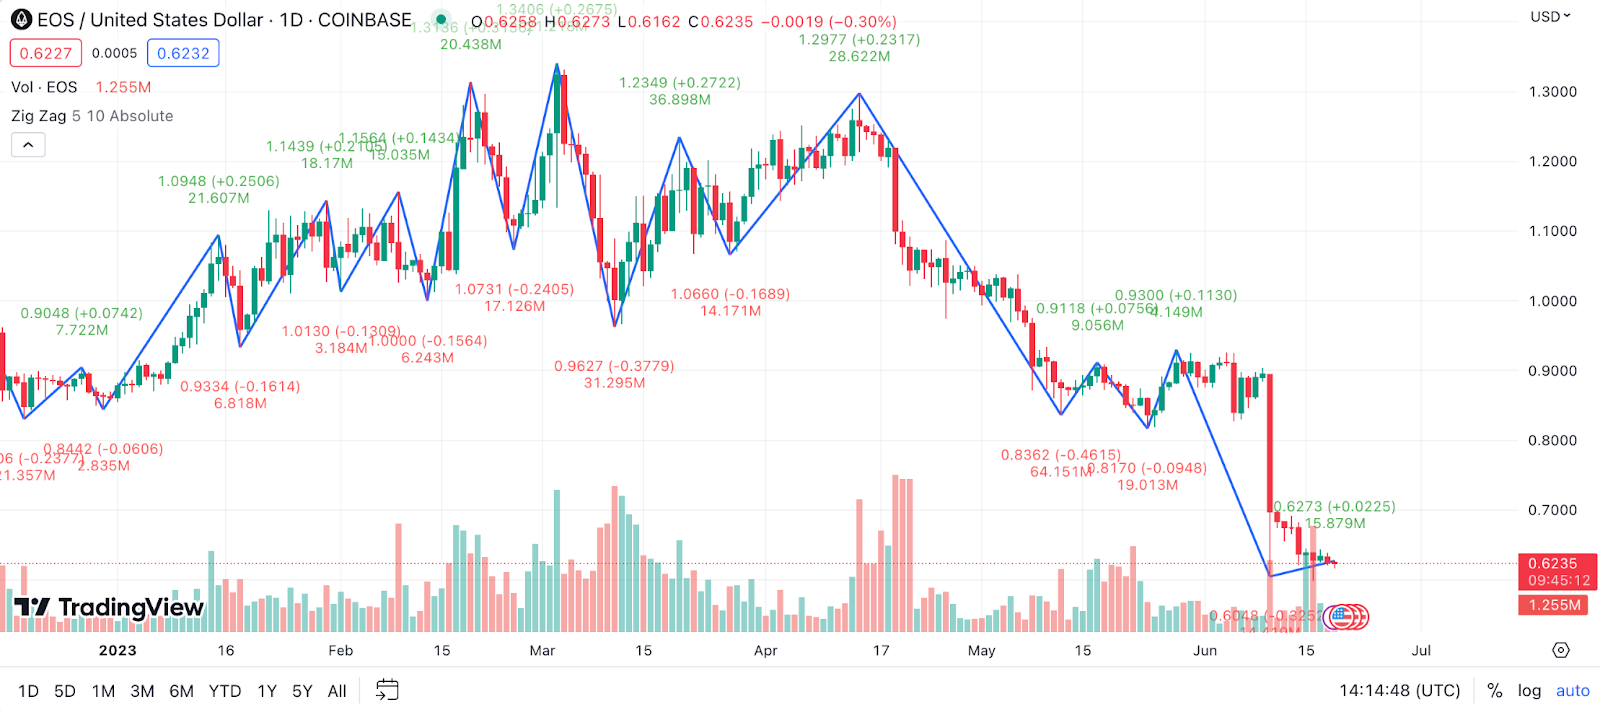
Example: If the price of EOS is exhibiting higher highs and higher lows in a Zig Zag pattern, this could indicate an upward trend. Conversely, lower highs and lower lows may indicate a downward trend. The Zig Zag indicator can be especially useful when used in combination with other indicators to confirm trends and reversal points.
Detrended Price Oscillator (DPO) for EOS Price Prediction
The Detrended Price Oscillator (DPO) is a tool designed to remove the trend from the price of an asset, in this case, EOS, allowing traders to focus on the underlying cycles of price movement. The DPO accomplishes this by comparing the current price of EOS to a prior price over a defined period.

Example: If the EOS price is above the DPO line, it might indicate that EOS is overbought and a price correction might be due. If the EOS price is below the DPO line, it might signify that EOS is oversold and could be due for a price increase.
Vortex Indicator (VI) for EOS Price Prediction
The Vortex Indicator (VI) is an oscillator used to identify the start of a new trend or confirm an ongoing trend, providing EOS traders with potential buy and sell signals. This indicator can be particularly beneficial for traders in the volatile crypto market, where accurately identifying trend changes can lead to substantial profits. The VI consists of two oscillating lines – VI+ and VI-.

Example: When the VI+ line crosses above the VI- line, it could signal a bullish trend, suggesting a potential buying EOS opportunity. Conversely, when the VI- line crosses above the VI+ line, it may be an indication of a bearish trend, suggesting it might be time to sell or short EOS.
Elder’s Force Index (EFI) for EOS Price Prediction
The Elder’s Force Index (EFI) is a technical indicator that aims to identify the force or strength of a move in the price of an asset, like EOS. It does so by combining price direction, magnitude, and volume.

Example: If EOS price makes a large upward move on high volume, the EFI will reflect a high positive value, signaling a strong bullish trend. Conversely, a big downward move on large volume will result in a strongly negative EFI, suggesting a robust bearish trend. It is common for traders to use this indicator along with other tools to confirm signals and prevent potential false positives.
Williams %R for EOS Price Prediction
The Williams %R is a momentum indicator that measures overbought and oversold levels, much like the RSI. It moves between 0 and -100, with readings above -20 indicating overbought conditions and readings below -80 signaling oversold conditions.
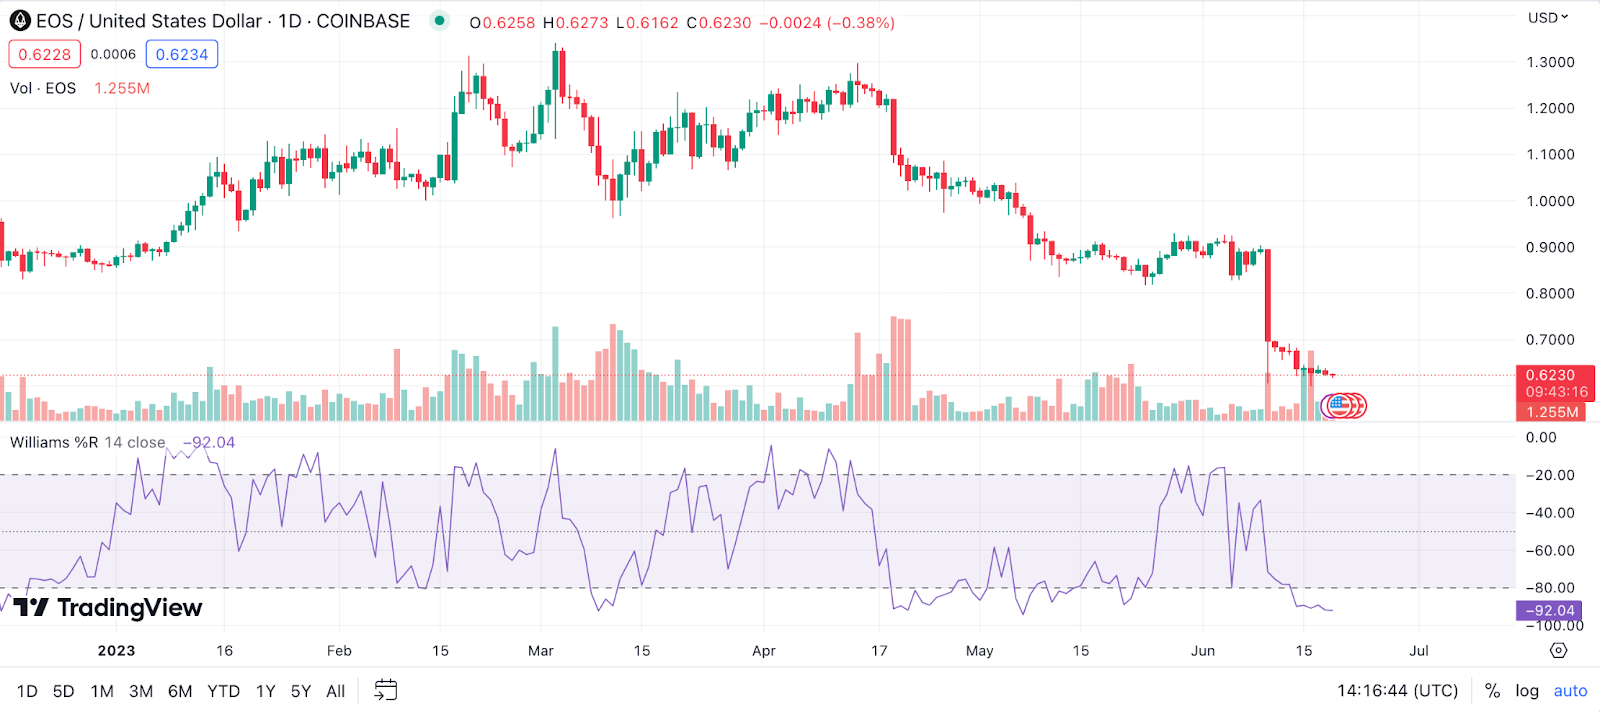
Example: If EOS price pushes the Williams %R above -20, traders might anticipate a potential price reversal and consider selling their EOS holdings. Conversely, if the indicator dips below -80, it might be a sign that EOS is oversold, and traders could look for buying opportunities. This indicator can help EOS traders determine optimal entry and exit points for their trades.
Combining Technical Indicators for Accurate EOS Price Prediction
A well-rounded and effective trading strategy requires more than a single lens of analysis. Just as a sailor navigates the ocean using both the stars and compass, we must employ multiple technical indicators to accurately predict the price of EOS.
The Importance of Using Multiple Technical Indicators for EOS Predictions
Technical analysis is like assembling a complex jigsaw puzzle. Each piece represents an indicator that, when used in isolation, provides limited information about the complete picture. However, when you begin to assemble these pieces together, patterns start to emerge, and a cohesive image forms. Utilizing multiple technical indicators for EOS price prediction can offer a more rounded perspective of the market and help filter out false signals.
For example, while an RSI might indicate that EOS is oversold, suggesting a good buying opportunity, it’s always wise to confirm this with another indicator like the MACD or Bollinger Bands. By cross-referencing, you are essentially adding layers of verification to your analysis, reducing the chances of making decisions based on false signals.
How to Combine Various Indicators for EOS Price Predictions
Now that we understand the why, let’s delve into the how. Here are some tips on combining various technical indicators for a comprehensive analysis of the price of EOS:
- Start with a broad overview: Begin with a broader perspective using trend indicators such as Moving Averages or the ADX to identify the general direction of the market.
- Use oscillators to find entry points: Once the trend is identified, oscillators like the RSI or Stochastic can help identify optimal entry or exit points.
- Use volume indicators to confirm the trend: Tools like On-Balance Volume (OBV) can confirm the strength of a trend by showing if volume is increasing or decreasing as the price changes.
- Avoid redundancy: While using multiple indicators is important, ensure they’re not all telling you the same thing. Combining the RSI with the Stochastic Oscillator, for instance, might not be useful as both are momentum oscillators.
- Use confirmation: Always seek confirmation from another indicator before making a trading decision. If the MACD signals a buy but the RSI is indicating overbought conditions, it might be best to wait for more signals.
Remember, no single indicator is foolproof. By employing a combination of technical indicators, you’ll be better equipped to navigate the tumultuous seas of cryptocurrency trading and make more informed decisions about your EOS investments.
The Pillars of EOS Price Prediction: Fundamental Factors
While technical analysis and indicators play a significant role in predicting the price of EOS, they are just one piece of the puzzle. To complete the picture and have a comprehensive understanding of the EOS market, we must also delve into fundamental factors. These elements offer insights into the intrinsic price of EOS and how external forces may influence its price.
Adoption Rate in Price Prediction
When evaluating the potential future price of EOS, the adoption rate is a critical factor to consider. A growing adoption rate often correlates with an increase in demand and can signal a positive price trajectory. The adoption rate can be gauged by analyzing several key metrics, including:
- Number of Transactions: A healthy transaction volume on the EOS network can indicate widespread usage and trust in the system. Consistent or growing transaction numbers can show that EOS is being used for its intended purpose, potentially leading to increased demand and price appreciation.
- Active Addresses: The number of unique addresses actively transacting on the network can provide insights into the breadth of EOS’s user base. A rise in active addresses may point to a larger community of users, which can subsequently create increased demand for EOS and propel its price upward.
- Partnerships and Integrations: Successful partnerships and integrations with other platforms or businesses can enhance EOS’s visibility and usage. These alliances can often expand the potential user base and further legitimize EOS as a valuable digital asset, potentially leading to price increases.
- Development Activity: A robust and active development community can indicate the future sustainability and improvement of the EOS platform. Frequent updates, improvements, and added features can attract more users and increase demand for EOS.
- Dapp Usage: EOS is a platform for Decentralized Applications (Dapps). The more popular and highly used the Dapps on EOS, the more demand there is for the EOS token. So looking at the activity and user numbers of Dapps can provide insights into EOS adoption.
- Community Engagement: A vibrant and engaged community often translates into a strong support system for EOS. Active discussion forums, social media engagement, and regular community events can contribute to increased visibility and wider adoption.
- Marketplace Acceptance: The extent to which EOS is accepted as a payment method by merchants, both online and offline, can be a direct indicator of its adoption rate. The broader the acceptance, the greater the adoption, which can stimulate demand and elevate prices.
Please note that while these indicators can provide valuable insights, they should be used as part of a broader analysis framework, incorporating both technical and other fundamental factors.
Regulatory Developments in Price Prediction
The cryptocurrency market, including EOS, is profoundly influenced by regulatory developments. While these can create short-term volatility, they also shape the long-term trajectory of crypto assets. Here are some regulatory aspects and their potential impact on EOS:
- Global Regulations: Regulations vary greatly by country. Some nations embrace cryptocurrencies like EOS, while others may restrict or even ban their use. Widespread acceptance or regulatory easing can lead to a surge in EOS price, while stringent regulations or bans can depress it.
- Legal Status: The legal classification of EOS in various jurisdictions can impact its price. If a country recognizes EOS as a legal form of payment or a legitimate asset class, it may boost EOS price today. Conversely, a lack of legal recognition may limit EOS’s adoption and negatively affect its price.
- Security Laws: The applicability of securities laws to EOS can influence its market dynamics. For example, if EOS is categorized as a security, it might limit who can buy it and potentially decrease demand, negatively affecting the price.
- Taxation Policies: How EOS is taxed can influence its attractiveness to investors. Favorable taxation policies can encourage more people to hold and transact in EOS, potentially pushing up the price. Conversely, heavy taxes may deter potential EOS investors, driving the price down.
- KYC/AML Rules: Know Your Customer (KYC) and Anti-Money Laundering (AML) requirements can influence EOS market accessibility. While these rules can limit some people’s ability to buy EOS, they also increase its legitimacy and potential adoption by institutional investors, possibly boosting the price.
- Future Regulatory Trends: Speculations about future regulatory changes can cause price swings. Rumors of an upcoming ban might depress prices, while anticipation of favorable legislation could cause a price spike. Traders often keep an eye on regulatory news to predict such movements.
- Regulation of Exchanges: The regulation of crypto exchanges where EOS is traded can affect its liquidity and price. Strict regulation may lead to delisting, reducing liquidity and potentially lowering prices. However, well-regulated exchanges can also increase investor confidence and potentially drive prices up.
Each of these factors can individually or collectively influence the price of EOS, emphasizing the need for any investor or trader to stay updated on regulatory developments. Next, let’s delve into the utility of EOS and how it can impact the asset’s price.
Utility in Price Prediction
EOS’s utility, or how it’s used in the real world, is another fundamental factor that can significantly affect its price. Here’s a quick breakdown of some core real-world uses of EOS crypto and how they can impact its price:
- Smart Contracts and Dapps: EOS is primarily used to create decentralized applications (dApps) and execute smart contracts. As such, the more developers use EOS for their applications, the higher the demand for EOS tokens, which could lead to a price increase.
- Scalability: EOS’s architecture allows for high scalability, which has earned it the nickname “Ethereum Killer”. The platform’s ability to handle a large number of transactions per second makes it appealing for various applications, potentially driving up demand and its price.
- Speed and Flexibility: EOS’s consensus algorithm, Delegated Proof of Stake (DPoS), enables quick and flexible block creation. This could make it more attractive to developers, leading to higher demand for EOS tokens and possibly a higher price.
- Resource Allocation: In the EOS ecosystem, holding EOS tokens equates to owning a proportional share of network resources (CPU, NET, and RAM). This incentivizes token holding, which could increase demand and drive up EOS’s price.
- Decentralized Autonomous Corporations (DACs): EOS crypto enables the creation of DACs, organizations that are run by smart contracts and community consensus. The growth of DACs on EOS could lead to increased token demand and a price increase.
- Token Leasing: EOS holders can lease their unused network capacity to others, providing a potential income stream and incentivizing token ownership. This could increase demand and potentially drive up EOS price.
- Inter-Blockchain Communication: EOS’s potential for facilitating communication between different blockchains could boost its utility and demand, possibly leading to a higher price.
Remember, the real-world utility of a cryptocurrency like EOS has a direct impact on its demand, and therefore its price prediction. A crypto token that is widely used and offers unique features will generally have a higher demand and price than one with limited use cases.
Market Sentiment: How EOS Price Predictions Work
Now, let’s shift our focus to market sentiment, an essential aspect of price prediction. Market sentiment refers to the overall attitude of investors towards a particular asset. In the context of EOS price prediction, the following factors and tools can help gauge market sentiment:
- News: Major news events, such as partnership announcements, technological updates, or regulatory changes, can drastically sway market sentiment. Positive news can result in bullish sentiment, while negative news can lead to bear market. Keeping an eye on EOS news can help you understand the market’s mood.
- Social Media Analysis: The sentiment within the online EOS community, especially on social media platforms like Twitter or Reddit, can be a useful indicator of market sentiment. Positive comments and increasing interest often suggest bullish sentiment.
- Fear and Greed Index: This index measures two of the primary emotions that influence how much investors are willing to buy cryptocurrencies like EOS. An increase in greed often indicates bullish sentiment, while increased fear signals bearish sentiment.
- Market and Price Trends: Trends in the whole cryptocurrency market can impact sentiment towards EOS crypto. If the overall market is on an uptrend, sentiment towards individual cryptos, including EOS, is likely to be positive, and vice versa.
- Technical Analysis: Though primarily used for long-term price prediction, technical indicators can also provide insight into market sentiment. For example, a sudden surge in trading volume might indicate a strong market sentiment.
- Investor Sentiment Surveys: Regularly conducted surveys about investor sentiment can give a sense of whether most investors feel bullish or bearish about EOS coins.
Understanding market sentiment is crucial as it can often drive rate movements, sometimes even counter to what technical and fundamental analysis may suggest. Keep in mind, while all the factors listed above can impact EOS price today, they should be used as part of a broader, more holistic price analysis strategy.
The Bottom Line: Making Your Own EOS Price Predictions
In wrapping up our exploration of EOS price prediction, it’s clear that it’s far more than a simple numbers game. We’ve journeyed through expert opinions, dissected the intricate layers of technical analysis, and uncovered the impact of fundamental factors. These varied insights, when considered collectively, allow us to piece together a comprehensive view of EOS’s potential trajectory.
Remember, while price predictions provide a sense of direction, they are not certainties. Keep your mind open, continue learning, and remember to align your crypto endeavors with your personal risk tolerance and investment goals. After all, in the dynamic world of cryptocurrency, knowledge is not just power, but also the compass guiding us through the fascinating yet unpredictable landscape of digital assets.
FAQ
When Will EOS Price Go Up?
Predicting the precise moment when EOS or any other cryptocurrency will rise in value is not an exact science. It’s a function of a myriad of factors including overall market dynamics, broader economic conditions, and specific events affecting EOS such as development updates or strategic partnerships. The adoption rate of the EOS platform for building decentralized applications can also play a significant role. Given the robust technology behind EOS, its scalability, and the growing global interest in blockchain solutions, it’s plausible to anticipate potential upward trends. However, the inherent volatility of cryptocurrencies means that price fluctuations can be both rapid and significant.
Should I Buy EOS?
The decision to buy EOS, like any other investment decision, should be based on thorough research and a clear understanding of your financial circumstances and risk tolerance. EOS has a number of compelling features that could make it an attractive investment. These include its scalability, its usability for developers, and its supportive community. However, it’s essential to bear in mind that the value of EOS, like all cryptocurrencies, can fluctuate widely. Investments in cryptocurrencies should be seen as high-risk and long-term. Always remember to diversify your investments and consider seeking investment advice from a financial advisor.
How High Can EOS Price Go?
The potential peak price of EOS, or indeed any cryptocurrency, is challenging to predict due to the vast array of influencing factors. These range from the rate of technological advancements within the EOS platform itself, to broader market trends, to regulatory developments, and to changes in the global economic landscape. That said, the ongoing and increasing adoption of blockchain technology in various sectors, coupled with the distinctive features of EOS, suggest a promising future. While the sky might theoretically be the limit, any investment should be approached with a healthy degree of caution and skepticism.
Will EOS Price Crash Again in 2024?
Predicting a crash for EOS, or any cryptocurrency, is as complex as predicting peak prices. It’s subject to an array of factors, from rapid shifts in market sentiment, to regulatory changes, to broader macroeconomic factors. While the EOS platform has strong technological fundamentals, it’s not immune to the broader risks inherent in the crypto market, which can be extremely volatile. Keeping an eye on the latest developments and trends in the blockchain and crypto space can provide valuable insights into possible future price movements. It’s always crucial to stay informed and make good investment decisions based on the most up-to-date, comprehensive, and reliable information.