Hello everyone, welcome to our latest deep-dive into the fascinating world of digital currencies. The spotlight today is on Stellar Price Prediction. I know, I know — predicting cryptocurrency prices can feel akin to riding a rollercoaster blindfolded. That’s why we’re going to guide you gently through the often perplexing realm of Stellar’s past and future, armed with the insights of its origin, purpose, and the numerous analytical tools traders employ to forecast the Stellar XLM’s price trajectory.
I can almost hear the question bubbling in your minds, ‘Why should we care about predicting the value of XLM coin?’ Well, it’s pretty simple. Keeping an eye on the potential future value of XLM is key to making informed investment decisions in this volatile market. Knowing how to read the market’s signs and understanding Stellar’s potential can be your ticket to making the most of your cryptocurrency investments.
It’s not just about the numbers either. Uncovering experts’ opinions and weighing them alongside other data points add an extra layer of assurance — or caution — in your forecasting efforts. In the ever-evolving world of digital currencies, an informed investor is a successful investor.
So, are you ready to delve deeper into Stellar’s future and boost your knowledge on Stellar (XLM) price prediction? Then let’s get started! By the end of this article, you’ll have a much better grasp on Stellar’s potential and how it can impact your cryptocurrency strategies. Come along, let’s uncover the mysteries of Stellar together.
Stellar (XLM) Overview
| XLM Price | $0.4790 |
| XLM Price Change 24h | 0.41% |
| XLM Price Change 7d | 54.79% |
| XLM Market Cap | $14,892,670,284.71 |
| XLM Circulating Supply | 31,093,541,246.85 |
| XLM Trading Volume | $2,239,717,171.51 |
| XLM All-Time High (ATH) | $0.9381 |
| XLM All-Time Low (ATL) | $0.001227 |
A Brief History: Stellar and Its Purpose
To truly appreciate the Stellar (XLM) price prediction, we’ve got to take a detour into the past. Buckle up, because we’re about to travel back to the genesis of Stellar blockchain network and its purpose. Stellar, launched in 2014 by Jed McCaleb and Joyce Kim, is an open-source, decentralized protocol for digital currency to fiat money transfers. Stellar consensus protocol allows cross-border transactions between any pair of currencies. Yeah, it’s a pretty big deal.
The core idea behind Stellar blockchain was to provide a network that could bridge the gap between disparate financial systems. Pretty cool, right? It was created with the aim of making monetary transactions more efficient, inclusive, and less costly. Think of it as a digital highway, paving the way for quicker and more affordable money transfers across international borders.
Let’s switch gears now, and take a peek at the rollercoaster ride that is Stellar’s price history. Stellar’s value has seen its fair share of peaks and valleys, adding a pinch of spice to our Stellar price prediction discussion. Here are some notable price gyrations:
- Stellar’s launch year, 2014, saw the cryptocurrency priced at less than a penny.
- In 2017, riding the crypto wave, Stellar (XLM) coin hit an impressive high of $0.938.
- 2018 brought a bear market for cryptocurrencies, and Stellar was no exception, falling to $0.091.
- In 2021, Stellar started the year strong, hitting a price of $0.41 in February.
- By the end of 2021, despite the crypto market’s volatility, Stellar (XLM) managed to maintain a respectable value above $0.25.
Witnessing the price fluctuations of Stellar paints a vibrant picture of its price history. As we dig deeper into our Stellar price prediction, this information will prove invaluable. Just remember, as we journey through this crypto landscape, the past is prologue. It shapes our understanding, but the future, dear friends, is a realm of infinite possibilities. And who doesn’t love a good mystery?
Stellar – XLM Price Prediction For Today, Tomorrow, This Week, and Next 30 Days
| Date | Price | Change |
|---|---|---|
| July 19, 2025 | 0.48 | -0.81% |
| July 20, 2025 | 0.47 | -0.95% |
| July 21, 2025 | 0.47 | 0.49% |
| July 22, 2025 | 0.48 | 0.93% |
| July 23, 2025 | 0.48 | 0.50% |
| July 24, 2025 | 0.48 | -1.00% |
| July 25, 2025 | 0.48 | 0.31% |
| July 26, 2025 | 0.48 | 0.48% |
| July 27, 2025 | 0.48 | 0.72% |
| July 28, 2025 | 0.48 | 0.13% |
| July 29, 2025 | 0.49 | 0.34% |
| July 30, 2025 | 0.48 | -0.70% |
| July 31, 2025 | 0.48 | -0.80% |
| August 01, 2025 | 0.47 | -0.66% |
| August 02, 2025 | 0.47 | -0.30% |
| August 03, 2025 | 0.47 | 0.10% |
| August 04, 2025 | 0.47 | -0.62% |
| August 05, 2025 | 0.47 | -0.89% |
| August 06, 2025 | 0.47 | -0.14% |
| August 07, 2025 | 0.46 | -0.94% |
| August 08, 2025 | 0.47 | 0.82% |
| August 09, 2025 | 0.46 | -0.46% |
| August 10, 2025 | 0.46 | -0.56% |
| August 11, 2025 | 0.46 | -0.19% |
| August 12, 2025 | 0.46 | -0.82% |
| August 13, 2025 | 0.46 | -0.16% |
| August 14, 2025 | 0.46 | 0.45% |
| August 15, 2025 | 0.46 | 0.62% |
| August 16, 2025 | 0.46 | -0.30% |
| August 17, 2025 | 0.46 | 0.78% |
Stellar Price Prediction 2024
After analyzing Stellar’s future price data for 2024, we found that the projected minimum price is $0.4311, while the average and maximum prices are $0.5029 and $0.5748, respectively.
Our assessment of future returns based on this data suggests that Stellar’s outlook for 2024 is relatively stable, with moderate growth expected.
The narrow price range implies that the Stellar (XLM) market may not anticipate significant fluctuations in value, but there is still potential for substantial returns for those willing to take on high risks associated with investing in Stellar.
Nonetheless, cryptocurrency investors must be cautious and carry out thorough research before making any investment decisions in this space due to the historical volatility of cryptocurrencies and the continuously evolving market landscape.
| Month | Minimum Price | Average Price | Maximum Price |
|---|---|---|---|
| February 2024 | 0.1242 | 0.1290 | 0.1343 |
| March 2024 | 0.1276 | 0.1325 | 0.1379 |
| April 2024 | 0.1310 | 0.1361 | 0.1416 |
| May 2024 | 0.1346 | 0.1397 | 0.1455 |
| June 2024 | 0.1382 | 0.1435 | 0.1494 |
| July 2024 | 0.1419 | 0.1474 | 0.1534 |
| August 2024 | 0.1458 | 0.1514 | 0.1576 |
| September 2024 | 0.1497 | 0.1554 | 0.1618 |
| October 2024 | 0.1537 | 0.1596 | 0.1662 |
| November 2024 | 0.1579 | 0.1639 | 0.1707 |
| December 2024 | 0.1621 | 0.1684 | 0.1753 |
| January 2025 | 0.1665 | 0.1729 | 0.1800 |
January 2024: Stellar Price Forecast
The beginning of the year 2024 holds promise for Stellar enthusiasts. Observing the broader market trends and intrinsic technological advancements, Stellar could see its minimum price stabilize at $0.1129. The average trading price is predicted to hover around $0.1256, offering a stable ground for traders to act upon. Those looking for peaks will be eying the maximum price threshold of $0.1311, which might be hit amidst bullish market sentiments.
XLM Price Forecast for February 2024
Entering February, the market’s momentum appears to be gently pushing Stellar’s valuation upward. The minimum price is expected to edge up to $0.1242, reflecting a steady investor interest. The average price is seen to ascend slightly to $0.1290, hinting at a growing confidence among traders. Meanwhile, the maximum price might reach a more optimistic $0.1343, possibly due to speculative trading amidst positive news in the crypto space.
March 2024: Stellar Price Forecast
As we progress into March, Stellar’s price trajectory is predicted to continue its gradual ascent. The data points to a minimum price of $0.1276, suggesting a solid floor as investor sentiment remains positive. The average price is projected to increase to $0.1325, indicating a stable yet cautious investment climate. For the bulls, the maximum price could surge to $0.1379, potentially driven by strategic partnerships or technological breakthroughs within the Stellar network.
XLM Price Forecast for April 2024
April’s forecast for Stellar shows a consistent upward trend in its pricing. Crypto analysts have observed that the minimum price is likely to reach $0.1310, marking a small yet significant increase that reflects a bullish undertone in the market. The average price might see an uptick to $0.1361 as the market begins to respond to Stellar’s platform developments. The maximum price is anticipated to climb to $0.1416, possibly due to increased adoption and favorable regulatory news.
May 2024: Stellar Price Forecast
As we move into the vibrant month of May, Stellar’s financial health looks to be in full bloom. The asset’s minimum price is expected to blossom to $0.1346, indicative of a robust support level. Averaging out at $0.1397, the price reflects an active market with a balanced buy-and-sell dynamics. The maximum price might reach a verdant $0.1455, likely propelled by optimistic market drivers and enhanced investor interest.
XLM Price Forecast for June 2024
The sunny outlook for June sees Stellar’s price maintaining its upward trajectory. The minimum price is anticipated to warm up to $0.1382, showing a strengthening base of investor trust. Averaging a price of $0.1435 suggests that the crypto market could be embracing a period of stability and growth. With a maximum price potentially reaching $0.1494, it’s expected that strategic investor moves could create peaks in the trading charts.
July 2024: Stellar Price Forecast
Crypto experts, analyzing the mid-year trends, predict July to be a month of continued growth for Stellar. The minimum price is forecasted to rise to $0.1419, indicating a firm foundation. The average price is seen to ascend to $0.1474, mirroring a solid interest in Stellar as a long-term investment. The maximum price, possibly peaking at $0.1534, might reflect an influx of speculative interest following a trail of positive developments.
XLM Price Forecast for August 2024
As the summer heat intensifies, so does the forecasted value of Stellar. Analysts foresee the minimum price inflating slightly to $0.1458, indicative of the market’s resilience. An average price of $0.1514 is projected, suggesting a steady stream of investment. The maximum price, potentially reaching $0.1576, could be fueled by seasonal trading patterns and increased utility of the Stellar network.
September 2024: Stellar Price Forecast
With autumn approaching, Stellar is expected to show a stable increase. The minimum price is forecasted to reach $0.1497, signaling a strong investor base. The average price is likely to level out at $0.1554, as the market digests the outcomes of the third quarter. A maximum price of $0.1618 might be on the horizon, possibly due to heightened trading activity and optimistic market forecasts.
XLM Price Forecast for October 2024
October could see Stellar’s pricing strategy bear fruit. The minimum price is predicted to climb to $0.1537, showcasing a robust market presence. The average price is estimated to be $0.1596, possibly reflecting a matured investor sentiment. The maximum price could potentially spike to $0.1662, driven by anticipatory trades ahead of year-end summaries and forecasts.
November 2024: Stellar Price Forecast
As we nestle into November, Stellar’s price predictions suggest a snug uptrend. A minimum price of $0.1579 hints at a cozy investor confidence as the end of the year nears. An average price of $0.1639 indicates a healthy trading environment, warmed by the glow of steady market participation. The maximum price could reach a toasty $0.1707, perhaps stoked by a flurry of year-end investment maneuvers.
XLM Price Forecast for December 2024
Rounding off the year, December’s forecast for Stellar is festively positive. With the minimum price expected to deck to $0.1621, it seems the market floor is set for celebrations. The average price might jingle all the way to $0.1684, suggesting a spirited trade volume. The maximum price, potentially reaching a merry $0.1753, could be the gift of bullish trends and end-of-year portfolio adjustments.
Stellar (XLM) Price Prediction 2025
Fast forward to 2025, and the prospects look even more intriguing. We predict a base price for Stellar sitting at $0.16. Yet, the average price we anticipate is a notch higher, circling around $0.19. Don’t be surprised if the stars align and we witness a maximum price soar up to $0.22.
| Month | Minimum Price | Average Price | Maximum Price |
|---|---|---|---|
| February 2025 | 0.1582 | 0.1643 | 0.1711 |
| March 2025 | 0.1625 | 0.1688 | 0.1757 |
| April 2025 | 0.1669 | 0.1733 | 0.1804 |
| May 2025 | 0.1714 | 0.1780 | 0.1853 |
| June 2025 | 0.1760 | 0.1828 | 0.1903 |
| July 2025 | 0.1808 | 0.1877 | 0.1954 |
| August 2025 | 0.1857 | 0.1928 | 0.2007 |
| September 2025 | 0.1907 | 0.1980 | 0.2061 |
| October 2025 | 0.1958 | 0.2034 | 0.2117 |
| November 2025 | 0.2011 | 0.2088 | 0.2174 |
| December 2025 | 0.2065 | 0.2145 | 0.2233 |
| January 2026 | 0.2121 | 0.2203 | 0.2293 |
Stellar Price Prediction 2026
As we peer into 2026, our team of analysts suggests a similar trend. The minimum price of Stellar might hover around $0.21, while the average price could nestle up to $0.25. But hold your breath, because the maximum price could reach a staggering $0.29.
| Month | Minimum Price | Average Price | Maximum Price |
|---|---|---|---|
| February 2026 | 0.2077 | 0.2157 | 0.2245 |
| March 2026 | 0.2133 | 0.2215 | 0.2306 |
| April 2026 | 0.2191 | 0.2275 | 0.2368 |
| May 2026 | 0.2250 | 0.2336 | 0.2432 |
| June 2026 | 0.2310 | 0.2399 | 0.2498 |
| July 2026 | 0.2373 | 0.2464 | 0.2565 |
| August 2026 | 0.2437 | 0.2531 | 0.2634 |
| September 2026 | 0.2503 | 0.2599 | 0.2705 |
| October 2026 | 0.2570 | 0.2669 | 0.2778 |
| November 2026 | 0.2640 | 0.2741 | 0.2853 |
| December 2026 | 0.2711 | 0.2815 | 0.2931 |
| January 2027 | 0.2784 | 0.2891 | 0.3010 |
Stellar (XLM) Price Prediction 2027
Cracking the crypto code, our forecast for 2027 points towards a minimum Stellar price of $0.28. The average price could inch up to a respectable $0.33. In an optimistic scenario, we might even witness a maximum price touching $0.39.
| Month | Minimum Price | Average Price | Maximum Price |
|---|---|---|---|
| February 2027 | 0.2769 | 0.2876 | 0.2993 |
| March 2027 | 0.2844 | 0.2953 | 0.3074 |
| April 2027 | 0.2921 | 0.3033 | 0.3157 |
| May 2027 | 0.3000 | 0.3115 | 0.3243 |
| June 2027 | 0.3081 | 0.3199 | 0.3330 |
| July 2027 | 0.3164 | 0.3285 | 0.3420 |
| August 2027 | 0.3249 | 0.3374 | 0.3512 |
| September 2027 | 0.3337 | 0.3465 | 0.3607 |
| October 2027 | 0.3427 | 0.3559 | 0.3705 |
| November 2027 | 0.3520 | 0.3655 | 0.3805 |
| December 2027 | 0.3615 | 0.3753 | 0.3907 |
| January 2028 | 0.3712 | 0.3855 | 0.4013 |
Stellar Price Prediction 2028
Delving deeper into our crystal ball, we see Stellar’s minimum price in 2028 staying steady at $0.37. The average price could well be around $0.43, and in a bullish market, the maximum price might climb up to $0.52.
| Month | Minimum Price | Average Price | Maximum Price |
|---|---|---|---|
| February 2028 | 0.3659 | 0.3800 | 0.3956 |
| March 2028 | 0.3758 | 0.3902 | 0.4062 |
| April 2028 | 0.3860 | 0.4008 | 0.4172 |
| May 2028 | 0.3964 | 0.4116 | 0.4285 |
| June 2028 | 0.4071 | 0.4227 | 0.4401 |
| July 2028 | 0.4181 | 0.4341 | 0.4519 |
| August 2028 | 0.4294 | 0.4459 | 0.4641 |
| September 2028 | 0.4410 | 0.4579 | 0.4767 |
| October 2028 | 0.4529 | 0.4703 | 0.4895 |
| November 2028 | 0.4651 | 0.4830 | 0.5028 |
| December 2028 | 0.4776 | 0.4960 | 0.5163 |
| January 2029 | 0.4905 | 0.5094 | 0.5303 |
Stellar (XLM) Price Prediction 2029
Turning the page to 2029, we forecast Stellar’s minimum price to remain stable at $0.48. The average price might linger around $0.57, but there’s a potential for the maximum price to ascend to $0.68.
| Month | Minimum Price | Average Price | Maximum Price |
|---|---|---|---|
| February 2029 | 0.4846 | 0.5032 | 0.5239 |
| March 2029 | 0.4977 | 0.5168 | 0.5380 |
| April 2029 | 0.5111 | 0.5308 | 0.5525 |
| May 2029 | 0.5249 | 0.5451 | 0.5675 |
| June 2029 | 0.5391 | 0.5598 | 0.5828 |
| July 2029 | 0.5537 | 0.5749 | 0.5985 |
| August 2029 | 0.5686 | 0.5905 | 0.6147 |
| September 2029 | 0.5840 | 0.6064 | 0.6313 |
| October 2029 | 0.5997 | 0.6228 | 0.6483 |
| November 2029 | 0.6159 | 0.6396 | 0.6658 |
| December 2029 | 0.6326 | 0.6569 | 0.6838 |
| January 2030 | 0.6496 | 0.6746 | 0.7023 |
Stellar Price Prediction 2030
Moving into the next decade, we envisage a Stellar minimum price of $0.64 for 2030. The average price could center around $0.76, and with the right momentum, the maximum trading price could skyrocket to $0.91.
| Month | Minimum Price | Average Price | Maximum Price |
|---|---|---|---|
| February 2030 | 0.6429 | 0.6676 | 0.6949 |
| March 2030 | 0.6602 | 0.6856 | 0.7137 |
| April 2030 | 0.6780 | 0.7041 | 0.7330 |
| May 2030 | 0.6963 | 0.7231 | 0.7527 |
| June 2030 | 0.7151 | 0.7426 | 0.7731 |
| July 2030 | 0.7345 | 0.7627 | 0.7939 |
| August 2030 | 0.7543 | 0.7833 | 0.8154 |
| September 2030 | 0.7746 | 0.8044 | 0.8374 |
| October 2030 | 0.7956 | 0.8261 | 0.8600 |
| November 2030 | 0.8170 | 0.8484 | 0.8832 |
| December 2030 | 0.8391 | 0.8713 | 0.9071 |
| January 2031 | 0.8618 | 0.8949 | 0.9316 |
Stellar (XLM) Price Prediction 2031
As 2031 unfolds, our expert analysis estimates Stellar’s minimum price will remain consistent at $0.85. We expect the average price to be around $1.01, while the maximum trading price could reach the stratospheric heights of $1.2.
| Month | Minimum Price | Average Price | Maximum Price |
|---|---|---|---|
| February 2031 | 0.8505 | 0.8832 | 0.9194 |
| March 2031 | 0.8735 | 0.9071 | 0.9443 |
| April 2031 | 0.8971 | 0.9316 | 0.9698 |
| May 2031 | 0.9213 | 0.9567 | 0.9959 |
| June 2031 | 0.9462 | 0.9825 | 1.0228 |
| July 2031 | 0.9717 | 1.0091 | 1.0504 |
| August 2031 | 0.9980 | 1.0363 | 1.0788 |
| September 2031 | 1.0249 | 1.0643 | 1.1079 |
| October 2031 | 1.0526 | 1.0930 | 1.1378 |
| November 2031 | 1.0810 | 1.1225 | 1.1686 |
| December 2031 | 1.1102 | 1.1529 | 1.2001 |
| January 2032 | 1.1402 | 1.1840 | 1.2325 |
Stellar Price Prediction 2032
Finally, as we gaze into 2032, our predictions suggest a minimum Stellar price of $1.13. The average price might balance around $1.34, and if the market tides turn favorably, we could see a maximum trading price of $1.59.
| Month | Minimum Price | Average Price | Maximum Price |
|---|---|---|---|
| February 2032 | 1.1275 | 1.1708 | 1.2188 |
| March 2032 | 1.1579 | 1.2024 | 1.2517 |
| April 2032 | 1.1892 | 1.2349 | 1.2855 |
| May 2032 | 1.2213 | 1.2682 | 1.3202 |
| June 2032 | 1.2542 | 1.3024 | 1.3558 |
| July 2032 | 1.2881 | 1.3376 | 1.3924 |
| August 2032 | 1.3229 | 1.3737 | 1.4300 |
| September 2032 | 1.3586 | 1.4108 | 1.4687 |
| October 2032 | 1.3953 | 1.4489 | 1.5083 |
| November 2032 | 1.4330 | 1.4880 | 1.5490 |
| December 2032 | 1.4717 | 1.5282 | 1.5909 |
| January 2033 | 1.5114 | 1.5695 | 1.6338 |
The Main Questions Of Critical Thinking When We Talk About Stellar Forecast
Below are three critical thinking questions to deepen your own research and understanding of the current price of Stellar and the other factors influencing it:
- What factors make the most impact on Stellar’s price according to various experts?
- How do opinions differ among experts regarding Stellar’s future price, and what reasons are given for these differences?
- Given the opinions on Stellar’s future price, how could potential investors make informed decisions?
Reflecting on these critical thinking questions can help you develop a deeper understanding of the complexities surrounding the future price of Stellar and the importance of considering various perspectives and factors in making informed good investment decisions.
Stellar (XLM) Price Predictions by Experts
When it comes to Stellar price forecasts, it’s always fascinating to hear the perspectives of well-known financial experts and crypto experts too.
- Jed McCaleb, Stellar’s co-founder: ‘Stellar Lumens is an open network for storing and moving money. Our vision is to enable the world’s low-cost financial infrastructure.’

Jed McCaleb
- WalletInvestor: WalletInvestor’s computational models forecast a quick increase in the Stellar cost. The peak price is projected to touch $0.65 by the close of 2024. Throughout 2024, the Stellar XLM’s valuation is expected to vary between $0.3 and $0.6.
- Government Capital: Government Capital’s analysis suggests a gradual growth in the XLM coin’s price over the subsequent years, with it possibly attaining the $0.5 mark in 2024. The analysts at Government Capital (Gov Capital) believe that Stellar Lumens could turn out to be a sound investment.
- TradingBeasts: According to TradingBeasts’ most prudent prediction, the XLM price might see a rise of about 110% over the coming three years, hitting $0.67 by the culmination of 2024 and potentially reaching $1.3 by 2024’s end. The experts at TradingBeasts maintain a positive outlook on Stellar XLM’s growth potential, and they don’t foresee any impending crash for this cryptocurrency.
Decoding the Charts: XLM Technical Price Analysis
In the vast ocean of financial markets, learning to interpret the tide of cryptocurrency prices can feel daunting. The charts and graphs may seem like cryptic codes meant for Wall Street wizards. But fret not, dear reader. Today, we’re going to unravel the mysteries of technical price analysis, focusing on Stellar’s cryptocurrency, XLM. Let’s dive in.
Before we take the plunge, let’s first familiarize ourselves with some of the key concepts and tools used in technical analysis. A few of these include trend lines, support and resistance levels, moving averages, and momentum indicators. Each of these tools allows us to see a different aspect of a coin’s price behavior, making the complicated world of crypto trading just a bit simpler.
Technical Indicators for Stellar Forecast: Origin and Purpose
Technical indicators, in the most fundamental sense, are mathematical calculations based on the price, volume, or open interest of a security or contract. They originated in the early 20th century with the pioneering work of Charles Dow, and they’ve come a long way since then. From simple line charts and bar graphs to sophisticated candlestick patterns and Fibonacci retracements, technical indicators have evolved to meet the demands of an increasingly complex market.
The Role of Technical Indicators for Stellar Lumens Price Prediction
So, why do these seemingly complex constructs matter so much in financial markets? Well, the answer is simple: They give us insight. They help traders and investors understand the market’s past behavior and, crucially, they provide clues about future performance. Like a hiker using a compass, traders use these indicators to navigate the sometimes treacherous terrain of the financial markets.
How Technical Indicators Can Be Used in Stellar Price Predictions
As for Stellar (XLM), these technical indicators play an equally crucial role. Stellar Lumens, like any other cryptocurrency, experiences price fluctuations. Sometimes, these price swings can be quite dramatic. By employing technical indicators, we can attempt to understand these price movements better and, hopefully, make more educated predictions about where Stellar’s price might be heading next.
One might wonder, ‘How accurate are these indicators?’ Well, while they’re not crystal balls, they do provide valuable information. By analyzing historical data, traders can identify patterns and trends in Stellar’s price, which can then be used to forecast future price movements.
I know how important it is to have a solid understanding of the most common technical indicators used for both crypto prices and predicting Stellar XLM worth. Thus, in this section, I’ll share with you the essential indicators that I’ve found particularly helpful in my own trade journey, and I’ll provide real-life examples of how to apply them to Stellar prediction.
Moving Averages (MAs) for Stellar Lumens Price Prediction
Moving Averages are vital tools in technical analysis, smoothing out price data by creating a constantly updated average price. They are typically divided into two main types: Simple Moving Average (SMA) and Exponential Moving Average (EMA). The former calculates the average of a selected range of prices, typically closing prices, over a specified period. The latter, however, gives more weight to recent prices.
Example: In the context of Stellar (XLM) price prediction, if we observe that the price crosses above its 50-day SMA, it may be interpreted as a bullish signal. On the other hand, a price dip below the 50-day SMA could suggest a bearish market sentiment.
Relative Strength Index (RSI) – Stellar (XLM) Price Prediction
The RSI is a momentum oscillator that measures the speed and change of price movements, oscillating between zero and 100. It is typically used to identify overbought or oversold conditions in a market.
Example: For Stellar Lumens, an RSI value above 70 would imply that it might be overbought – indicating a potential price pullback. Conversely, an RSI below 30 suggests an oversold market condition and possibly a price rally in the near future. It’s worth noting, however, that these thresholds are not set in stone and can vary depending on market conditions.
Moving Average Convergence Divergence (MACD) – Stellar (XLM) Prediction
MACD is a trend-following momentum indicator that shows the relationship between two moving averages of an asset’s price. The MACD is calculated by subtracting the 26-day EMA from the 12-day EMA. A nine-day EMA of the MACD, called the ‘signal line,’ is then plotted on top of the MACD line.
Example: When it comes to Stellar Lumens, a bullish signal is generated when the MACD line crosses above the signal line, and conversely, a bearish signal when it crosses below.
Bollinger Bands for Stellar Price Prediction
Bollinger Bands comprise a simple moving average (middle band) with an upper and lower band along each side. These bands move with the price, widening or contracting based on volatility.
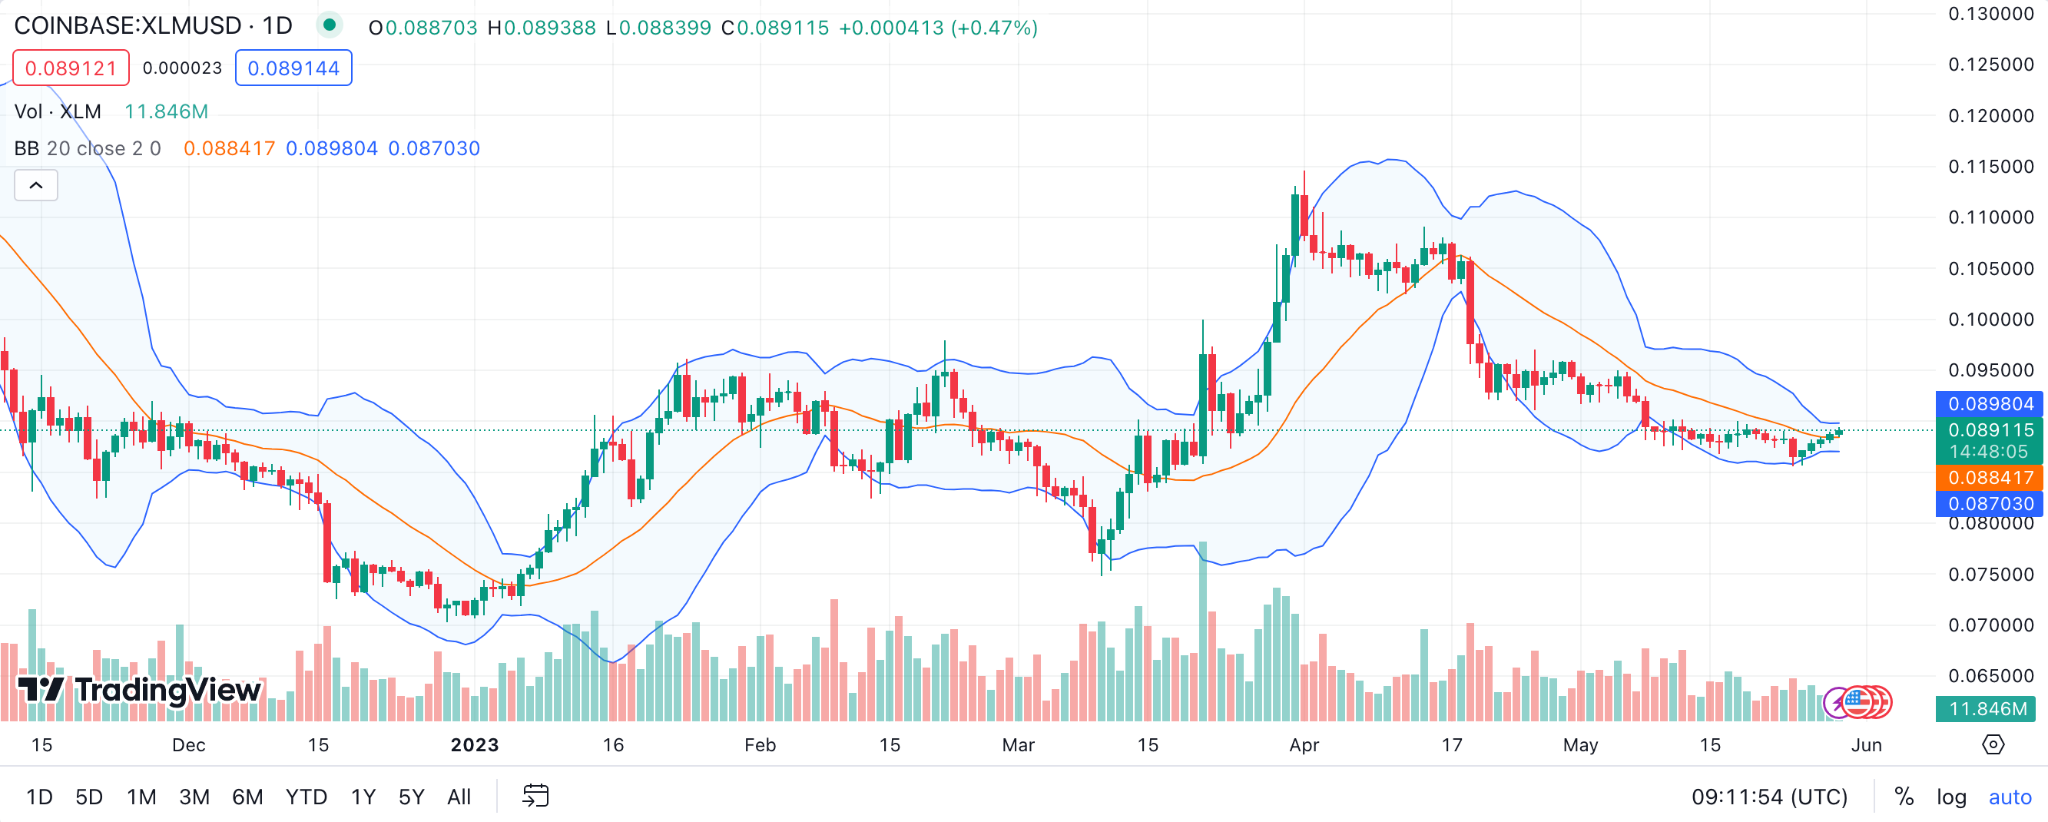
Example: For Stellar Lumens (XLM), if the price is approaching the upper band, it may be considered overbought. Conversely, if it’s near the lower band, it might be seen as oversold. However, these bands do not provide absolute buy and sell signals on their own and should be used in conjunction with other indicators.
Stochastic Oscillator for Stellar (XLM) Price Prediction
The Stochastic Oscillator is a momentum indicator that shows the location of the close relative to the high-low range over a set number of periods. It follows the speed or momentum of the price.
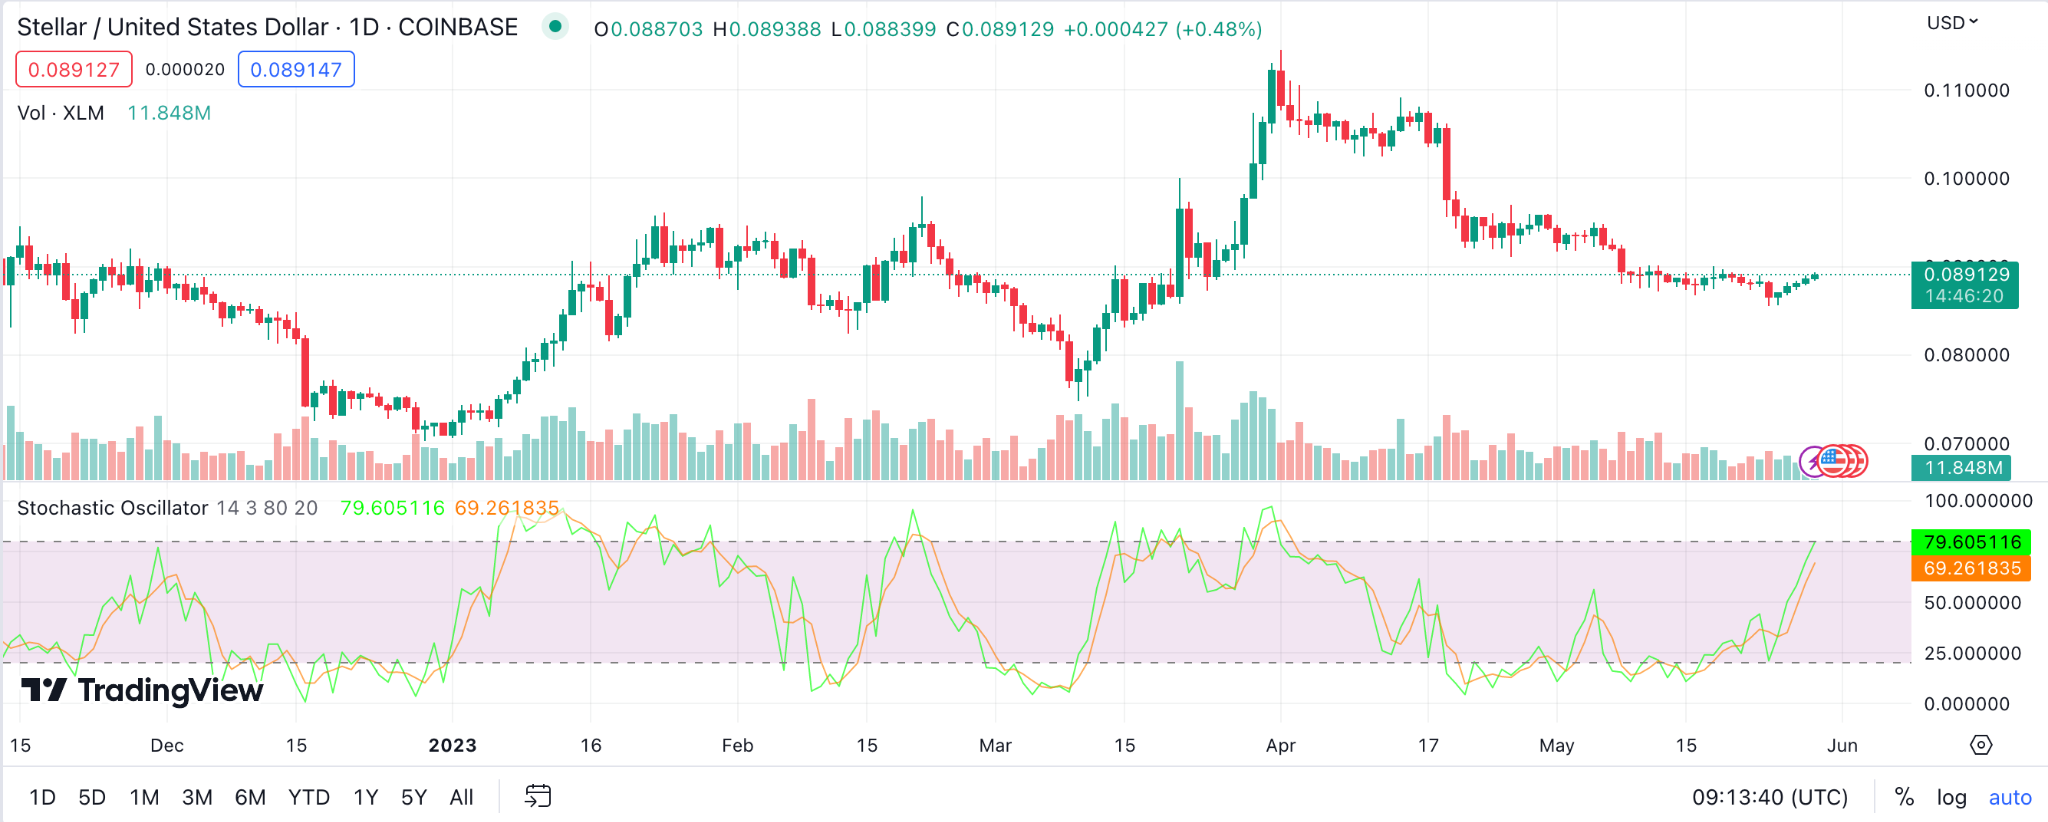
Example: As for Stellar Lumens (XLM), values above 80 are generally associated with the overbought levels and values below 20 with the oversold levels. Hence, if XLM’s stochastic reading is above 80, it suggests a potential downward reversal, and a reading below 20 suggests a possible upward reversal.
Parabolic SAR (Stop and Reverse) for Stellar Price Prediction
Parabolic SAR is a trend-following indicator providing potential entry and exit points. This indicator plots dots or points on the chart, above or below the price, indicating the direction of the trend.
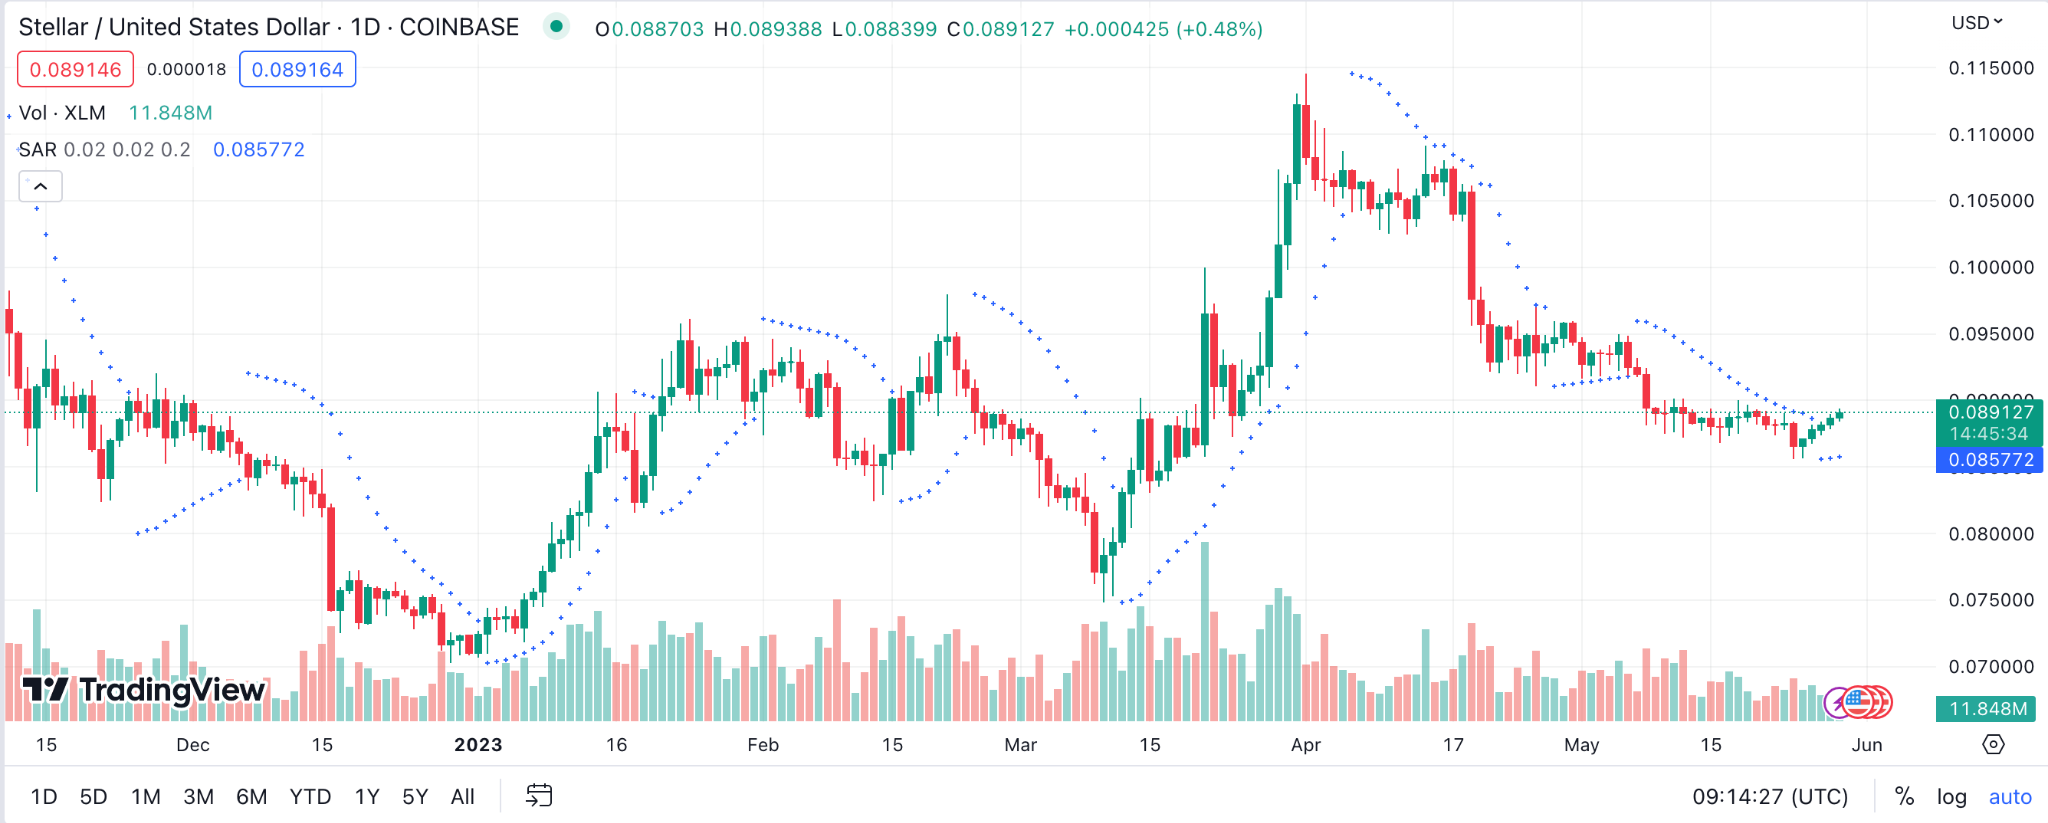
Example: When applied to Stellar Lumens (XLM), dots below the current Stellar price suggest a bullish trend and may indicate good buying opportunities. Conversely, dots above the price indicate a bearish trend and may suggest selling or shorting opportunities.
Ichimoku Cloud for Stellar Price Prediction
The Ichimoku Cloud, also known as Ichimoku Kinko Hyo, is a versatile indicator that defines support and resistance, identifies trend direction, gauges momentum, and provides trading signals. The cloud is formed between two lines known as Senkou Span A and Senkou Span B, and it can be bullish or bearish.
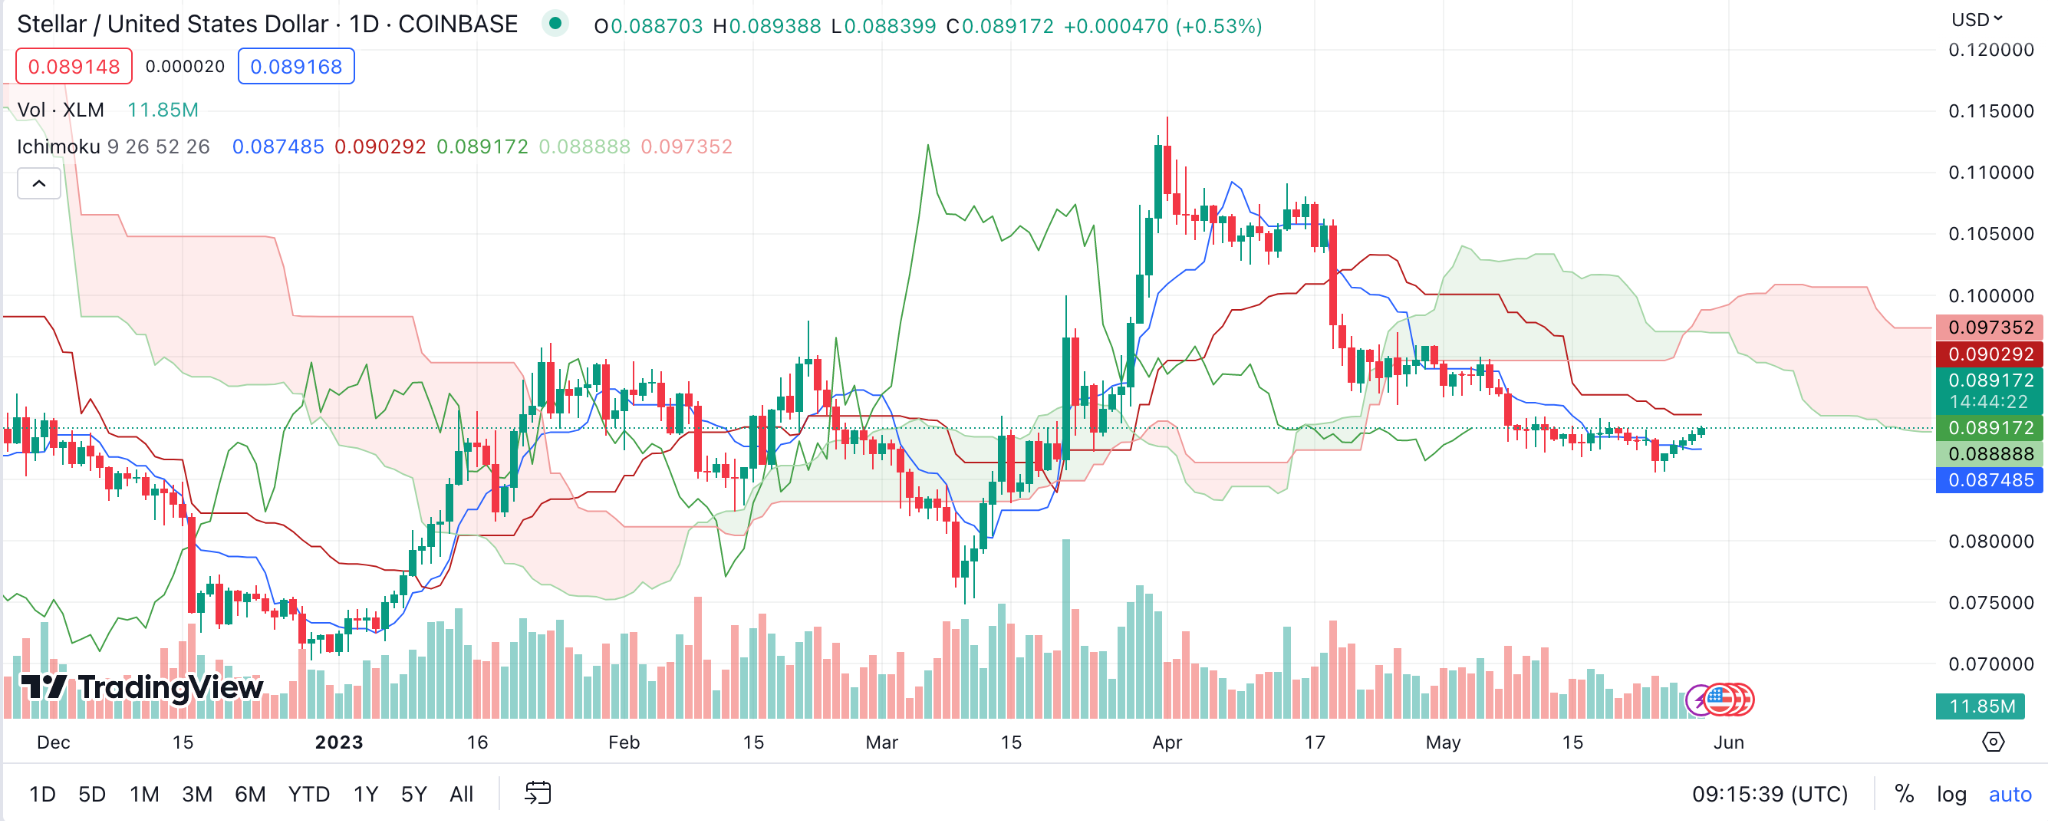
Example: If Stellar’s price is above the cloud, the overall trend is bullish, and it’s bearish if the price is below the cloud. The thickness of the cloud can also act as a measure of market volatility.
Fibonacci Retracement for Stellar Price Prediction
Fibonacci retracements use horizontal lines to indicate areas of support or resistance at the key Fibonacci levels before the price continues in the original direction. These levels are created by drawing a trendline between two extreme points and then dividing the vertical distance by the key Fibonacci ratios of 23.6%, 38.2%, 50%, 61.8%, and 100%.
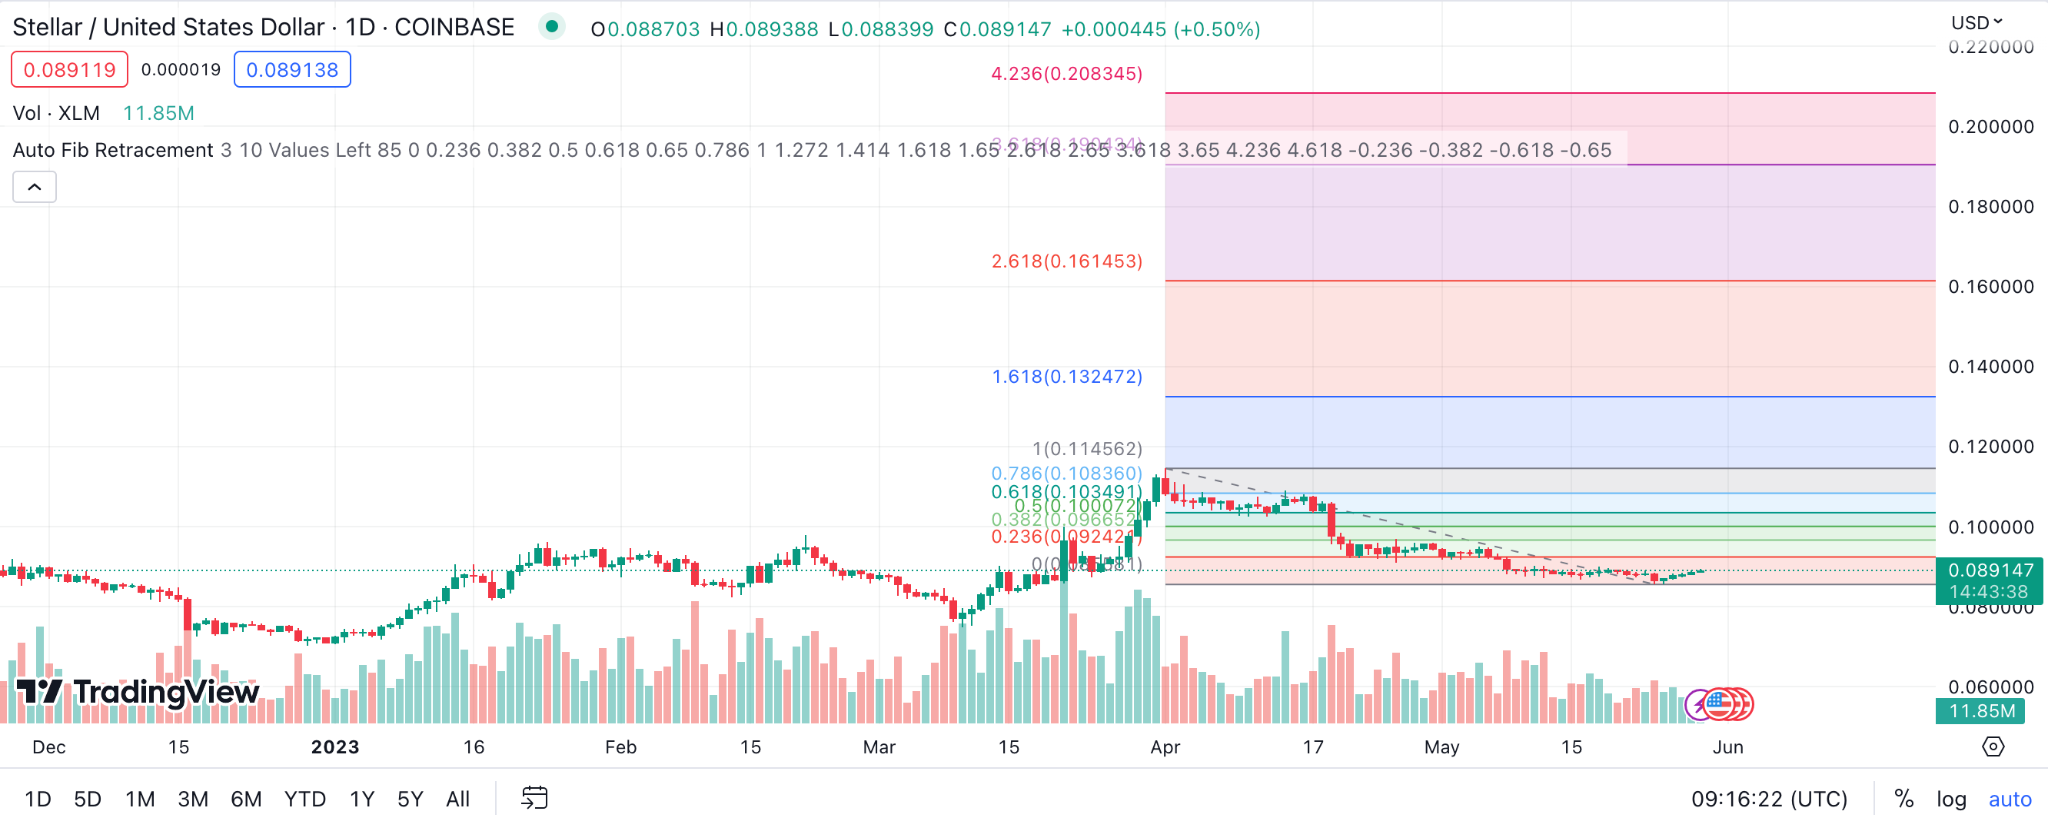
Example: In a Stellar price chart, traders can draw horizontal lines at the Fibonacci Retracement levels of 23.6%, 38.2%, 50%, 61.8%, and 100% to potentially predict where the price may find support or resistance in the future.
Average Directional Index (ADX) for Stellar Price Prediction
The ADX is a technical analysis indicator used to determine when price is trending strongly. It’s generally used along with the Plus Directional Indicator (+DI) and Minus Directional Indicator (-DI) to detect the direction of the trend.

Example: For Stellar Lumens (XLM), an ADX above 25 typically suggests a strong trend, while below 20 indicates a weak trend or range-bound market. The direction of the trend can be identified with the +DI and -DI lines.
On Balance Volume (OBV) for Stellar Price Prediction
OBV is a momentum indicator that uses volume flow to predict changes in stock price. It measures buying and selling pressure by adding volume on up days and subtracting it on down days.
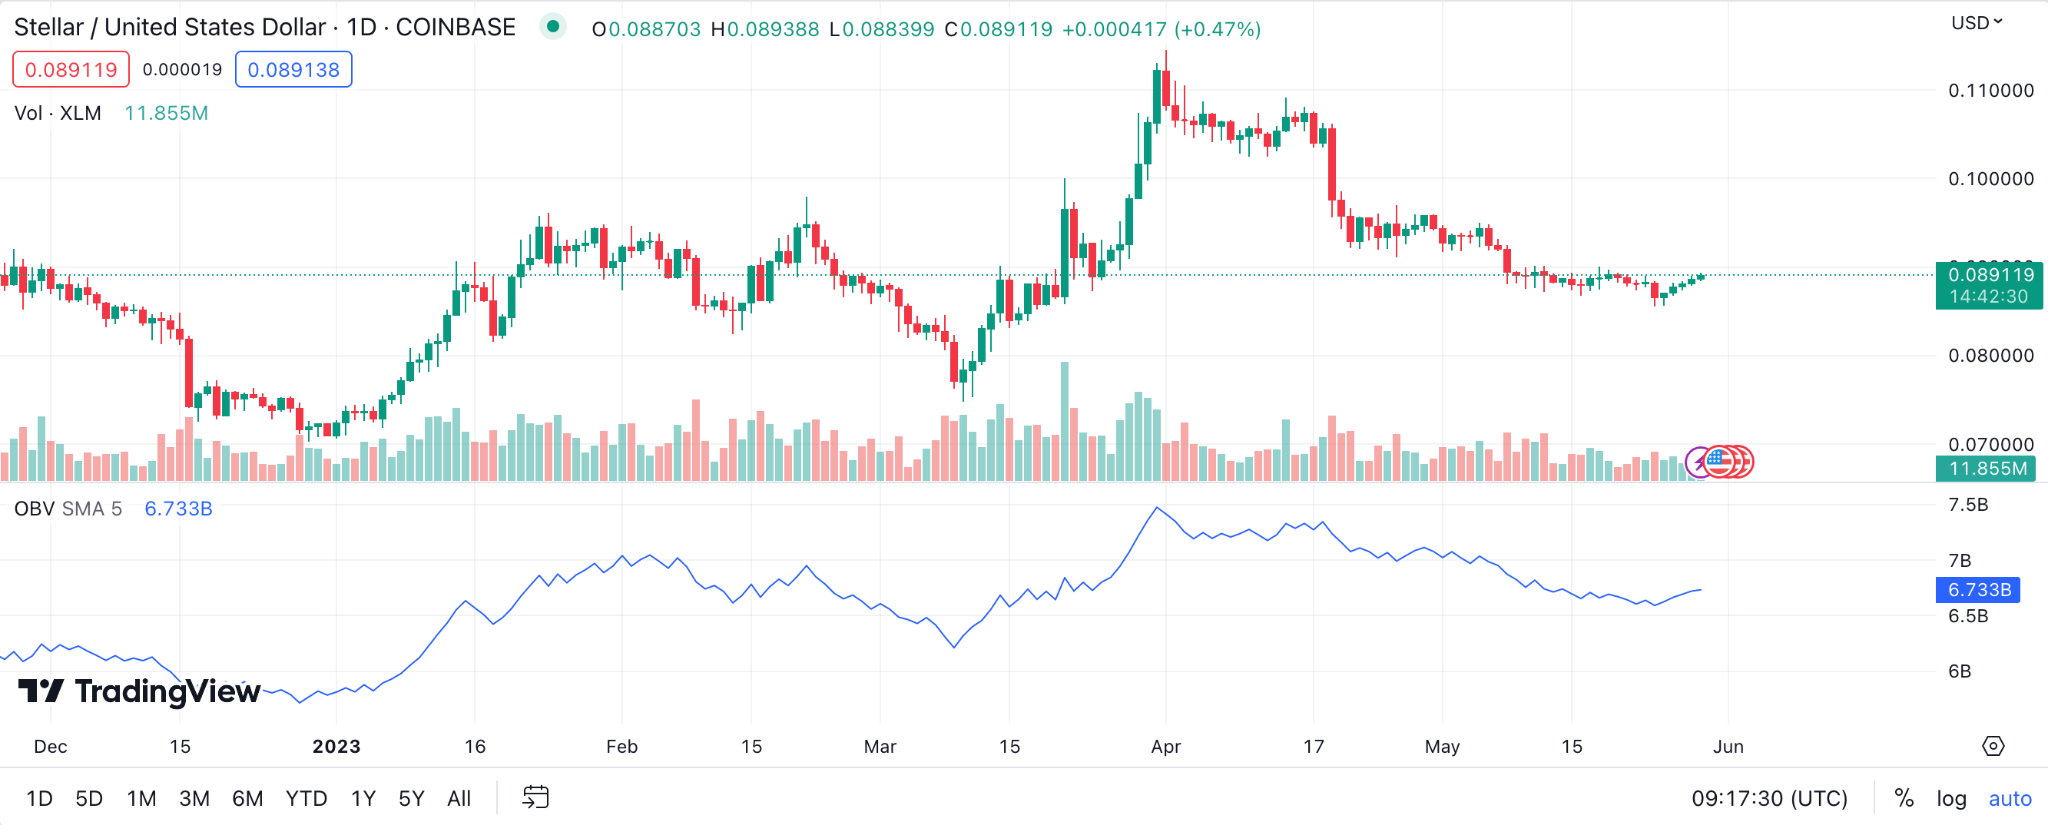
Example: When applied to Stellar Lumens (XLM), a rising OBV reflects positive volume pressure that can lead to higher prices. Conversely, falling OBV reflects negative volume pressure that can cause prices to fall.
Rate of Change (ROC) for Stellar Price Prediction
The Rate of Change (ROC) is a momentum oscillator that calculates the percent change between the current price of an asset, such as Stellar Lumens, and its price a few periods ago.
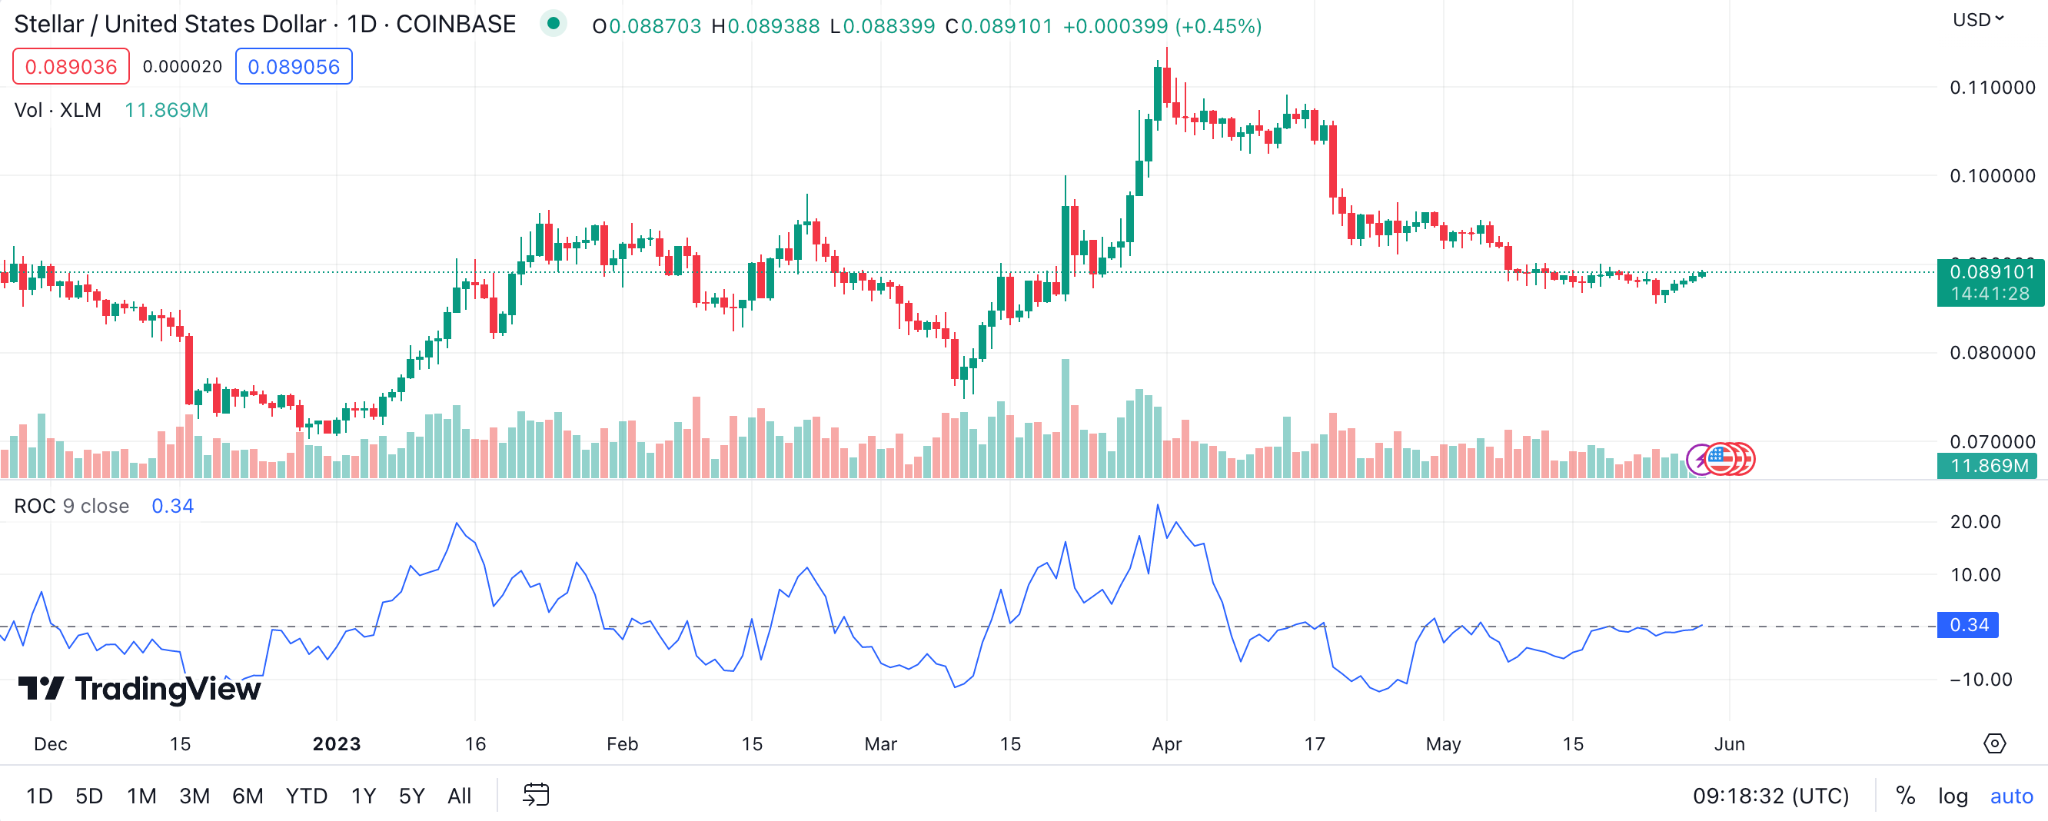
Example: If the ROC is positive, it signals that Stellar’s price is rising. Conversely, a negative ROC indicates a decline. Traders might utilize ROC to confirm the strength of a current trend or identify potential buy/sell signals.
Commodity Channel Index (CCI) for Stellar Price Prediction
Developed by Donald Lambert, the Commodity Channel Index (CCI) is a versatile indicator that measures the deviation of Stellar’s price from its statistical average. CCI is high when prices are far above their average and low when prices are far below their average.
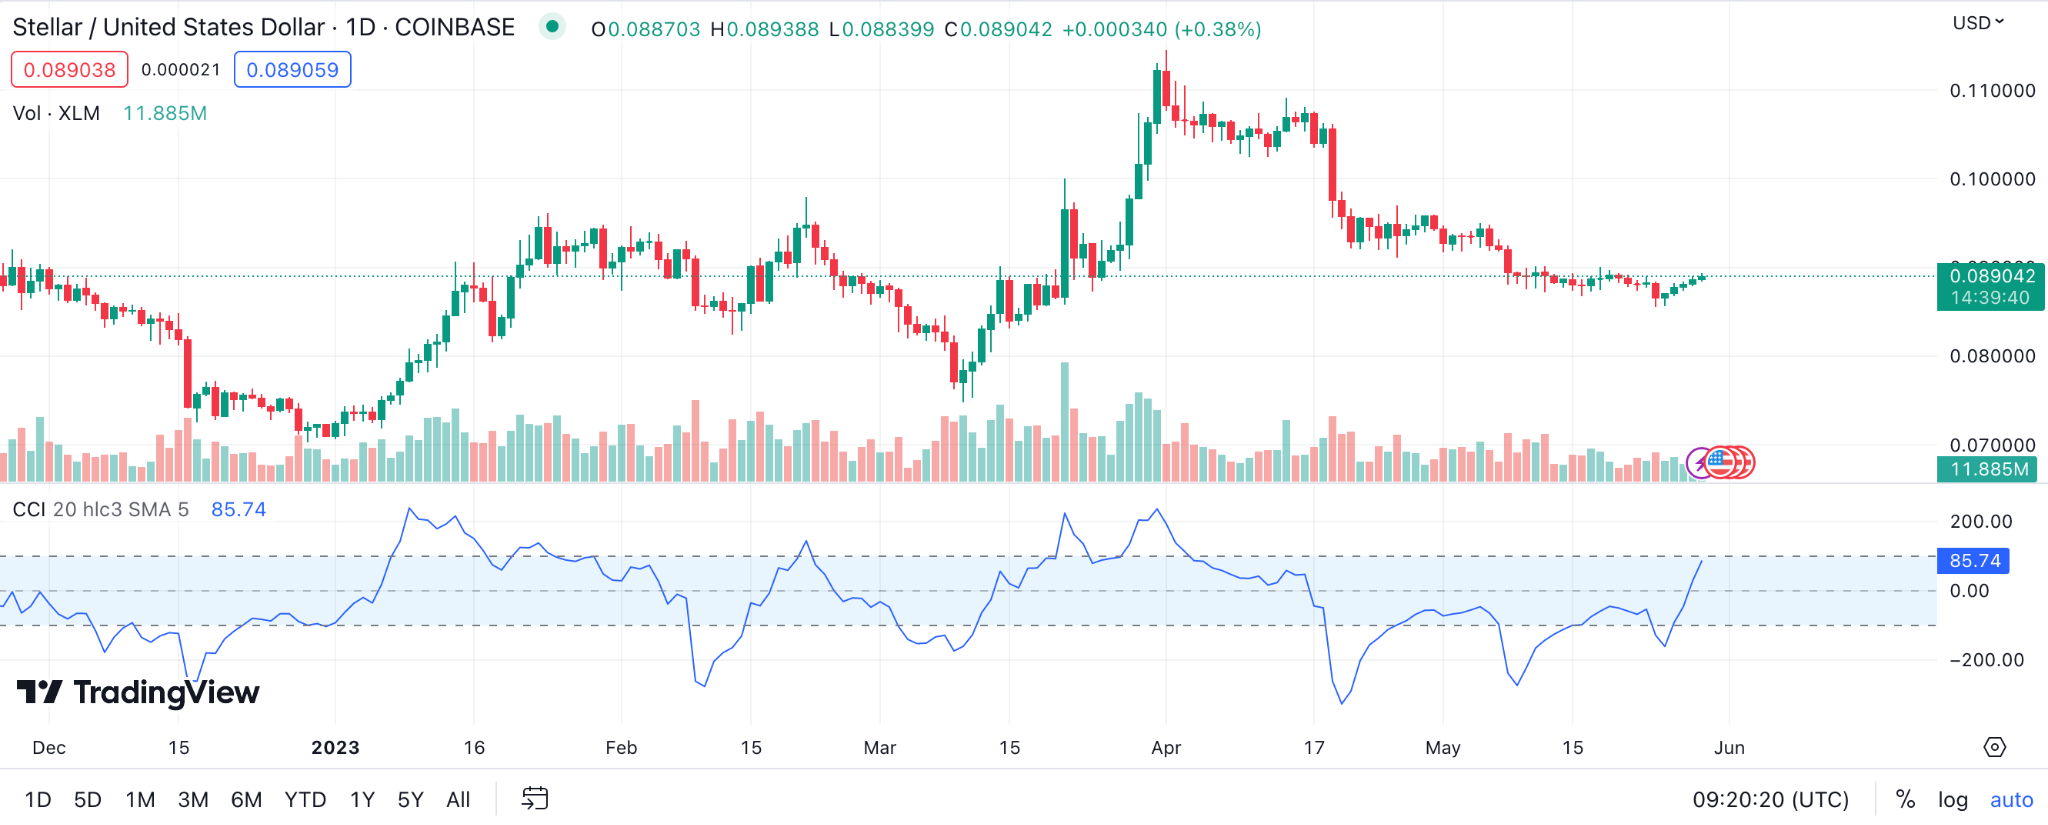
Example: CCI might be used by Stellar traders to identify cyclical turns in the price. If the Stellar’s CCI is above 100, this could imply an emerging bullish trend, while a CCI below -100 might signal a potential bearish trend.
Accumulation/Distribution Line (A/D Line) for Stellar Price Prediction
The Accumulation/Distribution Line is a volume-based indicator designed to reflect cumulative inflows and outflows of money for a security like Stellar Lumens (XLM). The A/D line could give us clues about buying or selling pressure.
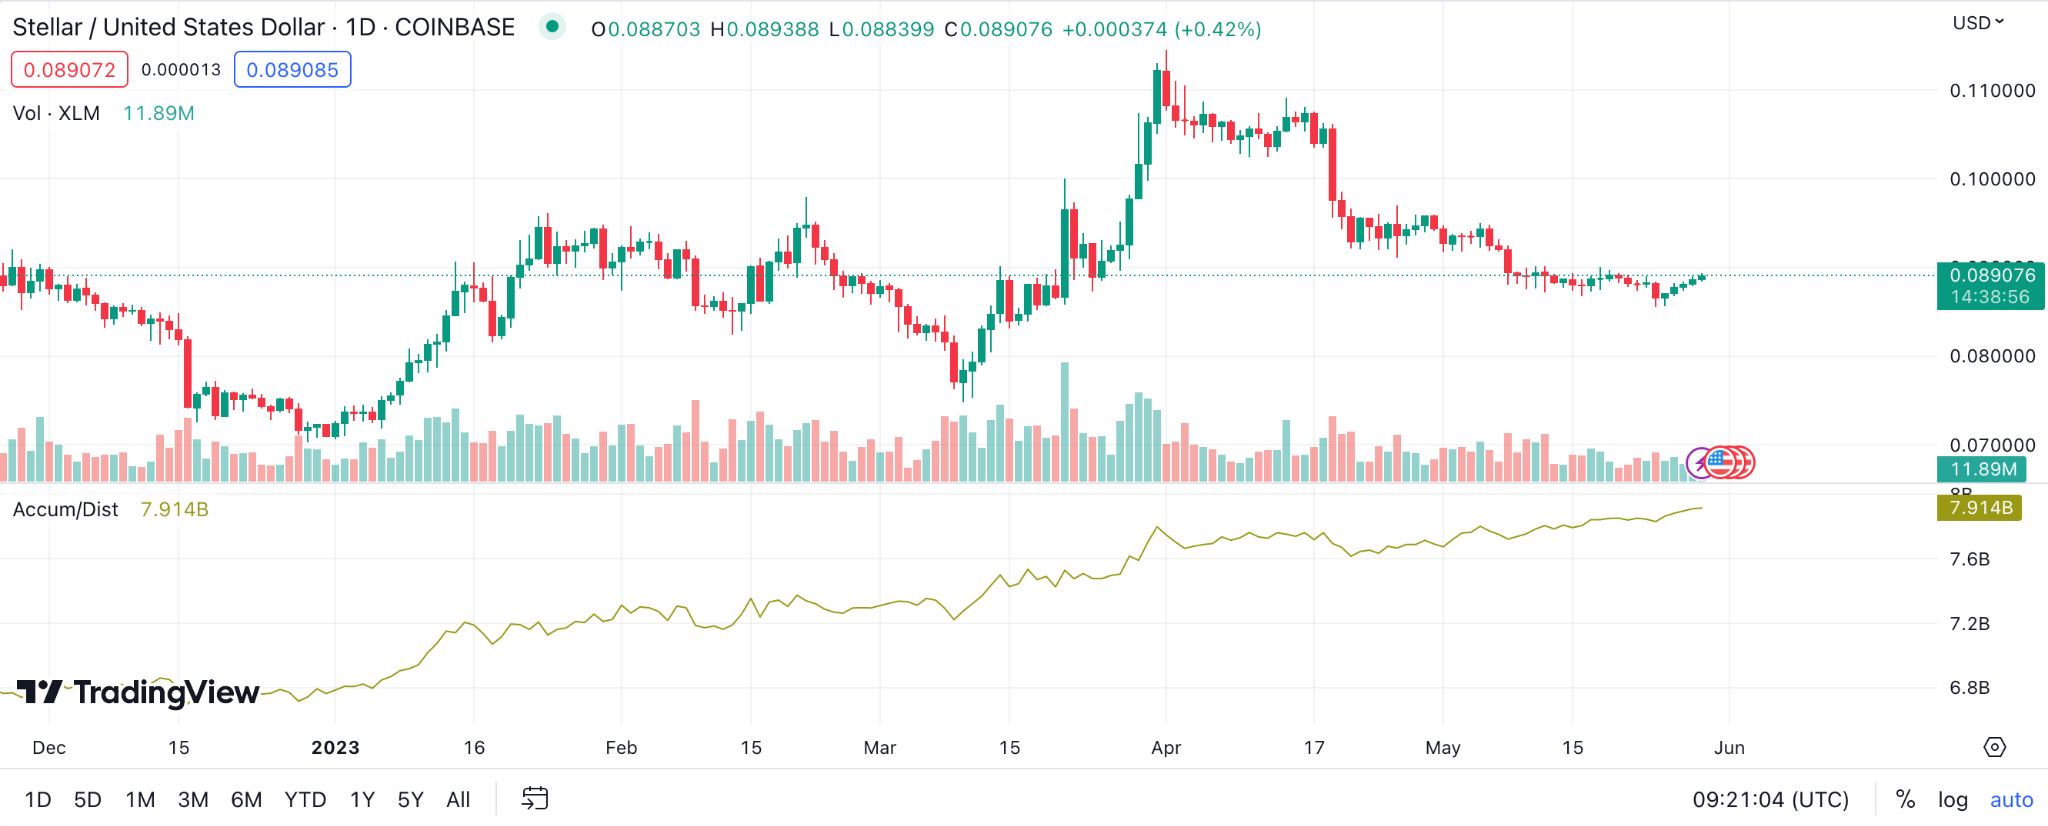
Example: If the A/D line and Stellar’s price are moving in the same direction, it’s considered confirmation of the trend. If they diverge, it could suggest a price reversal.
Pivot Points for Stellar Price Prediction
Pivot Points are widely used by traders to identify potential support and resistance levels during a specific trading period. They are calculated using the previous period’s high, low, and closing prices and can be applied on various timeframes, such as daily, weekly, or monthly charts.
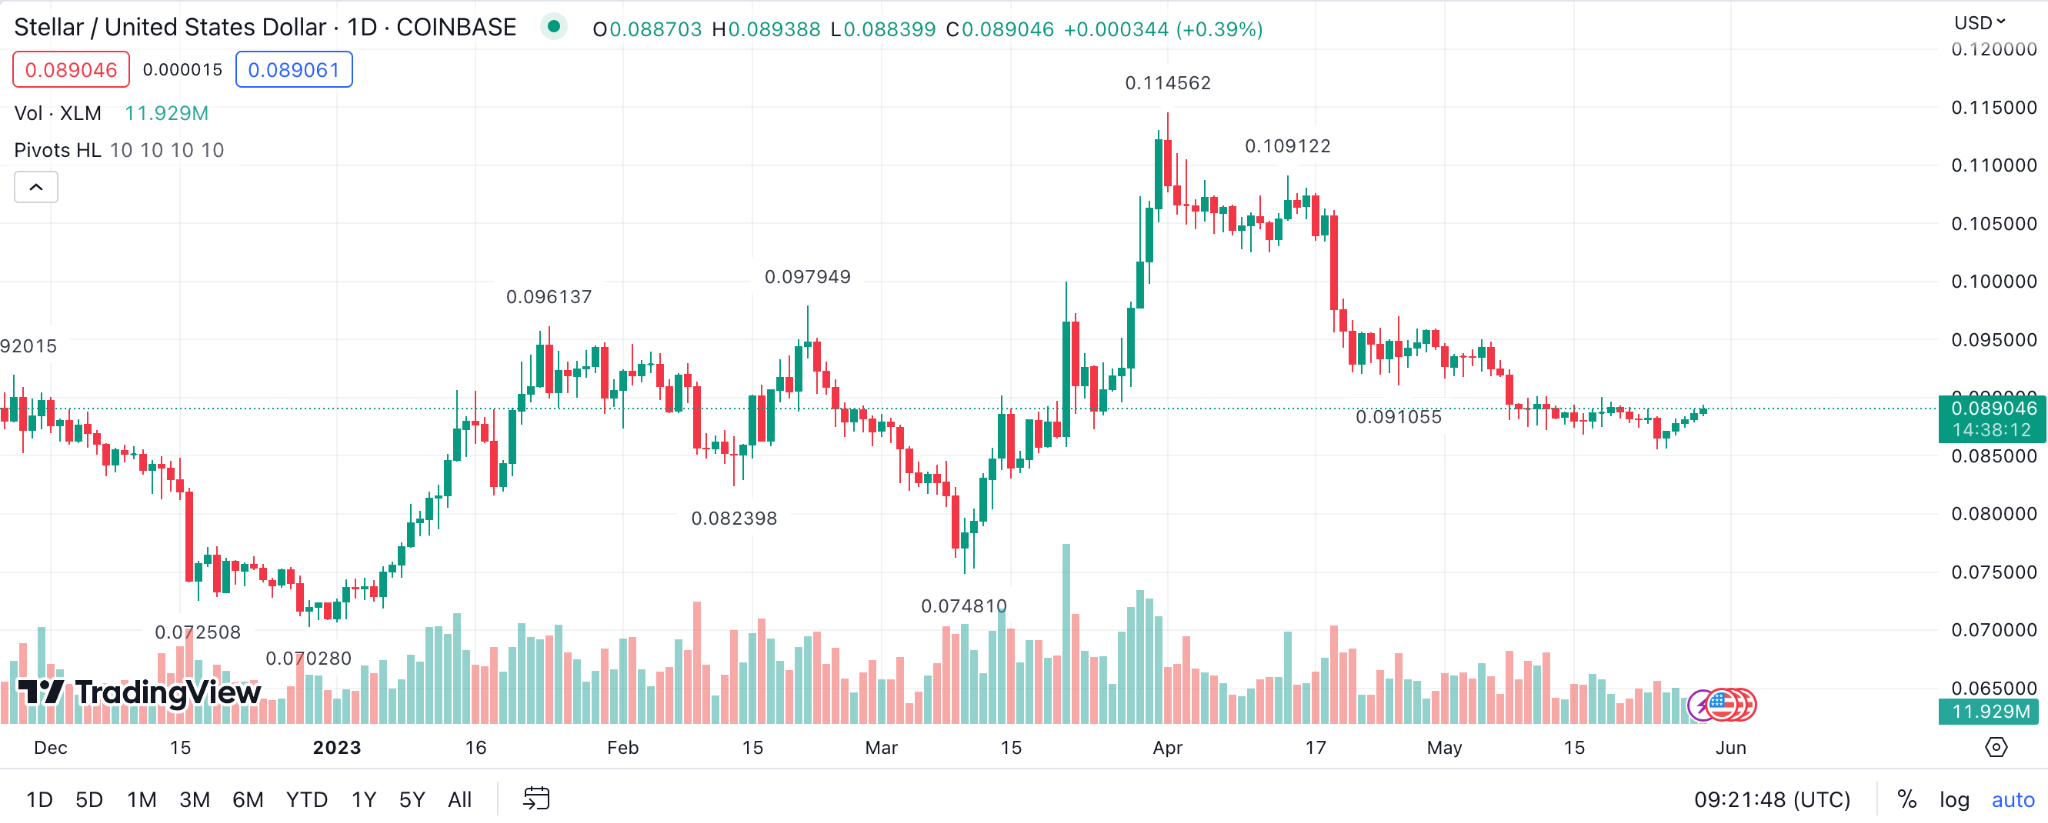
Example: If Stellar’s price approaches a pivot point from below, the pivot point may act as resistance. If the price is coming down to a pivot point, it could act as support.
Chaikin Money Flow (CMF) for Stellar Price Prediction
Chaikin Money Flow (CMF) is a technical analysis indicator used to measure Money Flow Volume over a specific period. Money Flow Volume forms the basis for the Accumulation Distribution Line. Instead of a cumulative total of Money Flow Volume, Chaikin Money Flow sums Money Flow Volume for a specific look-back period, typically 20 or 21 days. The resulting indicator fluctuates above/below the zero line just like an oscillator.
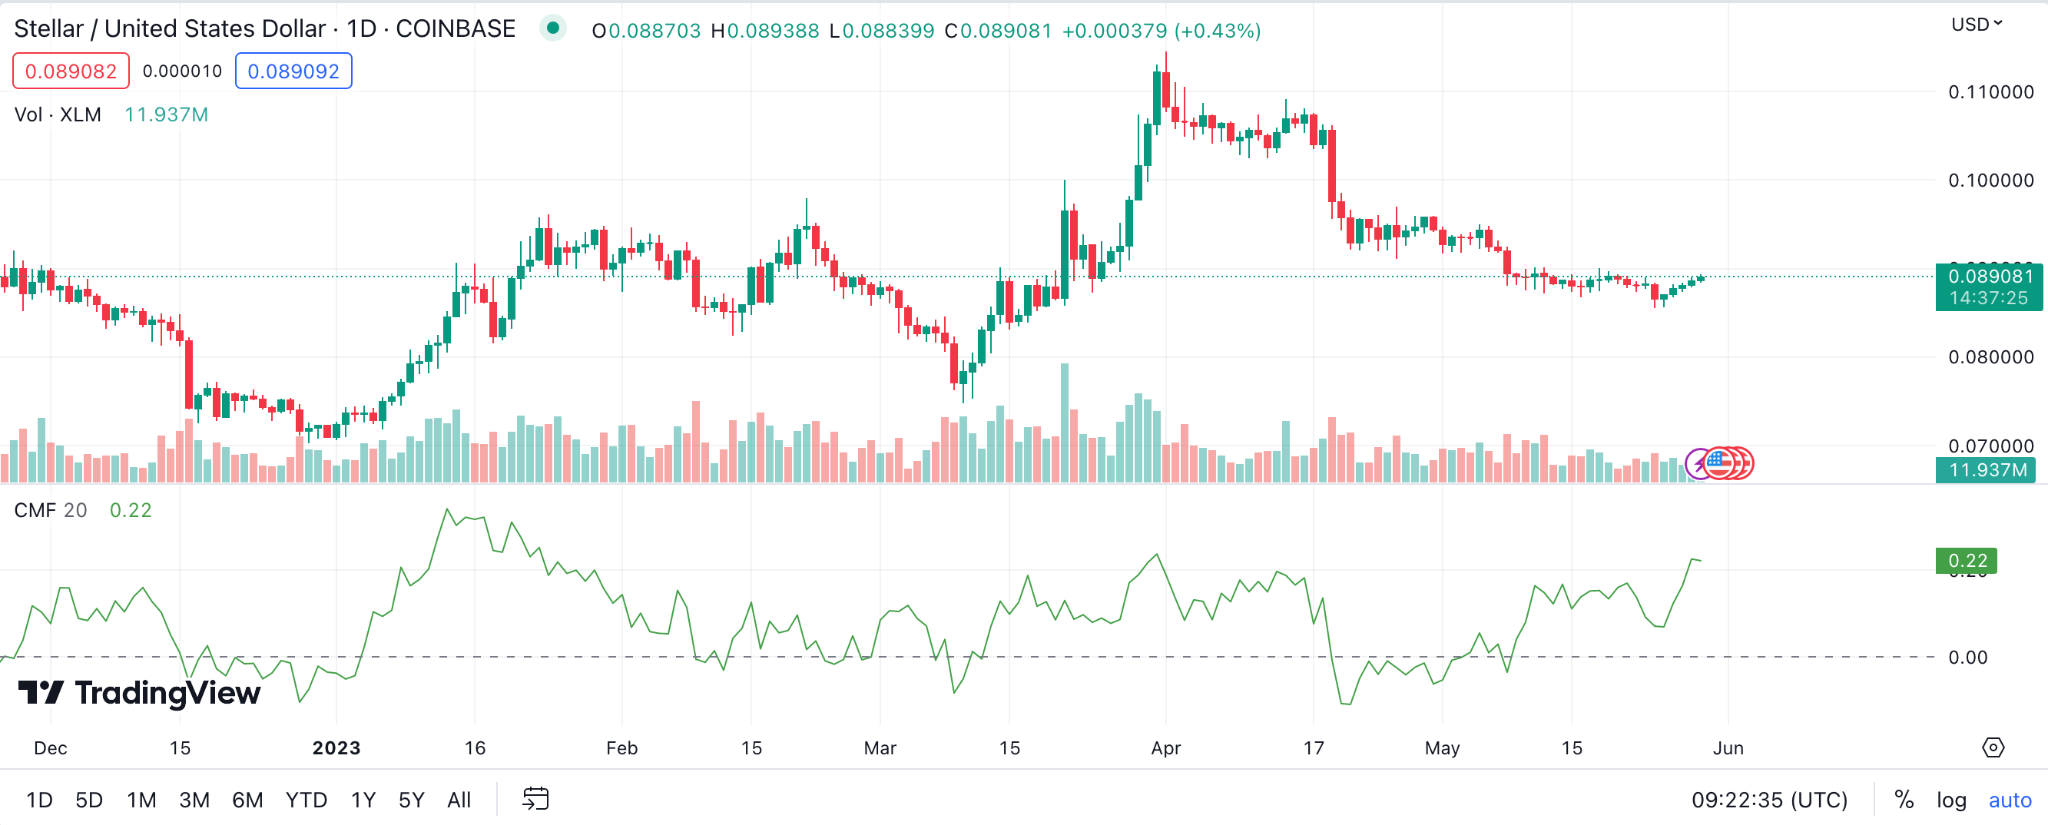
Example: A high positive CMF value could indicate strong buying pressure and a possible bullish trend for Stellar Lumens (XLM). Conversely, a negative CMF value might suggest strong selling pressure and a potential bearish trend.
Aroon Indicator for Stellar Price Prediction
Aroon is a technical indicator that is used to identify whether Stellar Lumens is in a trend, and more specifically if the price is hitting new highs or lows over the calculation period (typically 14 periods). The indicator consists of the ‘Aroon Up’ line, which measures the strength of the uptrend, and the ‘Aroon Down’ line, which measures the strength of the downtrend.
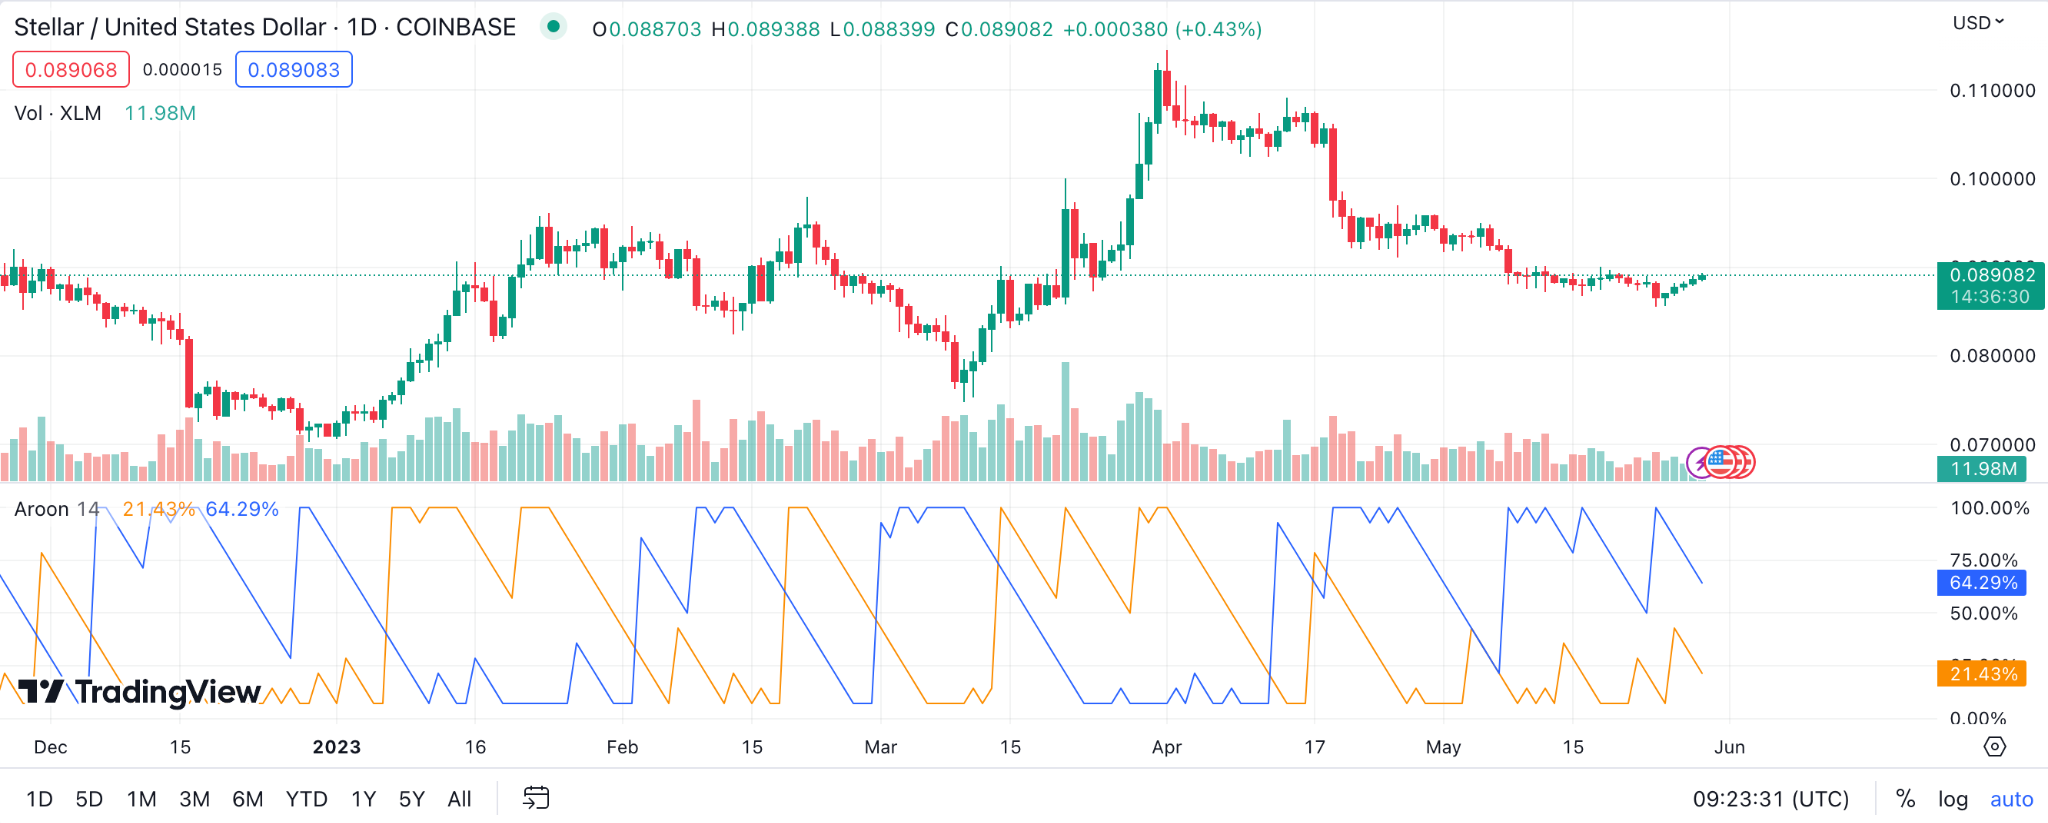
Example: For Stellar Lumens (XLM) traders, if the Aroon Up is above the Aroon Down, then it signals bullish price behavior. Conversely, if the Aroon Down is above the Aroon Up, it signals a potential bearish price swing.
Gann Fan for Stellar Price Prediction
The Gann Fan is a technical analysis tool created by W.D. Gann. This tool is designed to depict various angles that help predict price changes on a chart. Stellar traders use these angles to anticipate potential areas of support or resistance.
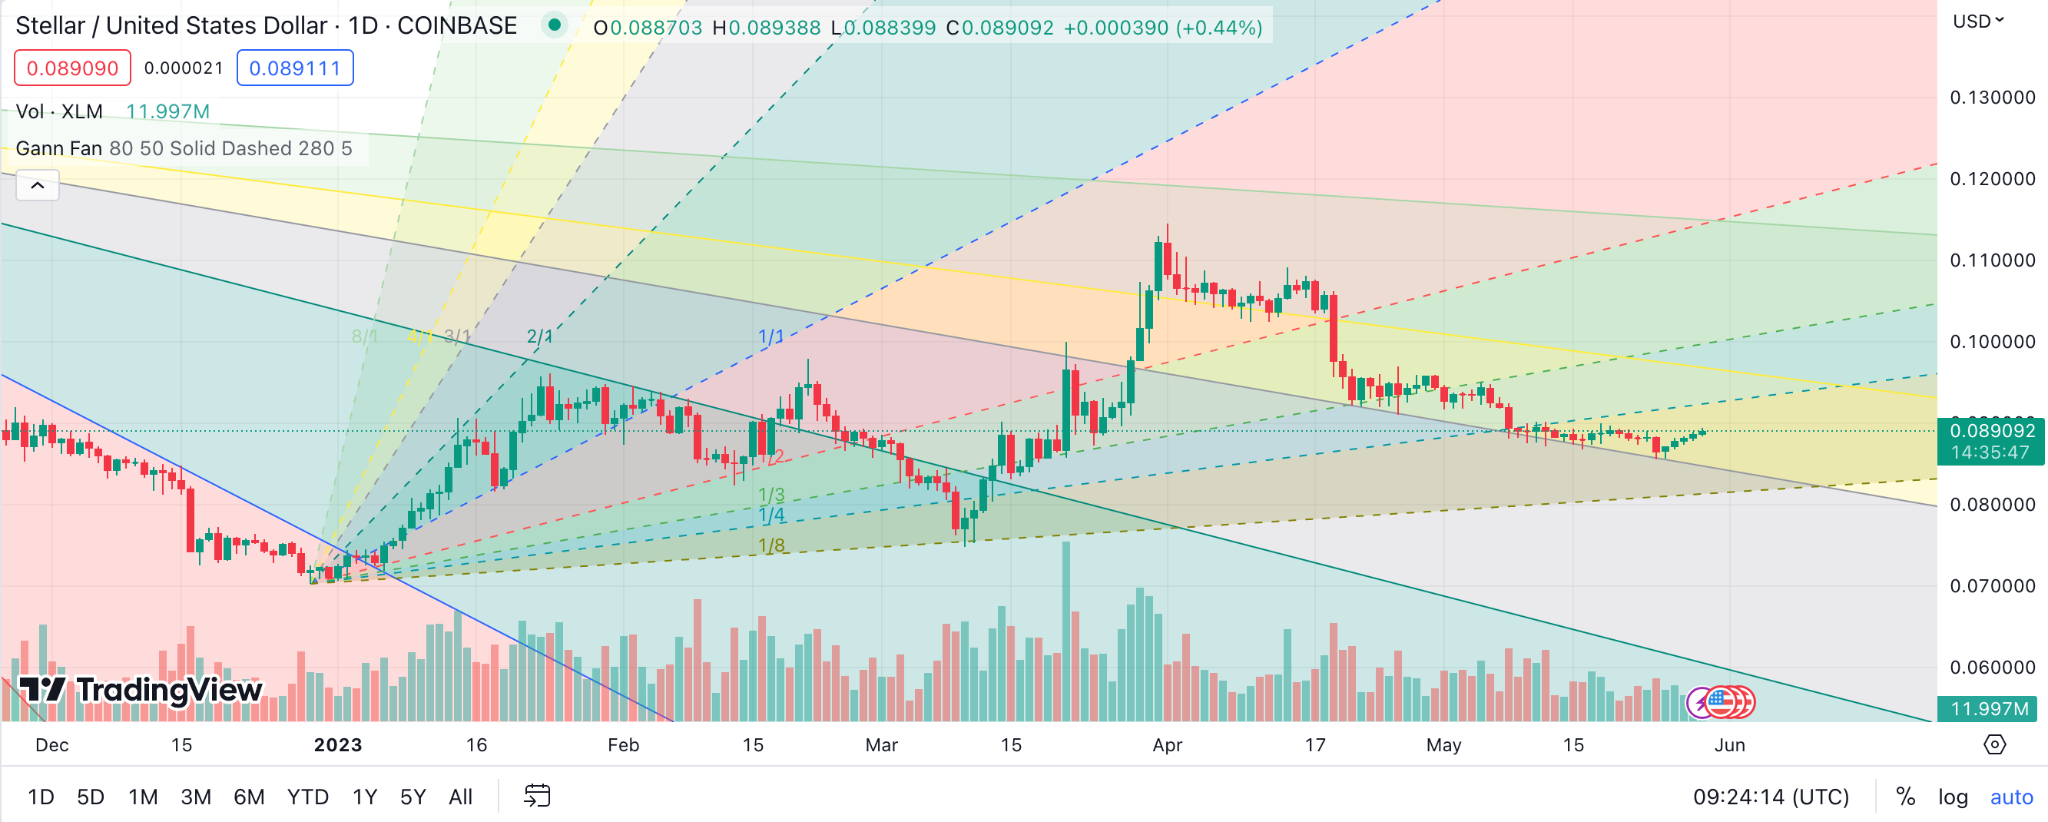
Example: Suppose Stellar’s price touches the 1/1 Gann angle, that suggests a strong trend where price and time move in parity. This information could be crucial in determining if Stellar is going to maintain its momentum or slow down.
Keltner Channel for Stellar Lumens Price Prediction
The Keltner Channel, created by Chester Keltner, is a technical indicator that plots lines above and below an exponential moving average of Stellar’s price. It serves as a measure of volatility and is similar to Bollinger Bands. The width of the channel illustrates Stellar’s volatility: a wider channel suggests high volatility, and a narrower one signifies low volatility.
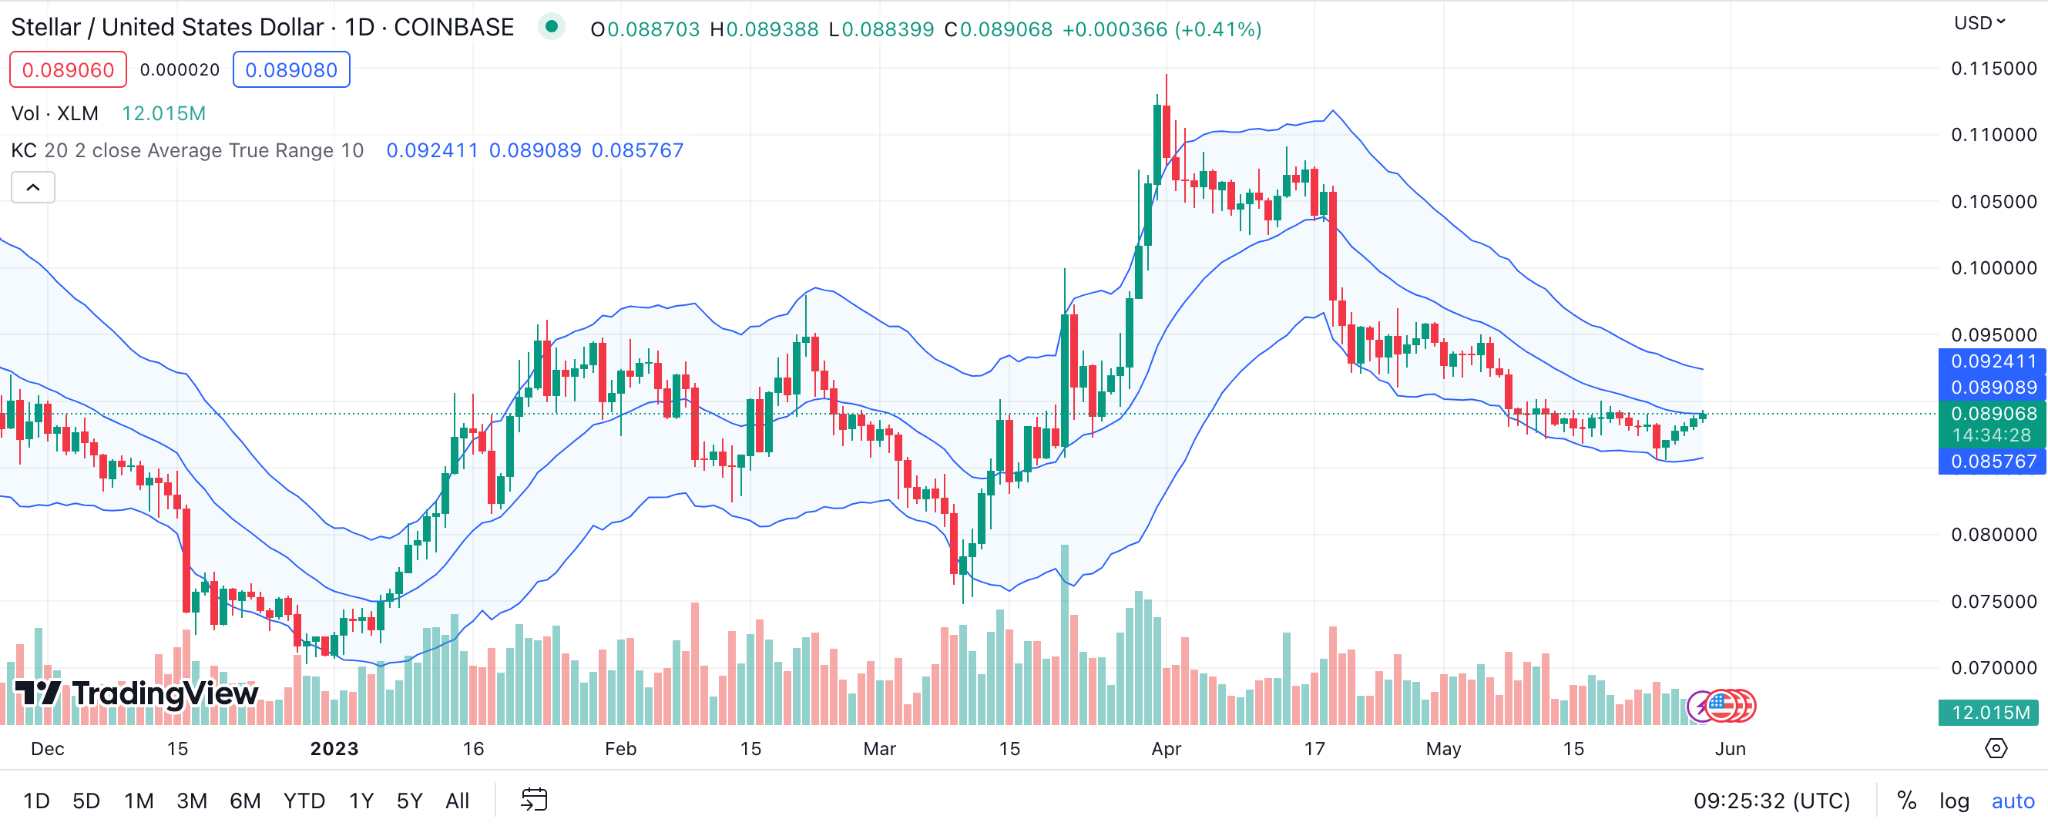
Example: If Stellar’s price exceeds the upper band, it could be a sign that XLM is overbought and could soon undergo a price correction. Similarly, a dip below the lower band might indicate that Stellar Lumens is oversold and might bounce back.
Money Flow Index (MFI) for Stellar Price Prediction
The Money Flow Index, or MFI, is an oscillator that uses both price and trading volume data to identify overbought or oversold conditions in Stellar’s price. The MFI ranges from 0 to 100 and is often compared to the Relative Strength Index (RSI), although it incorporates volume, giving it an additional dimension. A high MFI (above 80) could signal an overbought condition (and potential price drop), whereas a low MFI (below 20) may suggest an oversold condition (and possible price rally).
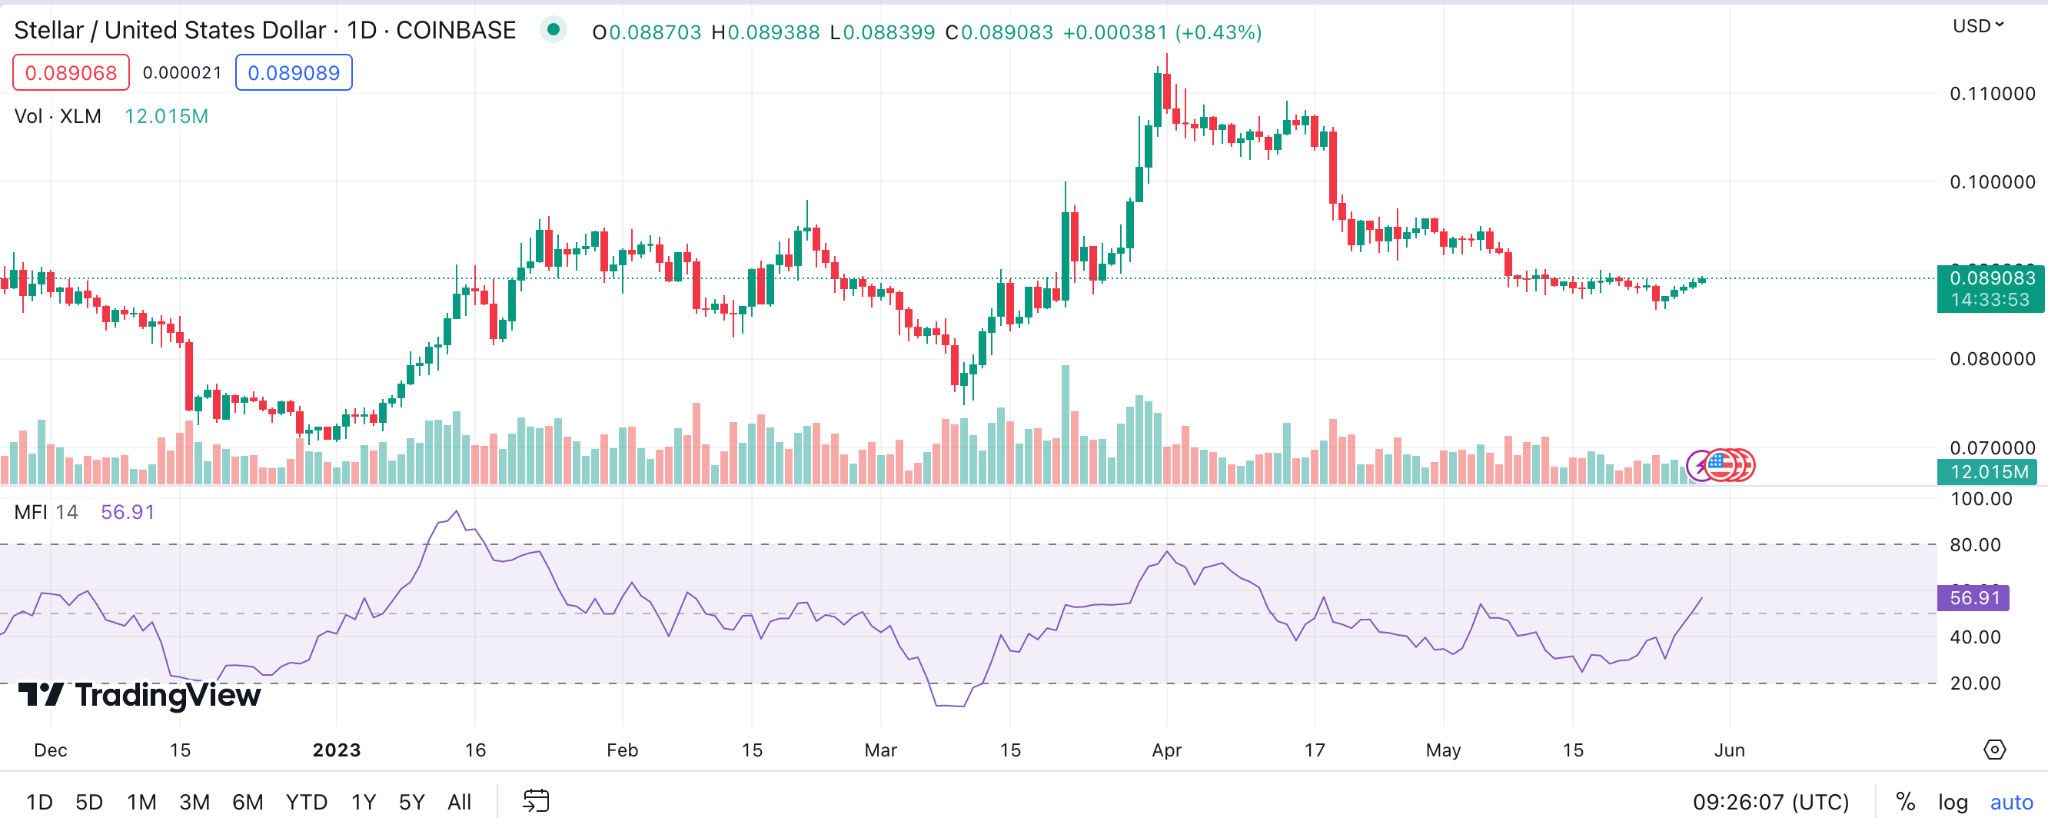
Example: If MFI for Stellar Lumens (XLM) moves above 80, it might suggest that Stellar is overbought, and a price correction may be imminent. Conversely, if MFI dips below 20, it might imply that Stellar is oversold, potentially signaling a buying opportunity for traders.
TRIX for Stellar Lumens Price Prediction
TRIX, or Triple Exponential Average, is an oscillator used to identify the percentage change in a triple exponentially smoothed moving average of Stellar’s price. Its primary purpose is to filter out insignificant price movements and highlight underlying trends.
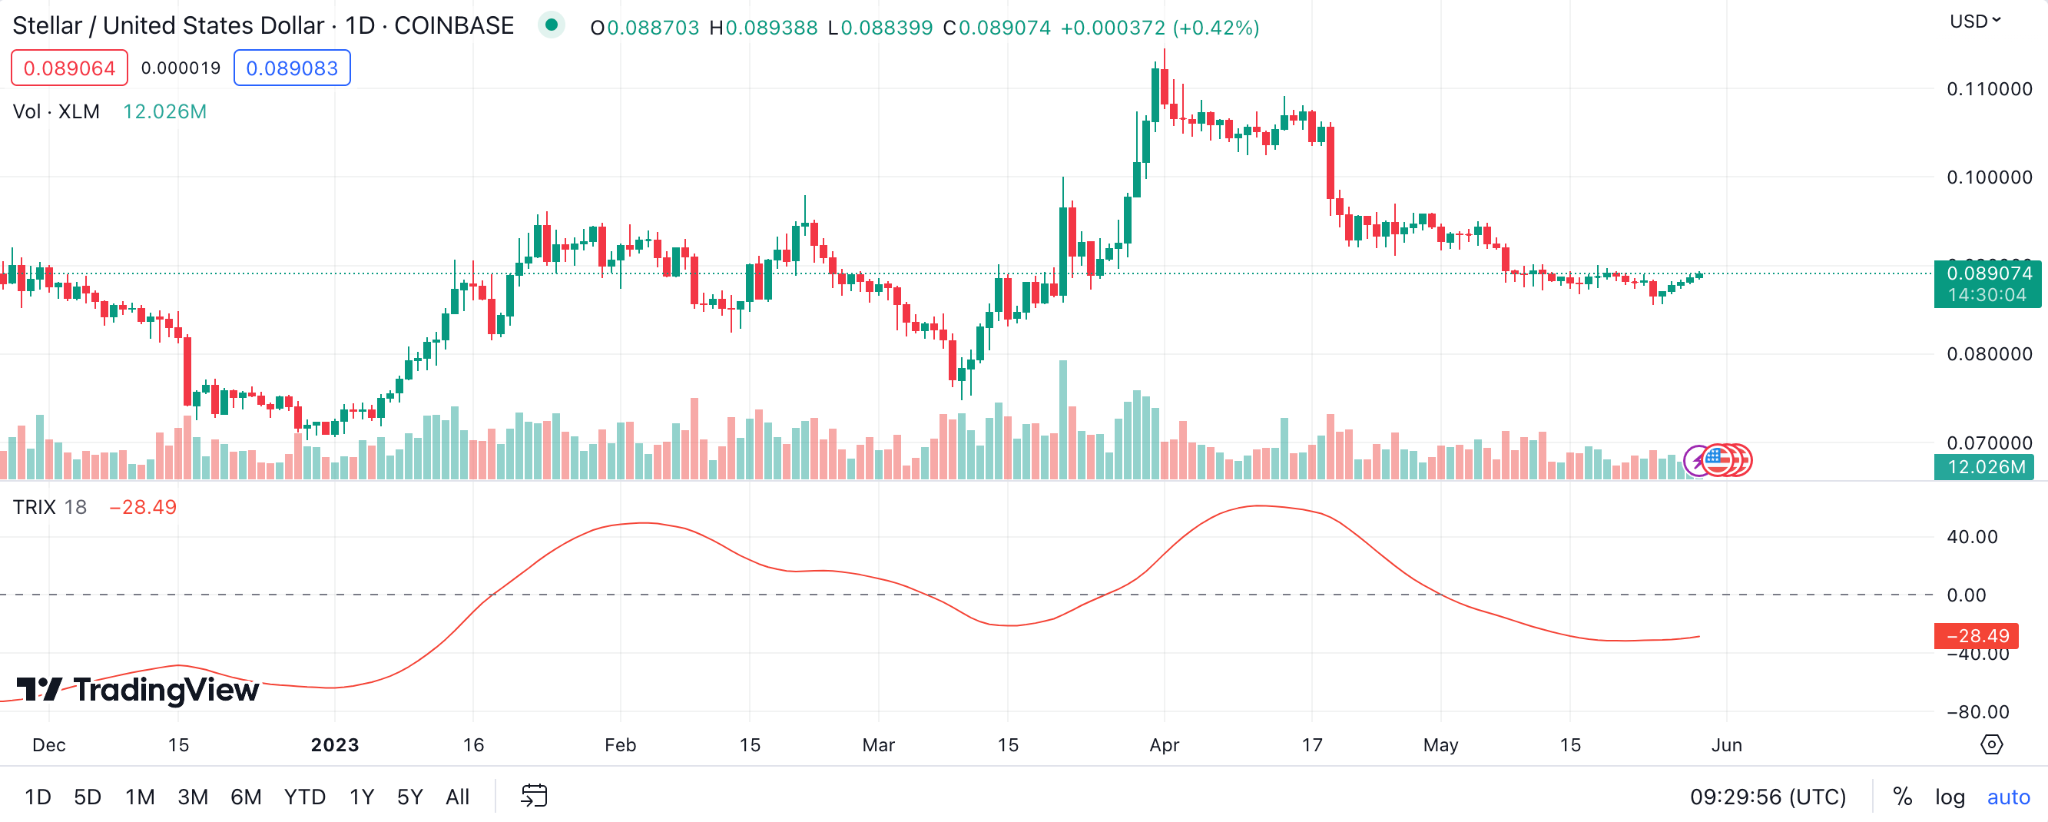
Example: When Stellar’s TRIX line crosses above the zero line, it can suggest a bullish trend, and a potential buying opportunity. Conversely, a cross below the zero line could indicate a bearish trend, and possibly a good time to sell.
The Zig Zag Indicator for Stellar Price Prediction
The Zig Zag indicator is a technical analysis tool used to identify significant price movements of Stellar Lumens while ignoring minor price fluctuations. It helps traders visualize the larger trend by connecting significant highs and lows in the price chart.
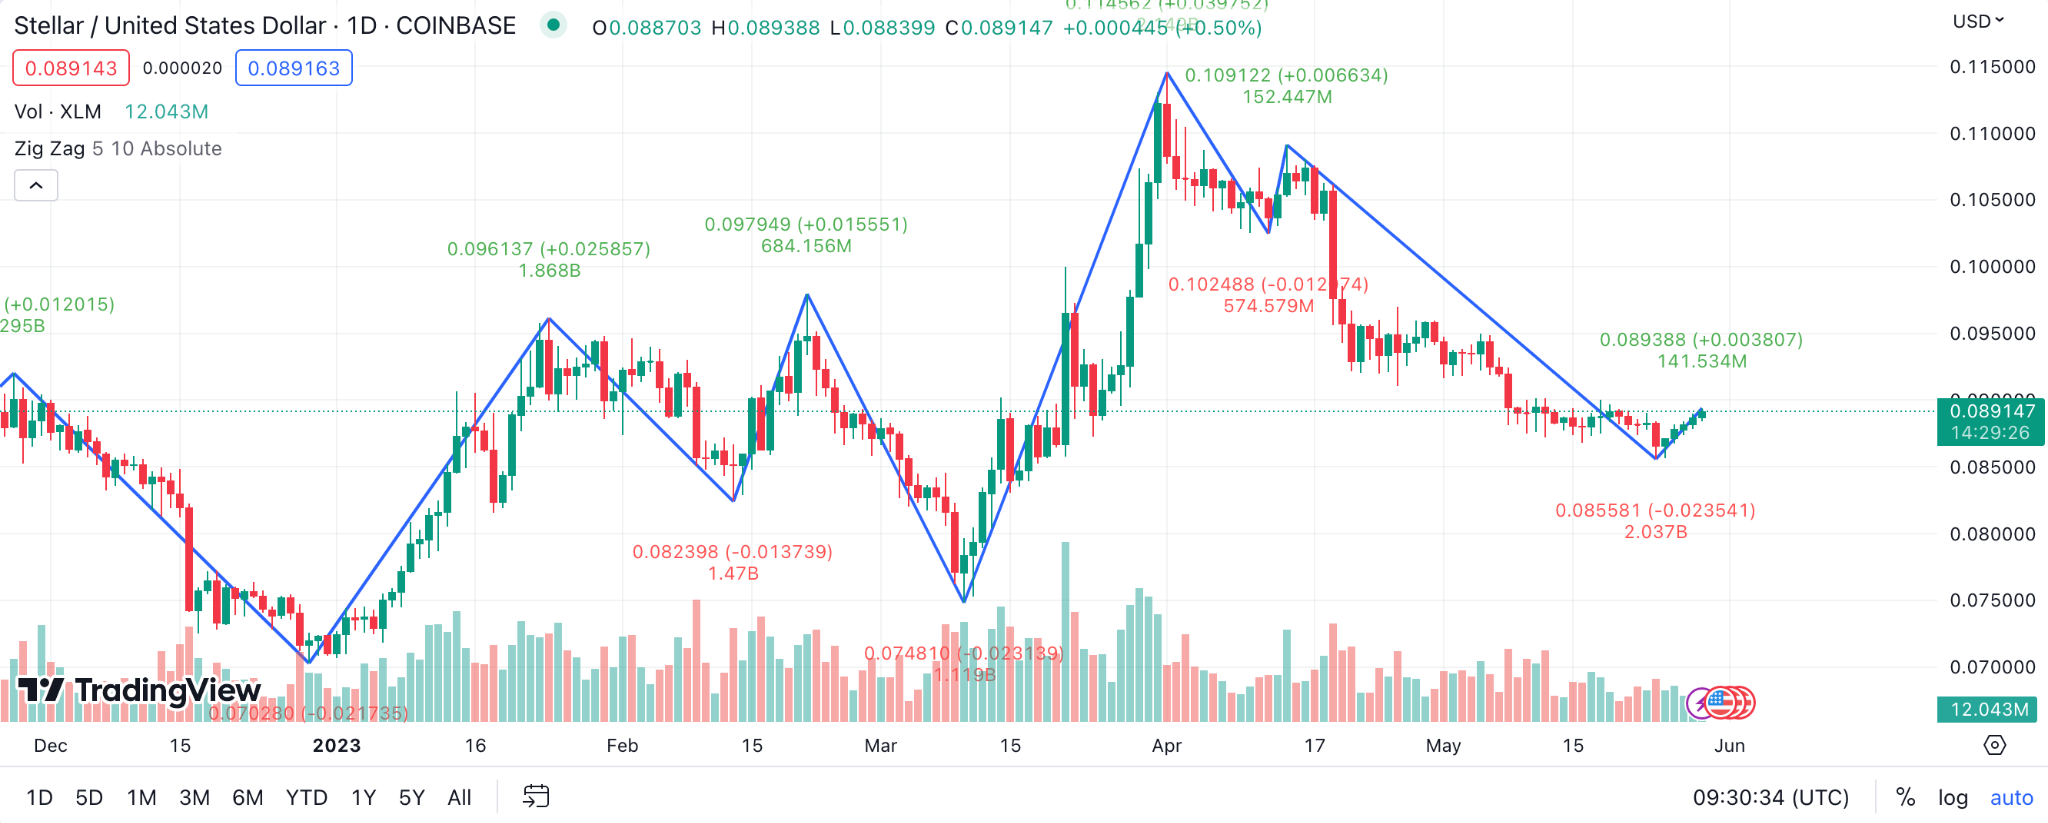
Example: If Stellar’s price trend was generally downward, but it started to form higher lows and higher highs, the Zig Zag indicator might help you spot this shift earlier.
Detrended Price Oscillator (DPO) for Stellar Price Prediction
The Detrended Price Oscillator (DPO) is a handy tool that eliminates long-term trends, essentially detrending the data, to better focus on the intermediate cycles. For XLM price, this would mean removing the broader upward or downward trend to identify the shorter-term patterns. The DPO identifies cycles by comparing a past price to a moving average.
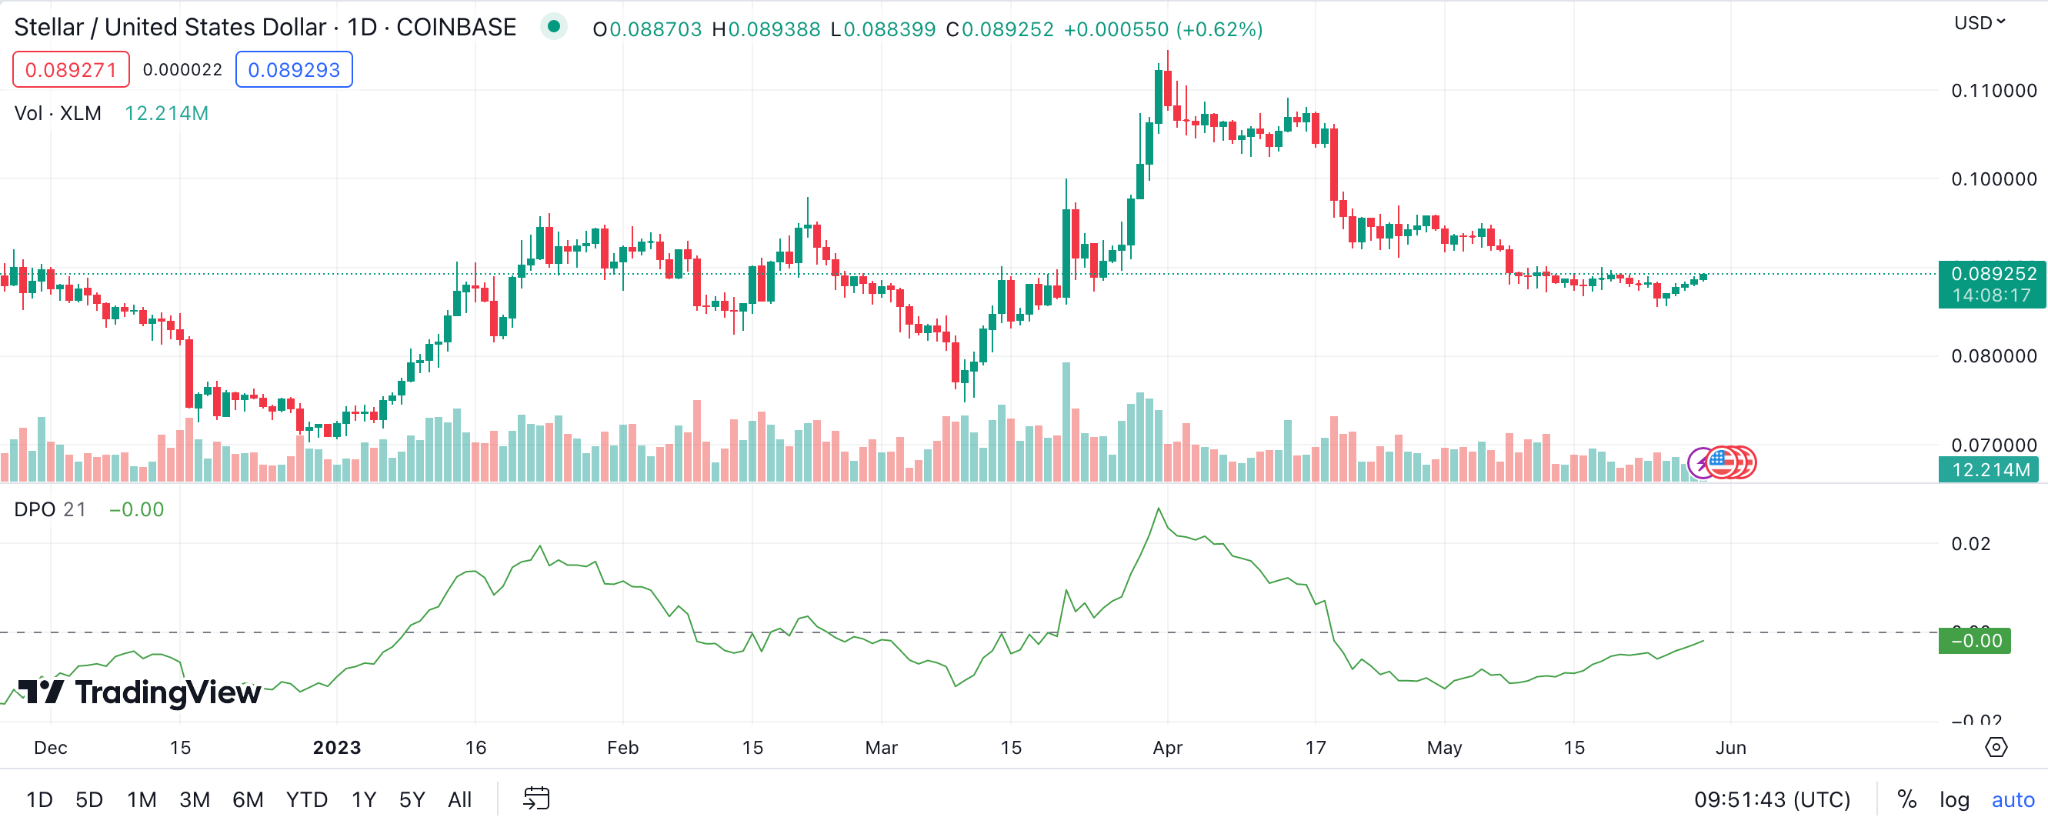
Example: If the DPO shows a high value, it may indicate that Stellar’s price is above its current trend, hinting at potential bearish movement. Conversely, a low DPO might imply a bullish trend, as it can mean the price is below its trend.
Vortex Indicator (VI) for Stellar Price Prediction
The Vortex Indicator (VI) is a unique tool, inspired by the natural flow and vortex of water, used to identify the start of a new trend or the continuation of an existing trend in the market. The VI consists of two oscillating lines: VI+ and VI-.
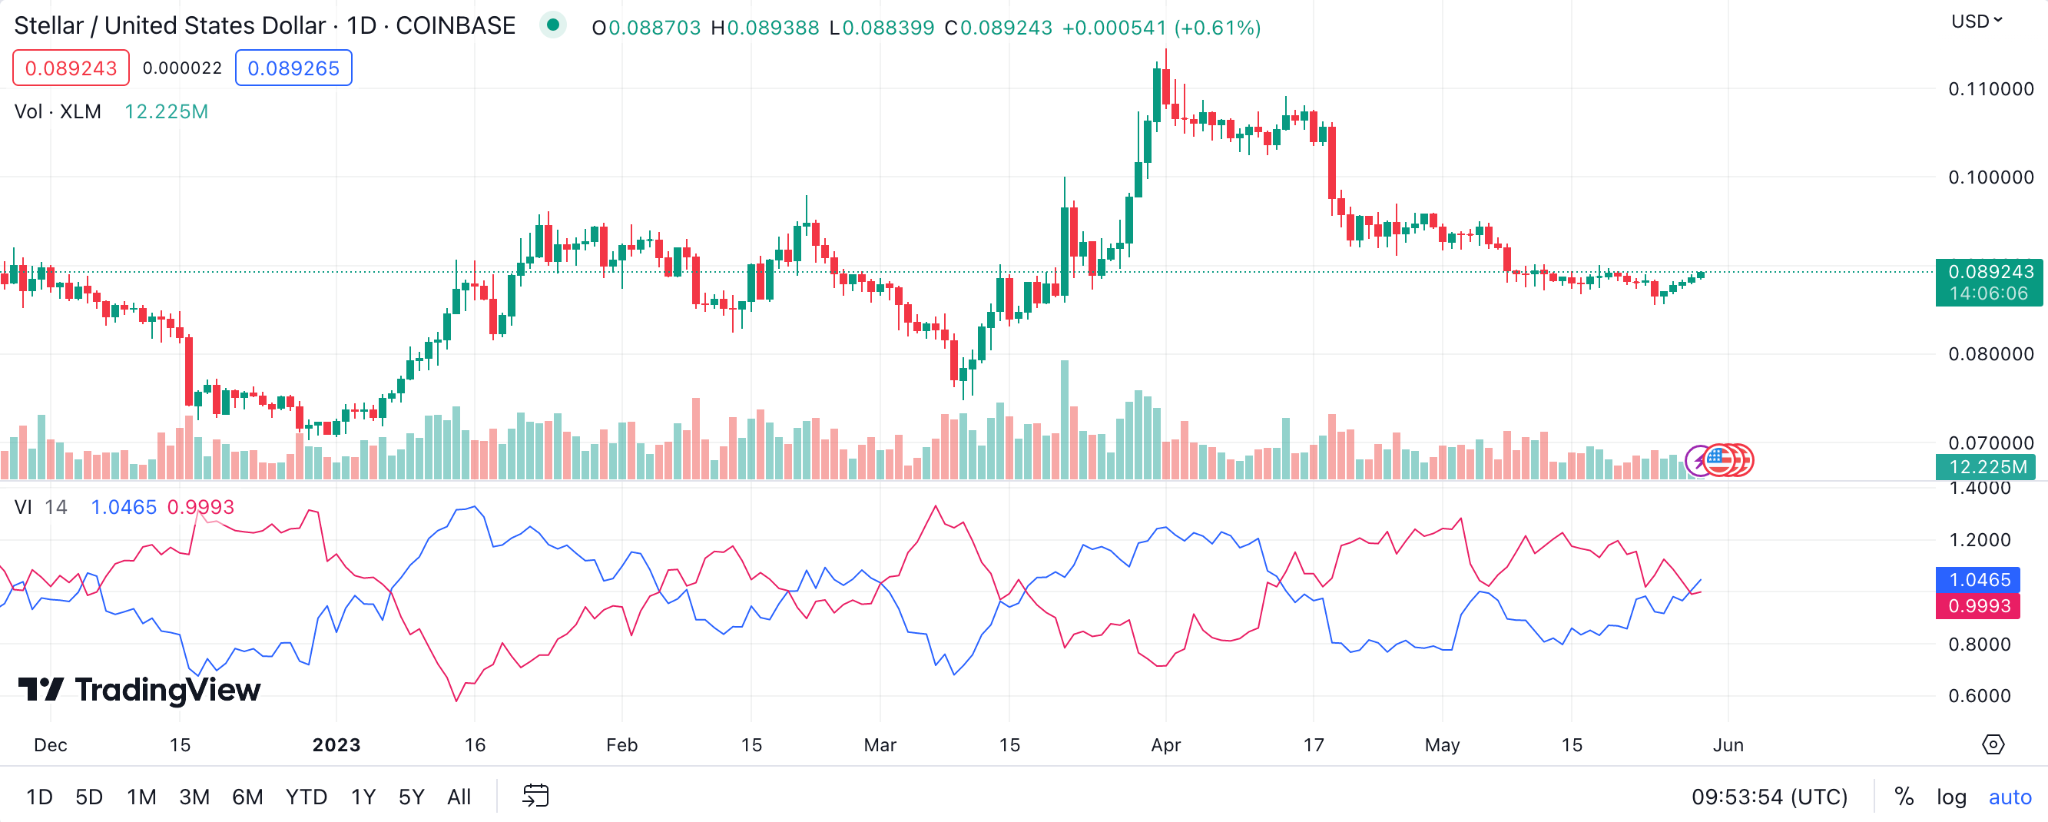
Example: When the VI+ crosses above VI-, it may signal the start of an uptrend for XLM price, and potentially a buying opportunity. Conversely, when VI- crosses above VI+, it could indicate the start of a downtrend, and perhaps a good time to sell.
Elder’s Force Index (EFI) for Stellar Price Prediction
Elder’s Force Index (EFI) is an oscillator that uses price and trading volume to measure the power behind a move or to reinforce a trend. The EFI can help in both identifying potential reversals and trend continuations for Stellar Lumens.
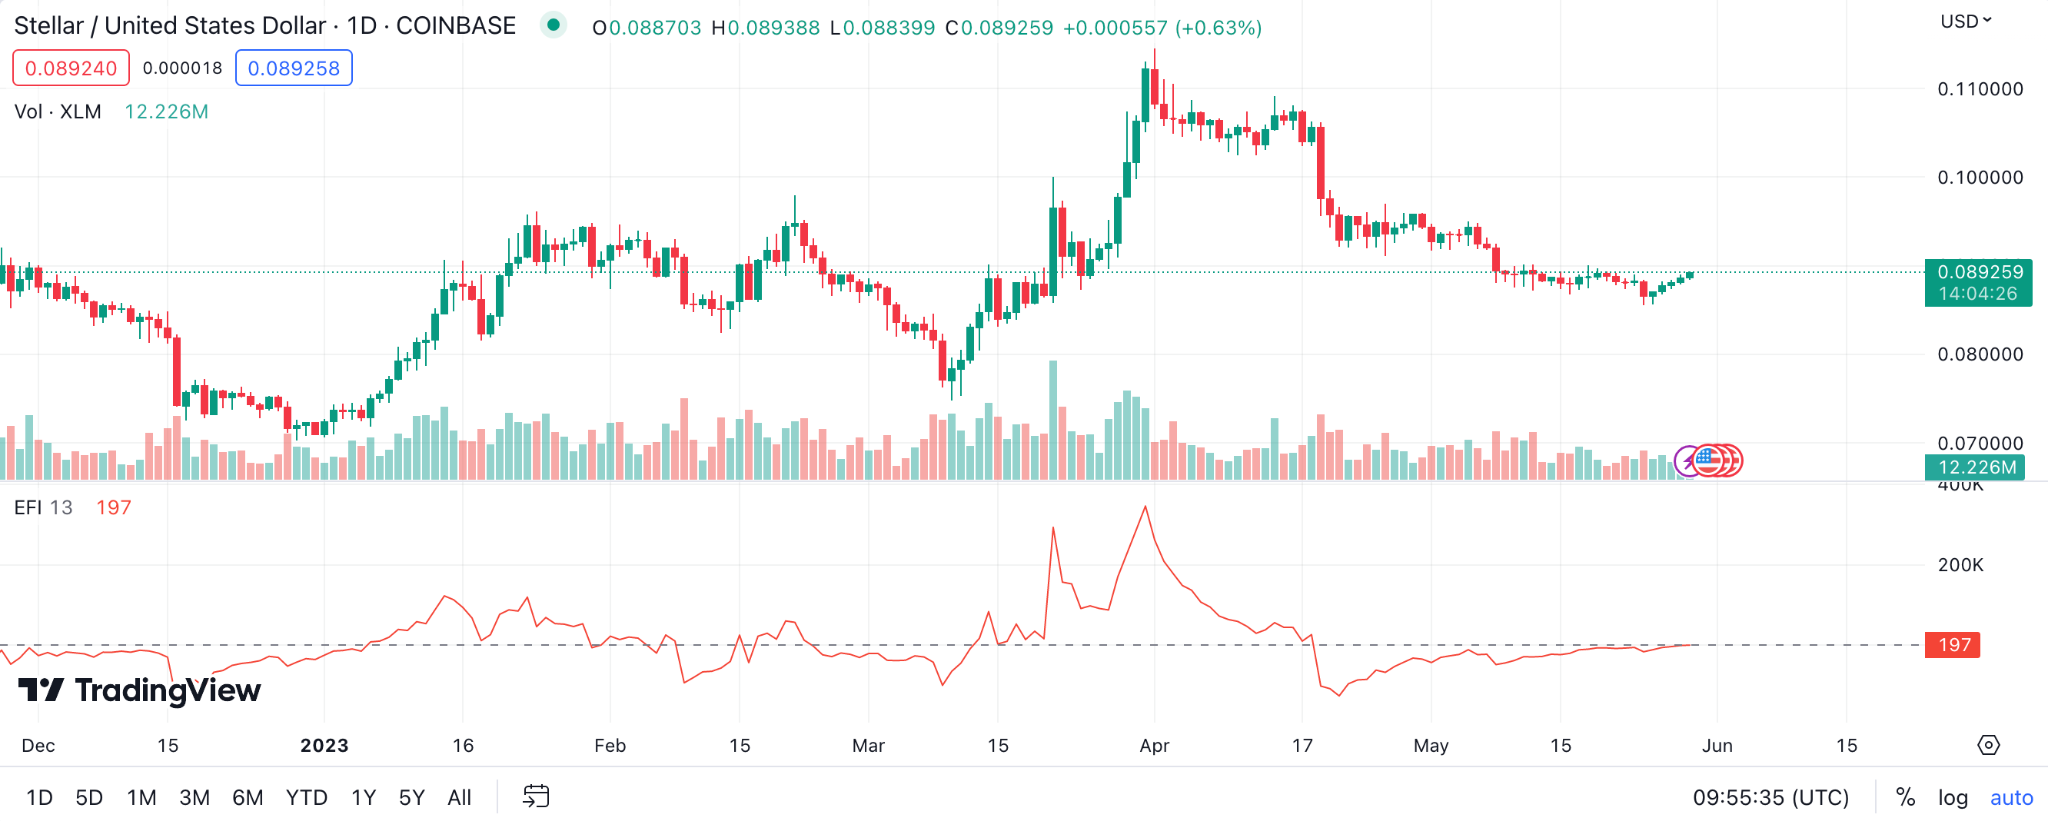
Example: If EFI rises while Stellar’s price falls, it might suggest that the bearish trend is losing its force, hinting at a potential bullish reversal. Similarly, if EFI falls while the price rises, it may indicate that the bullish trend is weakening, signaling a potential bearish reversal.
Williams %R for Stellar Price Prediction
Williams %R, named after its developer Larry Williams, is a momentum indicator that moves between 0 and -100 and measures overbought and oversold levels.
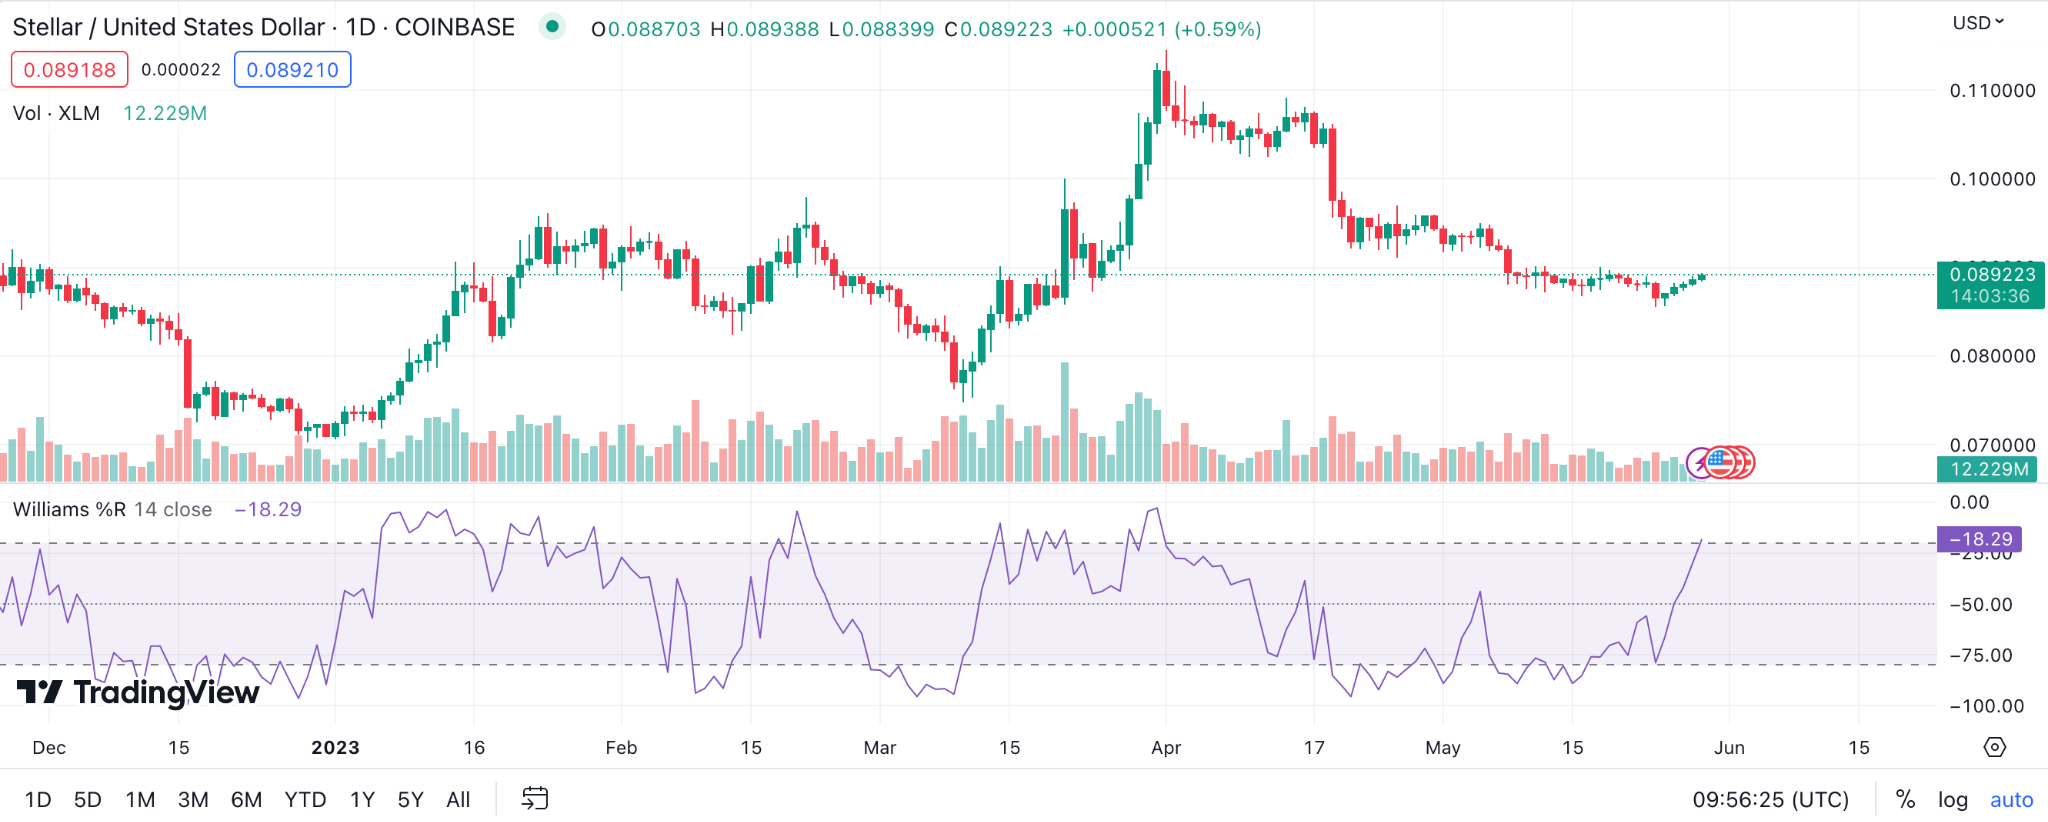
Example: If the Williams %R value is above -20, it generally indicates that Stellar Lumens might be overbought and could be due for a price drop. Conversely, a reading below -80 might suggest that Stellar is oversold and could be due for a price rise.
Combining Technical Indicators for Accurate Stellar Price Predictions
In my two-decade journey in cryptocurrency analysis, I’ve often been asked, “What’s the secret to accurate price prediction?” Honestly, there’s no magic wand. But what I can tell you is that using a combination of technical indicators can significantly increase your predictive accuracy. Let’s delve into this, shall we?
The Importance of Using Multiple Technical Indicators for XLM Price Predictions
So, why use multiple technical indicators? Well, it’s a bit like getting a second opinion when you’re not feeling well. One indicator can show a potential buy signal, while another might indicate it’s time to sell. When multiple indicators confirm the same signal, it increases the likelihood that the signal is accurate.
Consider each technical indicator as a piece of the puzzle that is Stellar’s market behavior. One piece alone doesn’t show the whole picture, but put several together, and you’ll start to see a clearer image. Each indicator can highlight different market conditions, whether that be trend direction, momentum, volatility, or current sentiment. So, by using multiple indicators, we’re essentially covering all bases.
How to Combine Various Indicators for Stellar Price Predictions
Now, how do we effectively combine these indicators for a comprehensive analysis of Stellar XLM’s price? Here are some tips:
- Use indicators that complement each other: Since each indicator provides different information, choose indicators that complement rather than duplicate each other. For instance, you might use a trend indicator like moving averages alongside a momentum indicator like the Relative Strength Index (RSI).
- Don’t overload your charts: While using multiple indicators can provide valuable insight, overloading your charts can lead to confusion and contradictory signals. Stick to a few key indicators that provide the insights you need.
- Understand what each indicator tells you: It’s not enough to simply add indicators to your charts; understanding what each indicator is telling you is critical.
- Test different combinations: Different combinations of indicators may work better in different market conditions. Test out different combinations to see what works best for you.
- Respect the market: No matter how many indicators you use, remember that the market is king. Indicators can provide signals, but they don’t guarantee results.
By thoughtfully combining technical indicators, you can gain a more comprehensive view of Stellar’s price behavior, enhancing your ability to make informed trading decisions. The aim is to build a well-rounded view of the market, where one indicator’s weakness is compensated by another’s strength. Remember, it’s not about finding the perfect indicator; it’s about finding the perfect combination.
The Pillars of Stellar Price Prediction: Fundamental Factors
When predicting the direction of Stellar network, or any cryptocurrency for that matter, one cannot overlook the importance of fundamental factors. These are the key elements that determine the health and future prospects of a cryptocurrency. Below are some crucial fundamental factors that impact Stellar XLM price today.
Adoption Rate
Adoption rate is a fundamental aspect of any currency, digital or otherwise. The more widely accepted and used a currency is, the more valuable it becomes. When it comes to Stellar Lumens, we need to look at various indicators to evaluate its adoption rate:
- Transaction Volume: The transaction volume, or the total amount of Stellar XLM changing hands daily, can shed light on the activity level of the Stellar network. Higher transaction volumes can point to greater adoption and increased trust in the currency.
- Partnerships: Partnerships are an excellent indicator of adoption. When prominent businesses or organizations partner with Stellar Lumens and begin to use XLM for transactions, it not only increases adoption but also enhances Stellar’s credibility and visibility.
- Accessibility: How easy is it for people to buy and use Stellar XLM? The easier it is to access and use, the greater the adoption. Cryptocurrency exchanges, ATMs, and other platforms offering XLM contribute to its accessibility.
- Retail Adoption: Are there retailers or service providers accepting Stellar XLM as a payment method? Greater retail adoption implies that more businesses are recognizing the utility of Stellar, which in turn can boost its price.
- Network Growth: An increase in the number of active addresses on the Stellar network can suggest growing adoption. As more individuals and organizations start using Stellar Lumens, the network grows, which potentially enhances the current price of Stellar.
Regulatory Developments
The regulatory environment surrounding cryptocurrencies can significantly impact their price, including that of Stellar Lumens. Changes in regulations, either positive or negative, can cause substantial price fluctuations. Here are a few examples of regulatory changes and their potential impact on the Stellar XLM’s price:
- Country-Specific Regulations: New cryptocurrency regulations in a significant economy, such as the United States or China, can cause price movements in Stellar XLM. For instance, more restrictive regulations can stifle growth, while supportive policies can boost prices.
- KYC/AML Laws: Tightening or easing of Know Your Customer (KYC) and Anti-Money Laundering (AML) laws can influence the ease of trading and thereby the current price of Stellar. Stricter regulations might deter new investors, while more relaxed laws could encourage participation.
- SEC Decisions: The US Securities and Exchange Commission (SEC) wields a lot of influence over cryptocurrencies. Their decisions, whether regarding the status of cryptocurrencies or the approval of crypto-based investment vehicles like ETFs, can greatly impact Stellar XLM’s price.
- Tax Laws: Alterations to how cryptocurrencies are taxed could also sway Stellar XLM prices. More favorable tax treatments could encourage more investment in Stellar XLM and vice versa.
- Legal Recognition: Legal recognition of cryptocurrencies by more countries, whether as a form of digital asset or as legal tender, could significantly boost Stellar XLM’s price.
Utility
Utility refers to the practical uses of a cryptocurrency. Stellar Lumens has several compelling use cases that extend beyond being a digital asset. Here are some of the real-world applications of Stellar network:
- Cross-Border Payments: Stellar Lumens was designed for fast and low-cost international transfers, making it an attractive choice for businesses and individuals making cross-border transactions.
- Microtransactions: Stellar’s minimal transaction fees make it viable for small transactions, opening up possibilities in industries like gaming or content creation.
- Token Issuance: Stellar’s network allows for the issuance of custom tokens, making it a platform for organizations wanting to launch their own digital assets or stablecoins.
- Smart Contracts: Though not as extensive as Ethereum, Stellar network does support simpler smart contracts, which could be used in automated, trustless currency transactions.
- Mobile Money Platforms: Stellar blockchain has partnered with various mobile money platforms, especially in developing nations, enabling cheap and efficient money transfers for the unbanked population.
Market Sentiment: How Stellar Lumens Price Prediction Works
Market sentiment plays a substantial role in the price movement of any cryptocurrency. It refers to the overall attitude of investors toward a particular asset. Several factors and tools are used to gauge the current sentiment for Stellar blockchain:
- News Reports: Major news events related to Stellar Lumens can drastically affect market sentiment. For example, partnership announcements or major upgrades can positively impact sentiment.
- Social Media: Platforms like Twitter and Reddit are often used to gauge the mood of the cryptocurrency community. An increase in positive mentions for Stellar Lumens network could indicate bullish sentiment.
- Sentiment Analysis Tools: Various online tools use AI to analyze crypto market sentiment by scanning news articles, social media posts, and more. These tools can provide a sentiment score for Stellar blockchain, indicating whether the overall sentiment is bullish or bearish.
- Market Surveys: Surveys conducted among investors and traders can give insights into the prevailing market sentiment towards Stellar network.
- Price Trends: Often, the price trend of a cryptocurrency itself is a good indicator of market sentiment. Rising prices tend to indicate positive sentiment, while falling prices can signify negative sentiment.
By understanding these fundamental factors, you can gain a more holistic view of Stellar Lumens and its potential price movements. Always remember, however, that cryptocurrency investments come with risks and it’s crucial to do thorough research and consider multiple factors before making any investment decisions.
The Bottom Line: Making Your Own Stellar Lumens Price Predictions
Well, we’ve covered a lot of ground here. By now, you should have a better understanding of the factors that influence Stellar’s price and how to use that knowledge to make your own predictions.
Remember, though, that predicting the price of Stellar Lumens (or any asset, for that matter) is never a surefire thing. There’s always a degree of uncertainty and risk involved.
FAQ
When Will XLM Price Go Up?
Ah, the million-dollar question! It’s hard to predict exactly when Stellar Lumens will rise. As with all cryptocurrencies, Stellar XLM’s price is influenced by many factors, such as market sentiment, technological developments, overall adoption, and external market conditions. Although historical data can provide some insights, no one can predict future prices with absolute certainty. My advice? Keep a close eye on Stellar’s fundamental and technical indicators.
Should I Buy Stellar?
Well, that depends on several factors. Are you comfortable with risk? Do you believe in Stellar’s mission and use case? Have you done your own research? Investing in cryptocurrencies like XLM can potentially offer high rewards, but they also come with high risk due to their volatility. Remember, never invest more than you’re willing to lose and always do your own research or consult with a financial advisor before making investment decisions.
How High Can XLM Price Go?
Given Stellar’s potential in revolutionizing cross-border transactions and the increasing adoption of blockchain technology, it’s not unreasonable to imagine that the price of Stellar Lumens could experience substantial growth in the future. However, predicting an exact price is practically impossible. Many factors, such as crypto market trends, global economic conditions, and regulatory developments, could influence Stellar’s price potential.
Will XLM Price Crash Again in 2024?
Cryptocurrencies are known for their volatility, and Stellar network is no exception. It’s certainly possible that Stellar XLM could experience a price drop in 2024, just as it’s possible for it to see a significant rise. It all depends on the dynamics of the Stellar market, investor sentiment, and several other factors. But remember, every investment comes with risks, and it’s crucial to manage these risks by diversifying your portfolio and not investing money you can’t afford to lose.