Solana Price Prediction:
Detailed SOL Price Forecast

Time to read: 10 min
The virtual currency sector has evolved rapidly over the past few years, emerging as one of the most promising projects in the blockchain space. As interest in digital assets continues to grow, many investors seek insights into Solana price prediction and a detailed SOL price forecast that considers both transitory and protracted trends. This article delves into the intricate details of Solana, offering a comprehensive exploration and predictions for its future value trajectory.
What is Solana SOL?
It is a high-performance blockchain platform providing fast, secure, scalable decentralized applications (dApps) and crypto assets. The network's native cryptocurrency has gained significant attention for its ability to process thousands of transactions per second at low costs, making it a strong competitor in the cryptocurrency market. The platform's unique architecture, which includes a proof-of-history (PoH) consensus mechanism, sets it apart from other cryptos.
Solana Technical Analysis
Understanding technical analysis is crucial for predicting its future performance. The tech examination of SOL price involves evaluating its past value movements, trading volumes, and existing trends. In terms of these factors, traders can identify potential price targets. The 24-hour average price is a critical tool in this research, helping to smooth out value data and provide a clearer picture of SOL's price direction. By focusing on the average Solana price over various time frames, we can gain insights into possible trends and reversals.
Why Investing in Solana SOL?
Investing in Solana offers several compelling reasons. The SOL coin value has shown considerable growth potential, driven by the growing adoption in the cryptocurrency market. Its ability to handle a high volume of transactions with minimal fees makes it an attractive option. Moreover, Solana prices have demonstrated resilience, even in volatile digital conditions of the crypto space.
SOL Price Overview
The SOL price has experienced significant fluctuations, reflecting the broader volatility of the cryptocurrency market. However, the average Solana price has generally trended upward. Let us review the key factors influencing SOL price. By analyzing, we can better understand the forces driving its prices movements.
Solana Prediction Based on Performance Data
Solana's past performance data provides valuable insights for making accurate price predictions. By analyzing the average price movements over time, along with the day average price, you can gauge the likelihood of future prices trends. This section delves into Solana's historical data. Here, performance data is a critical component of any Solana price forecast.
Solana SOL 30 Days Historical Price Data
Solana's one-month historical value data can offer a snapshot of recent digital currency day moving average activity. This period often reveals the impact of recent news, sentiment, and other external factors on the SOL price. Traders can make informed decisions by analyzing the price average index and average price movements during this timeframe. Its prices performance over the past month highlights fundamental value movements and their potential implications for future Solana by crypto forecasts.
Anticipated SOL Value Movements by Crypto Analytical Media
Crypto analytical media outlets play a crucial role in shaping sentiment of cryptocurrencies, virtual currency values and providing day moving average crypto value movements. These platforms often combine research on cryptocurrencies and expert opinions. Investors can gain a broader perspective on its potential future price average value. This section summarizes the predictions made by leading crypto media, highlighting the consensus on crypto SOL's future value trajectory.
- WalletInvestor
WalletInvestor provides a somewhat cautious outlook for Solana, focusing on the inherent volatility and risks associated with the cryptocurrencies. Their predictive crypto models often emphasize fleeting fluctuations of prices, suggesting that while Solana may experience significant day moving average price increases, there is also a substantial risk of prices downturns. The layout incorporates the moving averages and historical value patterns to project possible future movements. However, they often highlight the potential for sharp declines in day moving average indicators alongside potential gains.
- TradingBeast
TradingBeast offers a more balanced and systematic approach to its value prognosis. Their prognostications reflect the uncertainty in the cryptocurrency sector. TradingBeast's overview is generally forward-looking, focusing on day moving average tools. They often predict moderate value increases for Solana, making their predictions appealing to investors looking for a more measured approach to the cryptocurrency.
- PricePrediction
PricePrediction offers an optimistic view on Solana. Their investigation typically projects substantial value increases over the coming years and its position within the broader cryptocurrency ecosystem. The online media models often emphasize the importance of sustained upward momentum in SOL’s price. Their prognostications are particularly attractive to investors with a bullish outlook on the future of blockchain technology.
- CoinEdition
CoinEdition’s approach to its value prognosis blends tech review with broader cryptocurrency sentiment. It often emphasizes the role of external factors in shaping price movements. CoinEdition's predictions are generally grounded in the context of current cryptocurrency conditions.
- Coinpedia
Their investigation tends to be bullish, reflecting confidence in its ability to maintain its competitive edge in the cryptocurrency ecosystem. Coinpedia frequently discusses the impact of upcoming technological developments and partnerships on its price. Their prognostications are often forward-looking, projecting steady growth in SOL’s price,
- CoinCodex
CoinCodex uses historical data, technical indicators, and cryptocurrency sentiment. Their research covers various time horizons, from brief price movements to continued prognostications. CoinCodex often highlights the importance of cryptocurrency cycles and external factors in influencing its price. Their predictions are usually conservative, emphasizing the importance of risk management and the potential for binary movements in SOL’s price.
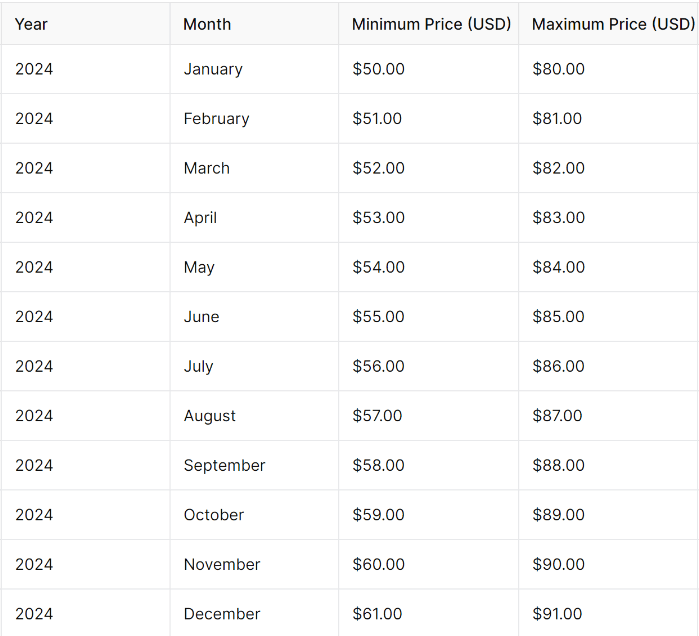
Solana Price Prediction 2024
Looking ahead to 2024, its value prognosis is influenced by several critical factors, including technological advancements, DLT adoption, and broader economic trends. The average Solana price is expected to continue its upward trajectory. However, digital volatility remains a significant risk, and investors should be prepared for potential fluctuations in SOL price. This section provides a detailed vaticination for its price in 2024.
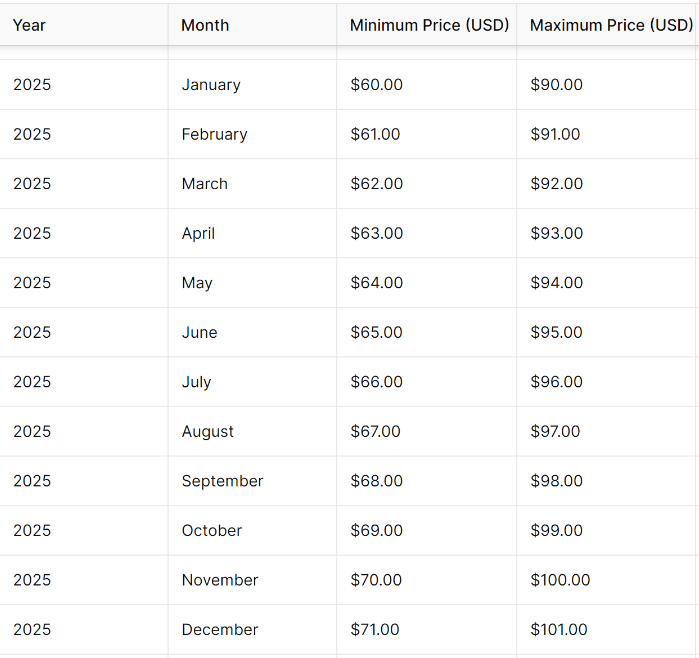
Solana Price Prediction 2025
By 2025, its price could see substantial growth. The average price of SOL is expected to benefit from continued technological innovation and increased adoption of dApps. However, digital dynamics, such as competition from other virtual currencies, could impact the value changes. By exploring the potential scenarios for its price in 2025, one can find a range of prognostications based on different virtual currency conditions.
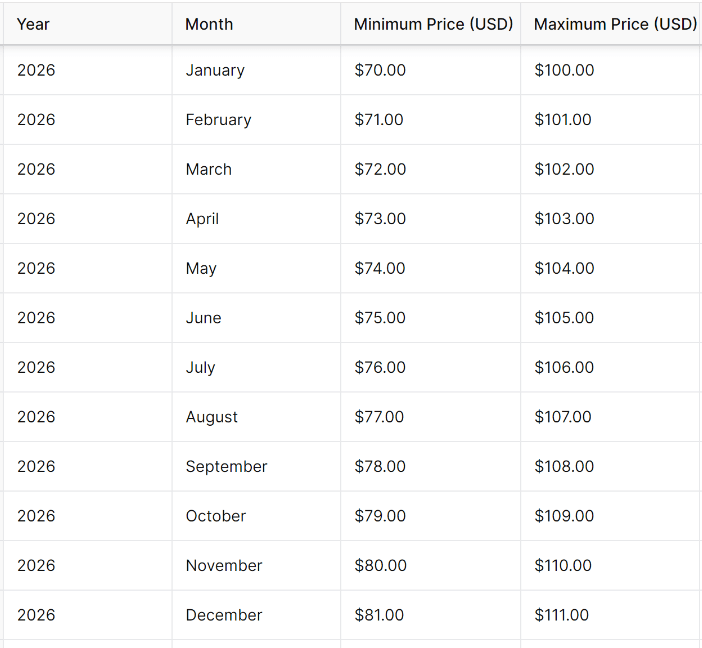
Solana Price Prediction 2026
The Solana price prediction for 2026 hinges on the platform's ability to maintain its competitive edge in the rapidly evolving blockchain space. With more projects being built on Solana, the demand for SOL will likely increase, driving up the average price. However, we may see increased volatility, with SOL evaluation subject to broader trends and investor sentiment. Detailed research can elaborate on the factors that could influence its price in 2026, along with a vaticination based on current performance data.
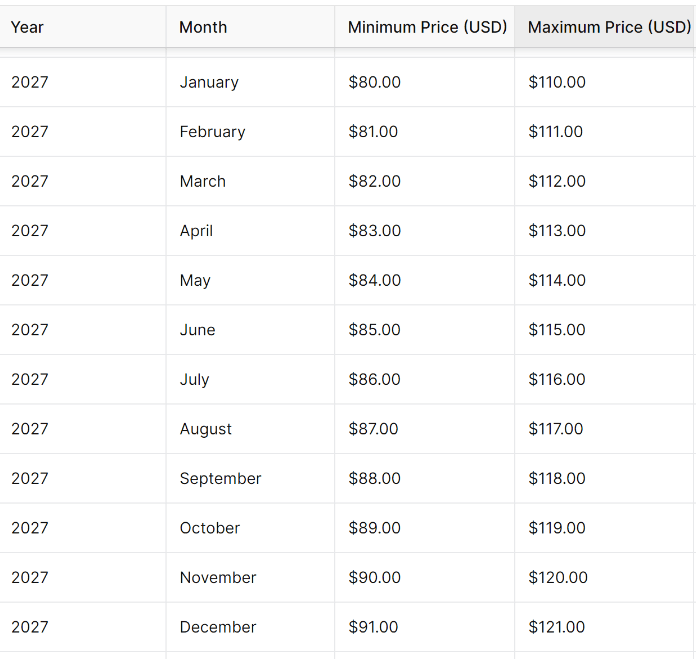
Solana Price Prediction 2027
As we approach 2027, the protracted outlook for Solana becomes increasingly relevant. By this point, the platform's ecosystem could be well-established, with SOL evaluation reflecting its current position. The average Solana price is likely to be influenced by ongoing developments in the financial sector, including the adoption of blockchain technology in various industries. This offers a vaticination for its price in 2027, considering both the potential for growth and the risks associated with elongated investments.
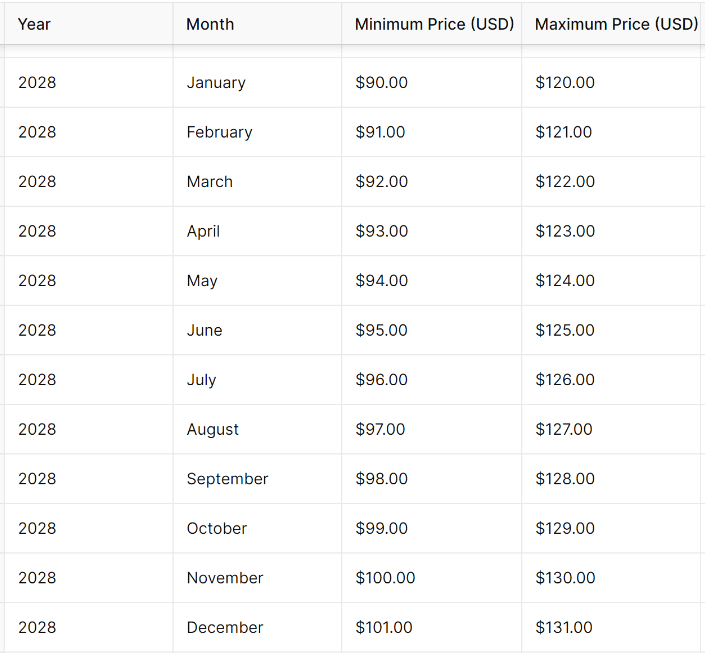
Solana Price Prediction 2028
In 2028, its price is expected to continue its upward trajectory, driven by increased adoption and technological advancements. The average price of SOL could benefit from the platform's expanding ecosystem and the broader growth of the digitalized sector. However, investors should also consider the potential for price average value corrections and other risks that could impact SOL evaluation. This section provides a detailed prognostication for its price in 2028 based on current trends and expert exploration.
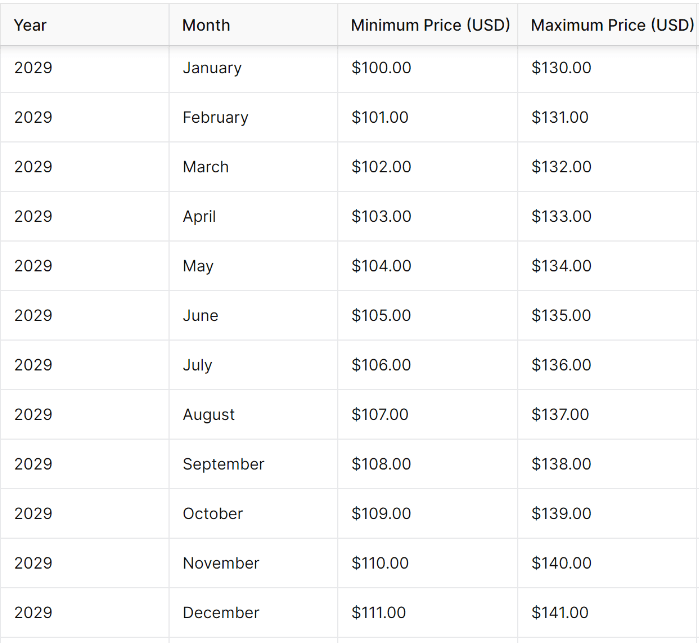
Solana Price Prediction 2029
By 2029, Solana's price could reach new highs, supported by the platform's continued growth and adoption. The typical SOL value is likely to reflect the increasing demand for decentralized applications and blockchain-based solutions. However, the digital field is inherently volatile, and SOL prices could be subject to significant fluctuations. This section explores the potential value changes for Solana in 2029, considering both the opportunities and risks associated with continued investments.
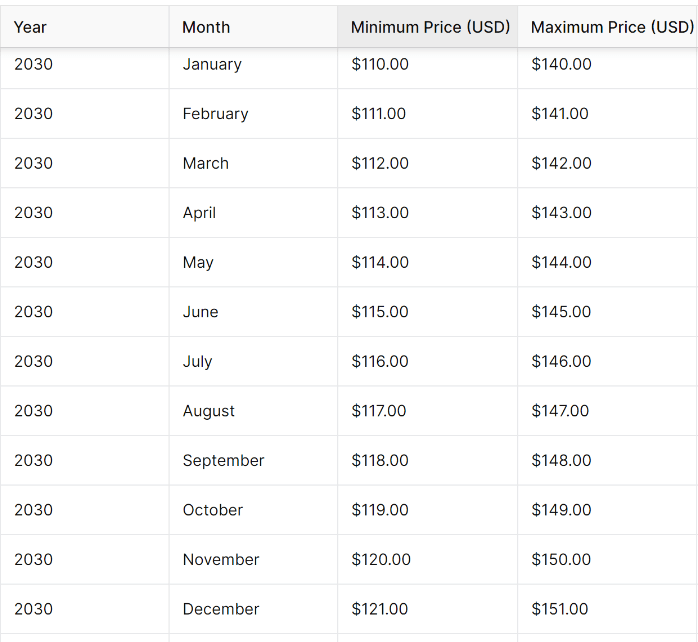
Solana Price Prediction 2030
The Solana price prediction for 2030 is a topic of significant interest among investors, as the platform is expected to play a major role in the future of blockchain technology. The average price of SOL could be influenced by a variety of factors, including technological advancements, demand, and broader economic trends. This section provides a detailed prognostication for Solana's price in 2030, offering insights into the potential price trajectory and the factors that could impact its value.
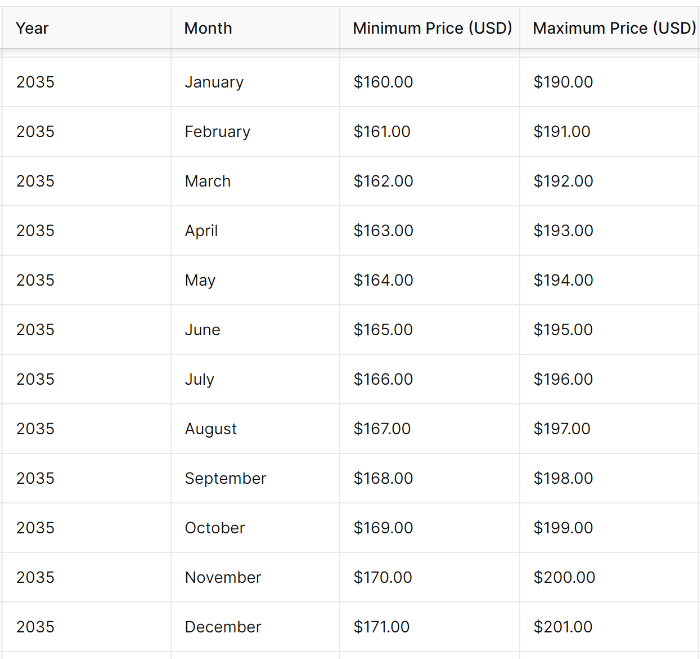
Solana Price Prediction 2035
Looking further ahead to 2035, Solana's price prognostication becomes more speculative, but the platform's linear potential remains strong. By this point, the typical SOL value could be significantly bigger, reflecting the platform's continued growth and adoption. However, the virtual currency sector is subject to rapid changes, and linear prognostication should be viewed with caution. This section offers a potential value prognosis for Solana in 2035, considering the factors that could influence its value over the next decade.
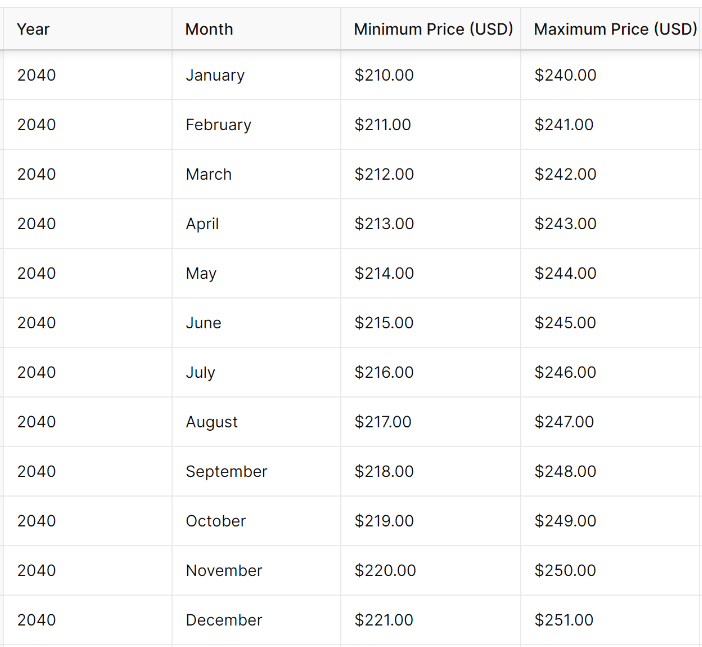
Solana Price Forecast 2040
In 2040, Solana's price could be shaped by the broader adoption of blockchain technology and the continued evolution of the digital sector. The average price of SOL is likely to be influenced by a combination of technological advancements, demand, and regulatory developments. This section provides a prognostication for Solana's price in 2040, offering insights into the overall potential of the platform and the factors that could impact its value.
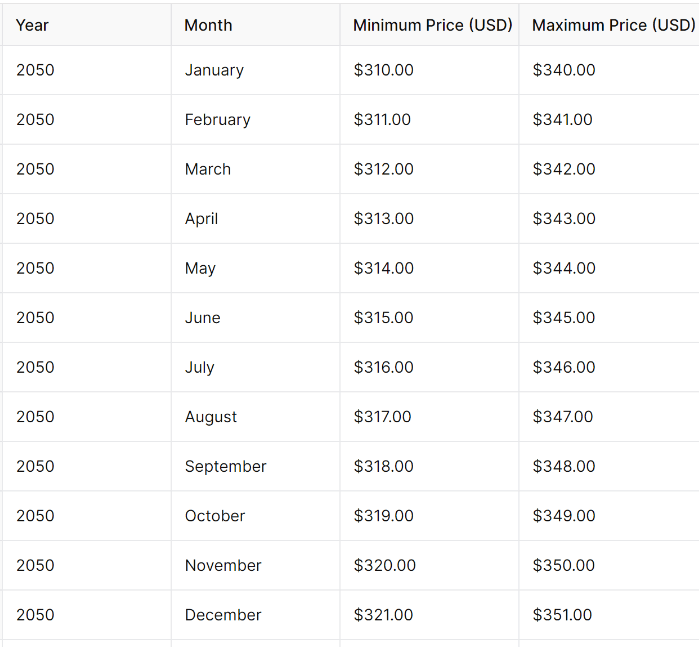
Solana Price Forecast 2050
By 2050, Solana's price prognostication becomes highly speculative, but the platform's potential to drive innovation in the blockchain space remains a key consideration. The average price of SOL could be significantly bigger, reflecting decades of growth and adoption in the digital sector. However, protracted forecasts should be cautiously approached, as the digital finance world will likely undergo significant changes over the coming decades. This section explores the potential price average trajectory for Solana in 2050, offering insights into the continued prospects of the platform.
Estimated Anticipations
The estimated SOL price prognostication combines insights from historical data, technical analysis, and expert opinions to provide a comprehensive outlook for Solana's future value. Examining the average prices and key virtual currency trends, this section offers a detailed estimate of Solana's price average trajectory over the coming years. Investors should consider these forecasts as part of their broader investment strategy, considering the digitalized universe's inherent volatility.
Solana SOL Price Prediction 2024 - 2030
The period from 2024 to 2030 is expected to be crucial for Solana's growth (SOL coin price), with the average price likely to increase as the platform expands its ecosystem. During this time, Solana's innovative technology and scalability will play a significant role in its performance and Solana price fluctuations. It suggests that the platform could reach new highs, driven by sustained demand and technological advancements.
Solana SOL Price Prediction 2030 - 2050
Looking further ahead, the price prediction for 2030 to 2050 reflects a protracted view of the platform's potential. Over these two decades, Solana could experience significant growth, positioning itself as a leading blockchain network in the digital currency sector. The average price during this period is expected to increase as the platform's technology matures and its adoption widens. However, the long-term average price prognostication also accounts for the potential challenges, including competition from other virtual currencies and regulatory developments, which could influence SOL price.
Conclusion
It has established itself as a powerful player in the cryptocurrency space, offering a high-performance blockchain platform that continues to attract significant attention from developers, investors, and users. The analysis outlined in this article provides a comprehensive overview of the potential future value based on a detailed analysis of trends, historical data, and expert insights. While the fintech sector is inherently volatile, Solana's innovative technology and growing adoption suggest it may achieve substantial growth in the coming years. Investors should consider both the opportunities and risks when making their investment decisions, considering the long-term potential of this dynamic and rapidly evolving platform.

FAQ
Similar guides
Solana Price History:
Understanding the Highs and Lows
Roman Klochko
Aug 29, 2024
Anatoly Yakovenko:
The Visionary Solana Founder Revolutionizing Digital Space
Roman Klochko
Aug 29, 2024
Exploring Solana ETFs:
A New Frontier in Crypto Universe
Roman Klochko
Aug 29, 2024
The virtual currency sector has evolved rapidly over the past few years, emerging as one of the most promising projects in the blockchain space. As interest in digital assets continues to grow, many investors seek insights into Solana price prediction and a detailed SOL price forecast that considers both transitory and protracted trends. This article delves into the intricate details of Solana, offering a comprehensive exploration and predictions for its future value trajectory.
What is Solana SOL?
It is a high-performance blockchain platform providing fast, secure, scalable decentralized applications (dApps) and crypto assets. The network's native cryptocurrency has gained significant attention for its ability to process thousands of transactions per second at low costs, making it a strong competitor in the cryptocurrency market. The platform's unique architecture, which includes a proof-of-history (PoH) consensus mechanism, sets it apart from other cryptos.
Solana Technical Analysis
Understanding technical analysis is crucial for predicting its future performance. The tech examination of SOL price involves evaluating its past value movements, trading volumes, and existing trends. In terms of these factors, traders can identify potential price targets. The 24-hour average price is a critical tool in this research, helping to smooth out value data and provide a clearer picture of SOL's price direction. By focusing on the average Solana price over various time frames, we can gain insights into possible trends and reversals.
Why Investing in Solana SOL?
Investing in Solana offers several compelling reasons. The SOL coin value has shown considerable growth potential, driven by the growing adoption in the cryptocurrency market. Its ability to handle a high volume of transactions with minimal fees makes it an attractive option. Moreover, Solana prices have demonstrated resilience, even in volatile digital conditions of the crypto space.
SOL Price Overview
The SOL price has experienced significant fluctuations, reflecting the broader volatility of the cryptocurrency market. However, the average Solana price has generally trended upward. Let us review the key factors influencing SOL price. By analyzing, we can better understand the forces driving its prices movements.
Solana Prediction Based on Performance Data
Solana's past performance data provides valuable insights for making accurate price predictions. By analyzing the average price movements over time, along with the day average price, you can gauge the likelihood of future prices trends. This section delves into Solana's historical data. Here, performance data is a critical component of any Solana price forecast.
Solana SOL 30 Days Historical Price Data
Solana's one-month historical value data can offer a snapshot of recent digital currency day moving average activity. This period often reveals the impact of recent news, sentiment, and other external factors on the SOL price. Traders can make informed decisions by analyzing the price average index and average price movements during this timeframe. Its prices performance over the past month highlights fundamental value movements and their potential implications for future Solana by crypto forecasts.
Anticipated SOL Value Movements by Crypto Analytical Media
Crypto analytical media outlets play a crucial role in shaping sentiment of cryptocurrencies, virtual currency values and providing day moving average crypto value movements. These platforms often combine research on cryptocurrencies and expert opinions. Investors can gain a broader perspective on its potential future price average value. This section summarizes the predictions made by leading crypto media, highlighting the consensus on crypto SOL's future value trajectory.
- WalletInvestor
WalletInvestor provides a somewhat cautious outlook for Solana, focusing on the inherent volatility and risks associated with the cryptocurrencies. Their predictive crypto models often emphasize fleeting fluctuations of prices, suggesting that while Solana may experience significant day moving average price increases, there is also a substantial risk of prices downturns. The layout incorporates the moving averages and historical value patterns to project possible future movements. However, they often highlight the potential for sharp declines in day moving average indicators alongside potential gains.
- TradingBeast
TradingBeast offers a more balanced and systematic approach to its value prognosis. Their prognostications reflect the uncertainty in the cryptocurrency sector. TradingBeast's overview is generally forward-looking, focusing on day moving average tools. They often predict moderate value increases for Solana, making their predictions appealing to investors looking for a more measured approach to the cryptocurrency.
- PricePrediction
PricePrediction offers an optimistic view on Solana. Their investigation typically projects substantial value increases over the coming years and its position within the broader cryptocurrency ecosystem. The online media models often emphasize the importance of sustained upward momentum in SOL’s price. Their prognostications are particularly attractive to investors with a bullish outlook on the future of blockchain technology.
- CoinEdition
CoinEdition’s approach to its value prognosis blends tech review with broader cryptocurrency sentiment. It often emphasizes the role of external factors in shaping price movements. CoinEdition's predictions are generally grounded in the context of current cryptocurrency conditions.
- Coinpedia
Their investigation tends to be bullish, reflecting confidence in its ability to maintain its competitive edge in the cryptocurrency ecosystem. Coinpedia frequently discusses the impact of upcoming technological developments and partnerships on its price. Their prognostications are often forward-looking, projecting steady growth in SOL’s price,
- CoinCodex
CoinCodex uses historical data, technical indicators, and cryptocurrency sentiment. Their research covers various time horizons, from brief price movements to continued prognostications. CoinCodex often highlights the importance of cryptocurrency cycles and external factors in influencing its price. Their predictions are usually conservative, emphasizing the importance of risk management and the potential for binary movements in SOL’s price.
Solana Price Prediction 2024
Looking ahead to 2024, its value prognosis is influenced by several critical factors, including technological advancements, DLT adoption, and broader economic trends. The average Solana price is expected to continue its upward trajectory. However, digital volatility remains a significant risk, and investors should be prepared for potential fluctuations in SOL price. This section provides a detailed vaticination for its price in 2024.
Solana Price Prediction 2025
By 2025, its price could see substantial growth. The average price of SOL is expected to benefit from continued technological innovation and increased adoption of dApps. However, digital dynamics, such as competition from other virtual currencies, could impact the value changes. By exploring the potential scenarios for its price in 2025, one can find a range of prognostications based on different virtual currency conditions.
Solana Price Prediction 2026
The Solana price prediction for 2026 hinges on the platform's ability to maintain its competitive edge in the rapidly evolving blockchain space. With more projects being built on Solana, the demand for SOL will likely increase, driving up the average price. However, we may see increased volatility, with SOL evaluation subject to broader trends and investor sentiment. Detailed research can elaborate on the factors that could influence its price in 2026, along with a vaticination based on current performance data.
Solana Price Prediction 2027
As we approach 2027, the protracted outlook for Solana becomes increasingly relevant. By this point, the platform's ecosystem could be well-established, with SOL evaluation reflecting its current position. The average Solana price is likely to be influenced by ongoing developments in the financial sector, including the adoption of blockchain technology in various industries. This offers a vaticination for its price in 2027, considering both the potential for growth and the risks associated with elongated investments.
Solana Price Prediction 2028
In 2028, its price is expected to continue its upward trajectory, driven by increased adoption and technological advancements. The average price of SOL could benefit from the platform's expanding ecosystem and the broader growth of the digitalized sector. However, investors should also consider the potential for price average value corrections and other risks that could impact SOL evaluation. This section provides a detailed prognostication for its price in 2028 based on current trends and expert exploration.
Solana Price Prediction 2029
By 2029, Solana's price could reach new highs, supported by the platform's continued growth and adoption. The typical SOL value is likely to reflect the increasing demand for decentralized applications and blockchain-based solutions. However, the digital field is inherently volatile, and SOL prices could be subject to significant fluctuations. This section explores the potential value changes for Solana in 2029, considering both the opportunities and risks associated with continued investments.
Solana Price Prediction 2030
The Solana price prediction for 2030 is a topic of significant interest among investors, as the platform is expected to play a major role in the future of blockchain technology. The average price of SOL could be influenced by a variety of factors, including technological advancements, demand, and broader economic trends. This section provides a detailed prognostication for Solana's price in 2030, offering insights into the potential price trajectory and the factors that could impact its value.
Solana Price Prediction 2035
Looking further ahead to 2035, Solana's price prognostication becomes more speculative, but the platform's linear potential remains strong. By this point, the typical SOL value could be significantly bigger, reflecting the platform's continued growth and adoption. However, the virtual currency sector is subject to rapid changes, and linear prognostication should be viewed with caution. This section offers a potential value prognosis for Solana in 2035, considering the factors that could influence its value over the next decade.
Solana Price Forecast 2040
In 2040, Solana's price could be shaped by the broader adoption of blockchain technology and the continued evolution of the digital sector. The average price of SOL is likely to be influenced by a combination of technological advancements, demand, and regulatory developments. This section provides a prognostication for Solana's price in 2040, offering insights into the overall potential of the platform and the factors that could impact its value.
Solana Price Forecast 2050
By 2050, Solana's price prognostication becomes highly speculative, but the platform's potential to drive innovation in the blockchain space remains a key consideration. The average price of SOL could be significantly bigger, reflecting decades of growth and adoption in the digital sector. However, protracted forecasts should be cautiously approached, as the digital finance world will likely undergo significant changes over the coming decades. This section explores the potential price average trajectory for Solana in 2050, offering insights into the continued prospects of the platform.
Estimated Anticipations
The estimated SOL price prognostication combines insights from historical data, technical analysis, and expert opinions to provide a comprehensive outlook for Solana's future value. Examining the average prices and key virtual currency trends, this section offers a detailed estimate of Solana's price average trajectory over the coming years. Investors should consider these forecasts as part of their broader investment strategy, considering the digitalized universe's inherent volatility.
Solana SOL Price Prediction 2024 - 2030
The period from 2024 to 2030 is expected to be crucial for Solana's growth (SOL coin price), with the average price likely to increase as the platform expands its ecosystem. During this time, Solana's innovative technology and scalability will play a significant role in its performance and Solana price fluctuations. It suggests that the platform could reach new highs, driven by sustained demand and technological advancements.
Solana SOL Price Prediction 2030 - 2050
Looking further ahead, the price prediction for 2030 to 2050 reflects a protracted view of the platform's potential. Over these two decades, Solana could experience significant growth, positioning itself as a leading blockchain network in the digital currency sector. The average price during this period is expected to increase as the platform's technology matures and its adoption widens. However, the long-term average price prognostication also accounts for the potential challenges, including competition from other virtual currencies and regulatory developments, which could influence SOL price.
Conclusion
It has established itself as a powerful player in the cryptocurrency space, offering a high-performance blockchain platform that continues to attract significant attention from developers, investors, and users. The analysis outlined in this article provides a comprehensive overview of the potential future value based on a detailed analysis of trends, historical data, and expert insights. While the fintech sector is inherently volatile, Solana's innovative technology and growing adoption suggest it may achieve substantial growth in the coming years. Investors should consider both the opportunities and risks when making their investment decisions, considering the long-term potential of this dynamic and rapidly evolving platform.
FAQ
Similar guides
Solana Price History: Understanding the Highs and Lows
Roman Klochko
Anatoly Yakovenko: The Visionary Solana Founder Revolutionizing Digital Space
Roman Klochko
Exploring Solana ETFs: A New Frontier in Crypto Universe
Roman Klochko