Hello, fellow crypto enthusiasts and savvy investors! Welcome to our deep dive into a popular topic that’s been stirring conversations in the cryptoverse lately — TRON Price Prediction. I’m thrilled to have you here, and together, we’ll delve into the intriguing and complex world of TRON and its cryptocurrency, TRX.
Now, you’re probably aware that predicting the future price points of any cryptocurrency, let alone TRX, can be akin to peering through a foggy window. It’s tough, but it’s not impossible. This is why in today’s article, we’re going to journey through TRON’s rich history, its very inception, and the grand purpose behind its existence. We will then explore the sophisticated techniques and cutting-edge tools used by seasoned traders to make sense of the TRX’s market trends and forecast its potential rate.
Why, you may ask, is predicting TRX coin’s value such a big deal? Well, understanding the potential future value of any cryptocurrency can be the key to unlocking good investment opportunities. In a space that is known for its volatility, a well-informed prediction could be the difference between success and loss. For TRX, its role in the TRON ecosystem and its potential impact on the world of decentralized applications, give it a unique position that warrants thorough scrutiny and accurate forecasting.
So, are you ready to delve into the fascinating intricacies of TRX’s future price prediction? Grab a cup of your favorite beverage and join me on this exciting exploration. Whether you’re a seasoned trader looking to diversify your portfolio or a crypto newcomer eager to understand more, this article has something for you. Remember, in the ever-evolving world of cryptocurrency, knowledge is your greatest asset. Let’s enrich ours together, shall we? Keep reading!
TRON (TRX) Overview
| TRX Price | $0.283 |
| TRX Price Change 24h | -1.45% |
| TRX Price Change 7d | 3.24% |
| TRX Total Market Capitalization (Market Cap) | $26,806,331,796.35 |
| TRX Circulating Supply | 94,783,662,116.50 |
| TRX Trading Volume | $440,400,674.08 |
| TRX All-Time High (ATH) | $0.3004 |
| TRX All-Time Low (ATL) | $0.001091 |
A Brief History: TRON and Its Purpose
Ah, the story of TRON. It’s a fascinating tale of vision and innovation, marked by ambition and a desire to disrupt the status quo. TRON foundation was conceived in 2017 by Justin Sun, a charismatic figure in the crypto space. His vision was simple yet profound: to establish a truly decentralized internet and democratize content distribution, unshackled from corporate control. This led to the birth of TRON platform, a blockchain-based operating system designed to make this vision a reality.
TRON is a blockchain platform designed to support the creation and execution of smart contracts. At the heart of TRON is its native cryptocurrency, TRX. Its purpose extends beyond just a medium of exchange. TRX is used as the primary token in the TRON network to create and interact with decentralized applications (Dapps) and content. Developers require TRX to build on the TRON blockchain network, and users need it to access and interact with the Dapps and content created on the platform. It’s safe to say that TRX is the lifeblood of the TRON ecosystem.
The journey of TRX in the crypto market has been nothing short of a rollercoaster ride. We’ve witnessed exhilarating ascents and gut-wrenching drops, emblematic of the volatile nature of cryptocurrencies. Now, let’s shift our focus to some of these memorable moments in the TRX’s price history.
Let’s be clear, TRON’s native token has experienced a wild ride, with its fair share of exhilarating peaks and terrifying drops. Here’s a quick snapshot of some key moments that have shaped TRX’s price journey:
- Inception and Initial Growth: TRX started with a modest price but experienced its first significant surge in December 2017, in sync with the broader crypto market boom.
- The Great Crypto Crash of 2018: The subsequent market correction in 2018 saw TRX, along with most cryptocurrencies, lose a significant part of its value.
- Bouncing Back: Despite the market turbulence, TRX displayed resilience, showing steady growth through 2019 and into early 2020.
- Impacts of the Global Pandemic: Like the rest of the world, TRX experienced the effects of the 2020 pandemic with volatile swings.
- Recovery and Recent Trends: As the crypto market recovered, so did TRX, showing promising signs in 2021 and early 2023.
TRON – TRX Price Prediction For Today, Tomorrow, This Week, and Next 30 Days
| Date | Price | Change |
|---|---|---|
| July 06, 2025 | 0.286 | 0.91% |
| July 07, 2025 | 0.284 | -0.70% |
| July 08, 2025 | 0.282 | -0.46% |
| July 09, 2025 | 0.283 | 0.21% |
| July 10, 2025 | 0.281 | -0.71% |
| July 11, 2025 | 0.283 | 0.86% |
| July 12, 2025 | 0.286 | 0.91% |
| July 13, 2025 | 0.283 | -1.00% |
| July 14, 2025 | 0.283 | -0.15% |
| July 15, 2025 | 0.283 | 0.13% |
| July 16, 2025 | 0.284 | 0.44% |
| July 17, 2025 | 0.283 | -0.50% |
| July 18, 2025 | 0.281 | -0.61% |
| July 19, 2025 | 0.280 | -0.38% |
| July 20, 2025 | 0.278 | -0.71% |
| July 21, 2025 | 0.275 | -0.90% |
| July 22, 2025 | 0.274 | -0.67% |
| July 23, 2025 | 0.274 | 0.31% |
| July 24, 2025 | 0.277 | 0.93% |
| July 25, 2025 | 0.280 | 0.98% |
| July 26, 2025 | 0.278 | -0.63% |
| July 27, 2025 | 0.276 | -0.68% |
| July 28, 2025 | 0.277 | 0.29% |
| July 29, 2025 | 0.275 | -0.54% |
| July 30, 2025 | 0.274 | -0.65% |
| July 31, 2025 | 0.273 | -0.04% |
| August 01, 2025 | 0.275 | 0.64% |
| August 02, 2025 | 0.274 | -0.29% |
| August 03, 2025 | 0.275 | 0.28% |
| August 04, 2025 | 0.278 | 0.94% |
TRON Price Prediction 2024
After analyzing TRON’s future price data for 2024, we found that the projected minimum price is $0.255, while the average and maximum prices are $0.297 and $0.339, respectively.
Our assessment of future returns based on this data suggests that TRX price prediction 2024 is relatively stable, with moderate growth expected.
The narrow price range implies that the market may not anticipate significant fluctuations in value, but there is still potential for substantial returns for those willing to take on high risks associated with investing in TRON.
Nonetheless, cryptocurrency investors must be cautious and carry out thorough research before making any investment decisions in this space due to the historical volatility of cryptocurrencies and the continuously evolving market landscape.
| Month | Minimum Price | Average Price | Maximum Price |
|---|---|---|---|
| February 2024 | 0.1009 | 0.1048 | 0.1090 |
| March 2024 | 0.1036 | 0.1076 | 0.1120 |
| April 2024 | 0.1064 | 0.1105 | 0.1150 |
| May 2024 | 0.1093 | 0.1135 | 0.1181 |
| June 2024 | 0.1122 | 0.1165 | 0.1213 |
| July 2024 | 0.1153 | 0.1197 | 0.1246 |
| August 2024 | 0.1184 | 0.1229 | 0.1280 |
| September 2024 | 0.1216 | 0.1262 | 0.1314 |
| October 2024 | 0.1248 | 0.1296 | 0.1350 |
| November 2024 | 0.1282 | 0.1331 | 0.1386 |
| December 2024 | 0.1317 | 0.1367 | 0.1423 |
| January 2025 | 0.1352 | 0.1404 | 0.1462 |
January 2024: TRON Price Forecast
As we enter 2024, TRON opens the year with a potential minimum price of $0.093. Our team’s analysis suggests an average trading range around $0.1023, with the possibility of peaks reaching as high as $0.1068. This upward trend indicates a robust start for TRON, reflecting increased investor confidence and market stability.
TRX Price Forecast for February 2024
Diving into February, TRON’s price projection reflects a bullish sentiment. The minimum price is expected to hover around 0.1009, with an average price that could find its footing at 0.1048. Moreover, the maximum price could reach a peak of 0.1090. These numbers indicate a resilient market, potentially offering lucrative opportunities for savvy traders.
March 2024: TRON Price Forecast
March brings with it a fresh perspective on TRON’s trajectory. The figures speak volumes with a minimum price of 0.1036, suggesting a strong support level. The average price is anticipated to settle at 0.1076, while the maximum price could escalate to 0.1120. This upward trend might be the perfect time for investors to strategize their positions.
TRX Price Forecast for April 2024
As the bloom of April unfolds, so does the promise of TRON’s growth. A minimum price of 0.1064 sets the stage for a robust market, while the average price aims higher at 0.1105. The maximum price could soar to 0.1150, potentially marking a period of significant gains. This could be an opportune moment for those looking to diversify into digital assets.
May 2024: TRON Price Forecast
May’s forecast for TRON is one of steady ascent. With a minimum price of 0.1093, the stability seems assured. The average price is expected to climb to 0.1135, and the maximum price might reach a zenith of 0.1181. Such a consistent upward trend could signify a gathering momentum, one that might warrant increased attention from investors.
TRX Price Forecast for June 2024
June’s TRX price forecast shines a hopeful light, with numbers indicating a bullish market. A minimum price of 0.1122 could be the launching pad for an exciting month, as the average price targets 0.1165. The maximum price might push the boundaries, aiming for 0.1213. Traders might do well to capitalize on this anticipated growth.
July 2024: TRON Price Forecast
July’s data for TRON suggests a summer of prosperity for TRX enthusiasts. The minimum price is set to be at 0.1153, with an average that could gracefully rise to 0.1197. A maximum price reaching 0.1246 hints at the potential for high rewards, but as always, comes with its share of risks.
TRX Price Forecast for August 2024
Come August, TRON’s price prediction hints at a continuation of the year’s positive trend. A minimum price of 0.1184 speaks to the asset’s resilience, the average price at 0.1229 reflects steady growth, and the maximum price could hit 0.1280. For those with their fingers on the pulse, this month could provide some interesting movements to watch.
September 2024: TRON Price Forecast
As leaves begin to turn, September’s forecast for TRON remains green with a minimum price of 0.1216. The average price is expected to rise slightly to 0.1262, and the maximum price could reach new heights at 0.1314. It’s a potentially exciting time for TRON, with the market possibly rewarding those who have been diligent.
TRX Price Forecast for October 2024
October’s TRON prediction is as vibrant as the fall foliage, with the minimum price expected at 0.1248. The average price, sitting at 0.1296, suggests a good balance between growth and stability, while a maximum price of 0.1350 could spell an impressive rally. Traders might want to consider their moves carefully in this dynamic market.
November 2024: TRON Price Forecast
November’s chill brings with it a heated market for TRON, with a minimum price of 0.1282. The average price is projected to be a warm 0.1331, while the maximum price could escalate to a fiery 0.1386. This month could be crucial for making strategic decisions in anticipation of year-end volatility.
TRX Price Forecast for December 2024
Rounding out the year, December’s TRON price forecast shines with holiday cheer. The minimum price could be a gift at 0.1317, while the average price at 0.1367 hints at a stable season. The maximum price, potentially at 0.1423, could end the year on a high note, offering a toast to possibly bright prospects ahead.
TRON Price Prediction 2025
Leaning into 2025, our TRON price prediction 2025 anticipates the bullish trend to persist. Our data suggests a minimum TRX price of $0.1337 and a potential maximum price of $0.1887 if market conditions remain favorable. The average TRX value, we predict, should be around $0.1586.
| Month | Minimum Price | Average Price | Maximum Price |
|---|---|---|---|
| February 2025 | 0.1337 | 0.1389 | 0.1445 |
| March 2025 | 0.1373 | 0.1426 | 0.1484 |
| April 2025 | 0.1410 | 0.1464 | 0.1525 |
| May 2025 | 0.1448 | 0.1504 | 0.1566 |
| June 2025 | 0.1487 | 0.1545 | 0.1608 |
| July 2025 | 0.1528 | 0.1586 | 0.1651 |
| August 2025 | 0.1569 | 0.1629 | 0.1696 |
| September 2025 | 0.1611 | 0.1673 | 0.1742 |
| October 2025 | 0.1655 | 0.1718 | 0.1789 |
| November 2025 | 0.1699 | 0.1765 | 0.1837 |
| December 2025 | 0.1745 | 0.1812 | 0.1887 |
| January 2026 | 0.1792 | 0.1861 | 0.1938 |
TRON Price Prediction 2026
Casting our gaze to 2026, we foresee the TRON prices exhibiting a consistent upward momentum. The minimum price we expect is $0.1772, while the maximum price could reach as high as $0.2501. An average value for TRX in this year would likely be near $0.2103.
| Month | Minimum Price | Average Price | Maximum Price |
|---|---|---|---|
| February 2026 | 0.1772 | 0.1840 | 0.1916 |
| March 2026 | 0.1820 | 0.1890 | 0.1968 |
| April 2026 | 0.1869 | 0.1941 | 0.2021 |
| May 2026 | 0.1920 | 0.1994 | 0.2075 |
| June 2026 | 0.1972 | 0.2047 | 0.2131 |
| July 2026 | 0.2025 | 0.2103 | 0.2189 |
| August 2026 | 0.2079 | 0.2159 | 0.2248 |
| September 2026 | 0.2136 | 0.2218 | 0.2309 |
| October 2026 | 0.2193 | 0.2278 | 0.2371 |
| November 2026 | 0.2253 | 0.2339 | 0.2435 |
| December 2026 | 0.2313 | 0.2402 | 0.2501 |
| January 2027 | 0.2376 | 0.2467 | 0.2568 |
TRON Price Prediction 2027
As we venture into 2027, our analysis predicts a minimum TRX price of $0.2350. On a bullish run, it might reach a maximum price of $0.3316. We believe the average TRX price should settle around the $0.2788 mark.
| Month | Minimum Price | Average Price | Maximum Price |
|---|---|---|---|
| February 2027 | 0.2350 | 0.2440 | 0.2540 |
| March 2027 | 0.2413 | 0.2506 | 0.2609 |
| April 2027 | 0.2478 | 0.2574 | 0.2679 |
| May 2027 | 0.2545 | 0.2643 | 0.2752 |
| June 2027 | 0.2614 | 0.2715 | 0.2826 |
| July 2027 | 0.2685 | 0.2788 | 0.2902 |
| August 2027 | 0.2757 | 0.2863 | 0.2981 |
| September 2027 | 0.2832 | 0.2940 | 0.3061 |
| October 2027 | 0.2908 | 0.3020 | 0.3144 |
| November 2027 | 0.2987 | 0.3101 | 0.3229 |
| December 2027 | 0.3067 | 0.3185 | 0.3316 |
| January 2028 | 0.3150 | 0.3271 | 0.3405 |
TRON Price Prediction 2028
Moving into 2028, we continue to see an optimistic growth pattern for TRON. Our estimates place the minimum TRX price at $0.3115, while the maximum price could go as high as $0.4396. We predict an average TRX value around $0.3696.
| Month | Minimum Price | Average Price | Maximum Price |
|---|---|---|---|
| February 2028 | 0.3115 | 0.3235 | 0.3368 |
| March 2028 | 0.3199 | 0.3322 | 0.3459 |
| April 2028 | 0.3286 | 0.3412 | 0.3552 |
| May 2028 | 0.3375 | 0.3504 | 0.3648 |
| June 2028 | 0.3466 | 0.3599 | 0.3746 |
| July 2028 | 0.3559 | 0.3696 | 0.3848 |
| August 2028 | 0.3655 | 0.3796 | 0.3951 |
| September 2028 | 0.3754 | 0.3898 | 0.4058 |
| October 2028 | 0.3855 | 0.4004 | 0.4168 |
| November 2028 | 0.3960 | 0.4112 | 0.4280 |
| December 2028 | 0.4066 | 0.4223 | 0.4396 |
| January 2029 | 0.4176 | 0.4337 | 0.4514 |
TRON Price Prediction 2029
As we journey into 2029, our data-driven TRX price prediction suggests a minimum price of $0.36. If the market momentum remains positive, we could see a maximum price of $0.5. The average trading price, we project, should be around $0.42.
| Month | Minimum Price | Average Price | Maximum Price |
|---|---|---|---|
| February 2029 | 0.3560 | 0.3697 | 0.3849 |
| March 2029 | 0.3657 | 0.3797 | 0.3953 |
| April 2029 | 0.3755 | 0.3900 | 0.4059 |
| May 2029 | 0.3857 | 0.4005 | 0.4169 |
| June 2029 | 0.3961 | 0.4113 | 0.4282 |
| July 2029 | 0.4068 | 0.4224 | 0.4397 |
| August 2029 | 0.4178 | 0.4338 | 0.4516 |
| September 2029 | 0.4290 | 0.4455 | 0.4638 |
| October 2029 | 0.4406 | 0.4575 | 0.4763 |
| November 2029 | 0.4525 | 0.4699 | 0.4892 |
| December 2029 | 0.4647 | 0.4826 | 0.5024 |
| January 2030 | 0.4773 | 0.4956 | 0.5159 |
TRON Price Prediction 2030
Transitioning into the new decade in 2030, we anticipate the TRX price to maintain its positive trajectory. Our TRON forecast predicts a minimum price of $0.47, and in the event of a bull run, a maximum price of $0.67. We estimate the average TRX price to be approximately $0.56.
| Month | Minimum Price | Average Price | Maximum Price |
|---|---|---|---|
| February 2030 | 0.4747 | 0.4930 | 0.5132 |
| March 2030 | 0.4875 | 0.5063 | 0.5270 |
| April 2030 | 0.5007 | 0.5199 | 0.5413 |
| May 2030 | 0.5142 | 0.5340 | 0.5559 |
| June 2030 | 0.5281 | 0.5484 | 0.5709 |
| July 2030 | 0.5424 | 0.5632 | 0.5863 |
| August 2030 | 0.5570 | 0.5784 | 0.6021 |
| September 2030 | 0.5720 | 0.5940 | 0.6184 |
| October 2030 | 0.5875 | 0.6101 | 0.6351 |
| November 2030 | 0.6034 | 0.6265 | 0.6522 |
| December 2030 | 0.6196 | 0.6435 | 0.6698 |
| January 2031 | 0.6364 | 0.6608 | 0.6879 |
TRON Price Prediction 2031
As we progress into 2031, our projections suggest a steady uptrend for TRX. We predict a base price of $0.63 and a potential maximum price of $0.89. We anticipate the average trading price to stabilize around the $0.75 mark.
| Month | Minimum Price | Average Price | Maximum Price |
|---|---|---|---|
| February 2031 | 0.6330 | 0.6573 | 0.6842 |
| March 2031 | 0.6501 | 0.6750 | 0.7027 |
| April 2031 | 0.6676 | 0.6933 | 0.7217 |
| May 2031 | 0.6856 | 0.7120 | 0.7412 |
| June 2031 | 0.7041 | 0.7312 | 0.7612 |
| July 2031 | 0.7232 | 0.7509 | 0.7817 |
| August 2031 | 0.7427 | 0.7712 | 0.8028 |
| September 2031 | 0.7627 | 0.7920 | 0.8245 |
| October 2031 | 0.7833 | 0.8134 | 0.8468 |
| November 2031 | 0.8045 | 0.8354 | 0.8696 |
| December 2031 | 0.8262 | 0.8579 | 0.8931 |
| January 2032 | 0.8485 | 0.8811 | 0.9172 |
TRON Price Prediction 2032
Closing out our long-term forecast in 2032, we continue to see promising growth for TRON. Our data suggests a minimum TRX price of $0.84, with potential to touch $1.19 on the higher end. The average TRX price, we believe, will be around $1.
| Month | Minimum Price | Average Price | Maximum Price |
|---|---|---|---|
| February 2032 | 0.8407 | 0.8730 | 0.9087 |
| March 2032 | 0.8633 | 0.8965 | 0.9333 |
| April 2032 | 0.8867 | 0.9207 | 0.9585 |
| May 2032 | 0.9106 | 0.9456 | 0.9844 |
| June 2032 | 0.9352 | 0.9711 | 1.0109 |
| July 2032 | 0.9604 | 0.9973 | 1.0382 |
| August 2032 | 0.9864 | 1.0243 | 1.0663 |
| September 2032 | 1.0130 | 1.0519 | 1.0950 |
| October 2032 | 1.0403 | 1.0803 | 1.1246 |
| November 2032 | 1.0684 | 1.1095 | 1.1550 |
| December 2032 | 1.0973 | 1.1394 | 1.1862 |
| January 2033 | 1.1269 | 1.1702 | 1.2182 |
The Main Questions Of Critical Thinking When We Talk About TRON Price Forecast
Below are three critical thinking questions to deepen your own research and understanding of the price of TRX and the other factors influencing it:
- In the context of various influences (technical indicators, market sentiment, project development, and global macroeconomic events) affecting TRON’s price, how can one discern which has the most significant impact during a specific period? What measures can be used to quantify these effects?
- Given the highly volatile nature of cryptocurrency markets, what kind of risk-to-reward ratio should an investor consider acceptable when investing in TRON based on future price predictions? How should this ratio adapt in response to changes in market conditions?
- Considering the influence of ‘whales’ (large-scale investors) and potential market manipulation in the crypto world, how can an investor account for these factors in their investment strategy for TRON? What signs might suggest such manipulation is occurring?
Critical thinking in this area involves recognizing the complexity of market dynamics, the inherent risks of crypto investing, and the need for thorough analysis and informed decision-making.
TRON (TRX) Price Predictions by Experts
When it comes to TRON price prediction forecasts, it’s always fascinating to hear the perspectives of well-known financial experts and crypto experts too.
- CryptoNewsZ: CryptoNewsZ put forth an optimistic prediction for TRON, suggesting that TRX could reach an average price of $0.15 in 2024. The growth trend, according to their analysis, would likely continue into 2025 with the value of TRX potentially touching $0.17. The forecast for the subsequent years suggests a bullish run, with the coin potentially being valued at around $0.24 in 2026 and even climbing up to around $0.26 in 2027.
- PricePrediction.net: On a similar positive note, PricePrediction.net projected that TRX could trade at $0.081 in 2024, and possibly increase to $0.12 by 2025. Their forecast for 2026 indicates that TRON could be worth $0.18, with a steady increase projected for the following years – reaching up to $0.26 in 2027, $0.38 in 2028, and $0.54 in 2029. Their long-term forecast is even more optimistic, with a TRX price prediction for 2030 of $1.16, and an ambitious prediction of $1.70 by 2031.
- GOV Capital: According to GOV Capital’s TRON price prediction, it is highly likely that the price of TRON could reach $0.1488 by the end of the year based on their fundamental analysis. They also predict a promising future, suggesting that TRX might hit a mark of $0.54 by 2028. Their long-term forecast extends even beyond that, hinting at substantial growth in the next five years.
- Trading Education: In the opinion of Trading Education, the short-term TRON price prediction for 2024 exhibits some fluctuations, with the highest potential value at $0.09 and the minimum price at $0.054. They anticipate TRX to stabilize around an average trading price of $0.072.
- Digital Coin Price: Finally, Digital Coin Price’s forecast analysis also suggests an upward trend for TRX. They predict that the TRX price has the potential to cross the $0.12 level. Furthermore, by the end of the year, they expect TRON to reach a minimum value of $0.0579, while also having the capability to attain a maximum price level of $0.14.
- WalletInvestor: However, not all forecasts are as hopeful. WalletInvestor, for instance, had a more bearish view on TRON’s future. According to their analysis, TRX might experience a downward trend over the next year, possibly reaching a minimum value of $0.0312 by November 2024.
Decoding the Charts: TRX Technical Price Analysis
Let’s take a deep dive into the world of technical analysis for TRON (TRX), a crypto coin that has been in the limelight due to its security and growth potential. To the uninitiated, technical analysis might seem like an intricate dance of lines and charts, but once you’ve learned the steps, you’ll find it’s a powerful way to predict future price trends.
When we’re talking about technical analysis, several key concepts and tools spring to mind. Let me share some of those with you.
- Price charts: These are the bread and butter of any technical analyst. They use various types such as line charts, bar charts, and candlestick charts to depict historical price data and identify patterns or trends.
- Trend analysis: This is where analysts identify the overall trend, which is a critical aspect of technical analysis. They look for uptrends (a series of higher highs and higher lows) or downtrends (a series of lower highs and lower lows) to determine the market’s direction.
- Support and resistance levels: Support levels are price points where an asset’s price has historically had difficulty falling below, while resistance levels are points where the price has had difficulty rising above. These levels help traders identify potential entry and exit points for trades.
- Technical indicators: Analysts use various mathematical indicators to gain insights into market trends and momentum. Some common indicators include MAs, Relative Strength Index (RSI), Moving Average Convergence Divergence (MACD), and Bollinger Bands.
- Chart patterns: Analysts look for specific price chart patterns that may suggest price movements. Examples of chart patterns include head and shoulders, double tops and bottoms, triangles, and flags.
- Volume analysis: This provides insights into the strength or weakness of price movements. High volume during a price increase can signal strong buying interest, while low volume during a price decline may indicate weak selling pressure.
- Timeframes: Analysts apply their methods to various timeframes, from intraday charts to weekly or monthly charts, depending on their trading style and objectives.
Technical Indicators: Origin and Purpose
Technical indicators have a rich history that intertwines with the evolution of financial markets. From the earliest usage of simple bar charts to track minimum and maximum prices, we’ve come a long way. The field started gaining prominence during the 20th century, with contributions from financial gurus like Charles Dow and Ralph Nelson Elliott. Over time, these analytical tools have evolved into complex mathematical formulas that consider a variety of factors beyond just the price.
These indicators were born out of a need to understand and predict the market’s movements better. Technical analysis uses these indicators to decode the historical performance of an asset, intending to predict its future trajectory. While the stock market was the original playground for these tools, their use has since spread to other markets, including commodities, forex, and of course, cryptocurrencies.
The Role of Technical Indicators in Financial Markets
Technical indicators serve an indispensable role in today’s financial markets. They assist traders and investors in making decisions by providing signals about potential future price movements.
Indicators can help identify potential trends, gauge the strength of a move, estimate where a price might turn, and more. They play a critical role in defining the risk-reward ratio and creating trading strategies.
Remember, no single indicator can provide a complete picture. Traders often use a combination of indicators to validate their analysis. This method, known as ‘confirmation’, reduces the risk of false signals and can lead to more reliable price predictions.
How Technical Indicators Can Be Used in TRON Price Predictions
Now, how do these indicators apply to TRON (TRX) price prediction? They work in much the same way as they do for any other financial asset. Technical indicators can provide us with a wealth of information on TRON’s price movement, trading volume, and market sentiment.
For example, Moving Averages can help smooth out price data to identify trends over a specific period. Meanwhile, the Relative Strength Index (RSI) can help determine whether TRON is in an overbought or oversold condition. Overbought conditions might suggest a price drop, while oversold conditions could hint at a price increase.
MACD is another useful indicator. It can show potential buy and sell signals, and when used in combination with other indicators, can provide more reliable signals.
Indicators such as Bollinger Bands can provide insights into the volatility of TRON’s price. If the price is moving towards the upper band, it might be a sign of an upward trend. Conversely, if the price is moving towards the lower band, it might indicate a downward trend.
I know how important it is to have a solid understanding of the most common technical indicators used for both crypto prices and predicting TRX worth. Thus, in this section, I’ll share with you the essential indicators that I’ve found particularly helpful in my own trade journey, and I’ll provide real-life examples of how to apply them to TRON prediction.
Moving Averages (MAs) in TRON (TRX) Price Prediction
The Moving Average (MA) is one of the simplest and most commonly used technical indicators. It smooths out price data over a specified period, making it easier to spot overall trends. There are different types of MAs, including Simple Moving Averages (SMA) and Exponential Moving Averages (EMA). The latter gives more weight to recent prices, making it more responsive to new information.
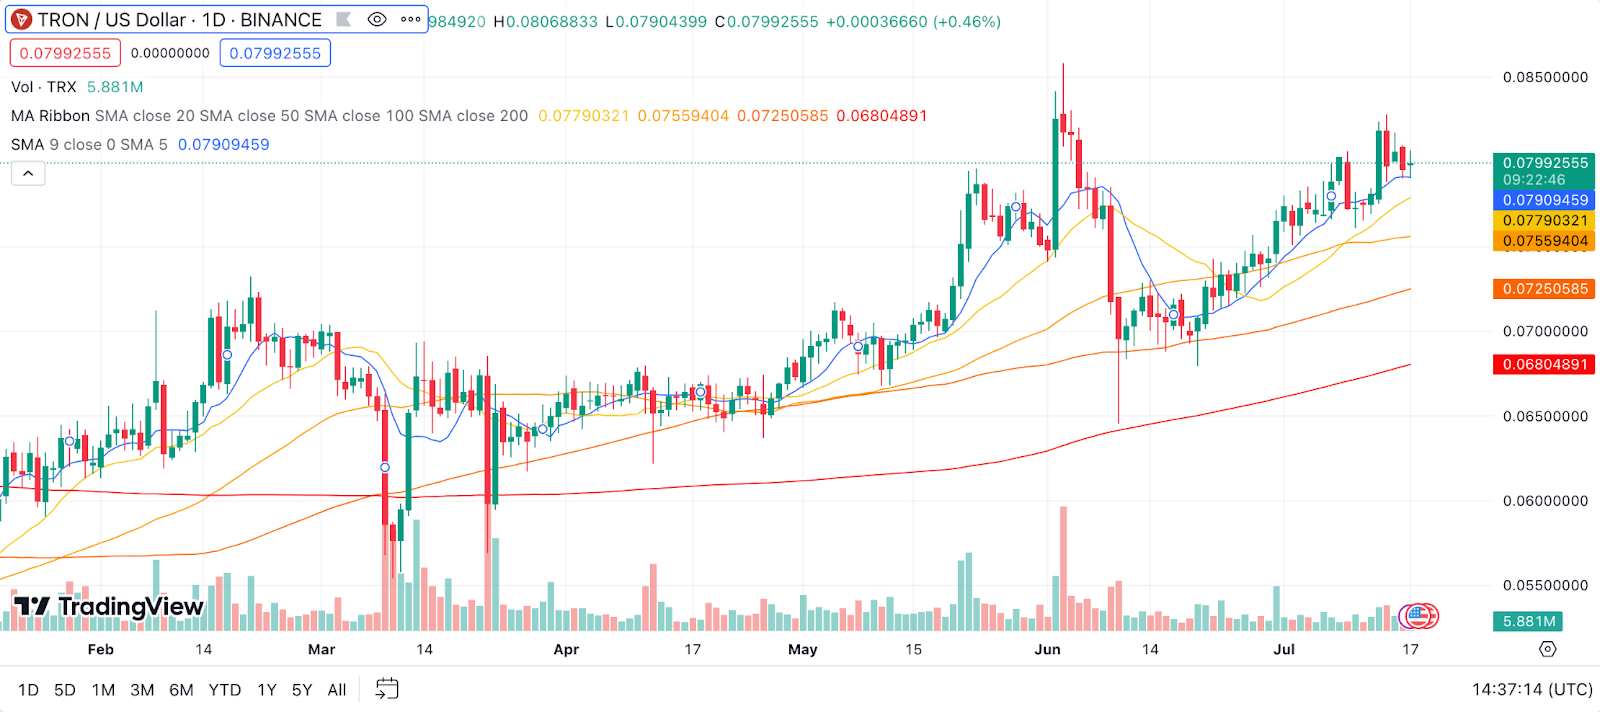
Example: Let’s apply this to TRON (TRX) price prediction. Imagine you’re looking at a 50-day SMA for TRON. If TRON’s current rate is above this 50-day SMA, it might suggest that TRON is in an uptrend. Conversely, if TRON’s price falls below the 50-day SMA, it might be the start of a downtrend. For instance, there could have been a period where TRON’s price crossed above its 50-day SMA, a potential sign of an upcoming uptrend.
Relative Strength Index (RSI) for TRON (TRX) Price Predictions
The Relative Strength Index (RSI) is a momentum oscillator that measures the speed and change of price movement. It’s generally used to identify overbought or oversold conditions in a market. An asset is usually considered overbought when the RSI is above 70 and oversold when it’s below 30.

Example: When it comes to TRON (TRX) price predictions, if its RSI reaches above 70, it might suggest that TRON is being overbought and that a price correction could be imminent. On the flip side, an RSI below 30 may indicate that TRON is oversold, and a price increase might be on the horizon. Imagine a scenario where the RSI of TRON dipped below 30. This might have been a potential buying opportunity as it could indicate an oversold condition.
Moving Average Convergence Divergence (MACD) for TRON (TRX) Price Prediction
The Moving Average Convergence Divergence (MACD) is another widely used momentum indicator. It’s used to identify potential buy and sell signals by showing the relationship between two MAs of a security’s price. The MACD consists of two lines—the MACD line and the signal line—and a histogram. Buy signals are typically seen when the MACD line crosses above the signal line, while sell signals are interpreted when the MACD line crosses below the signal line.
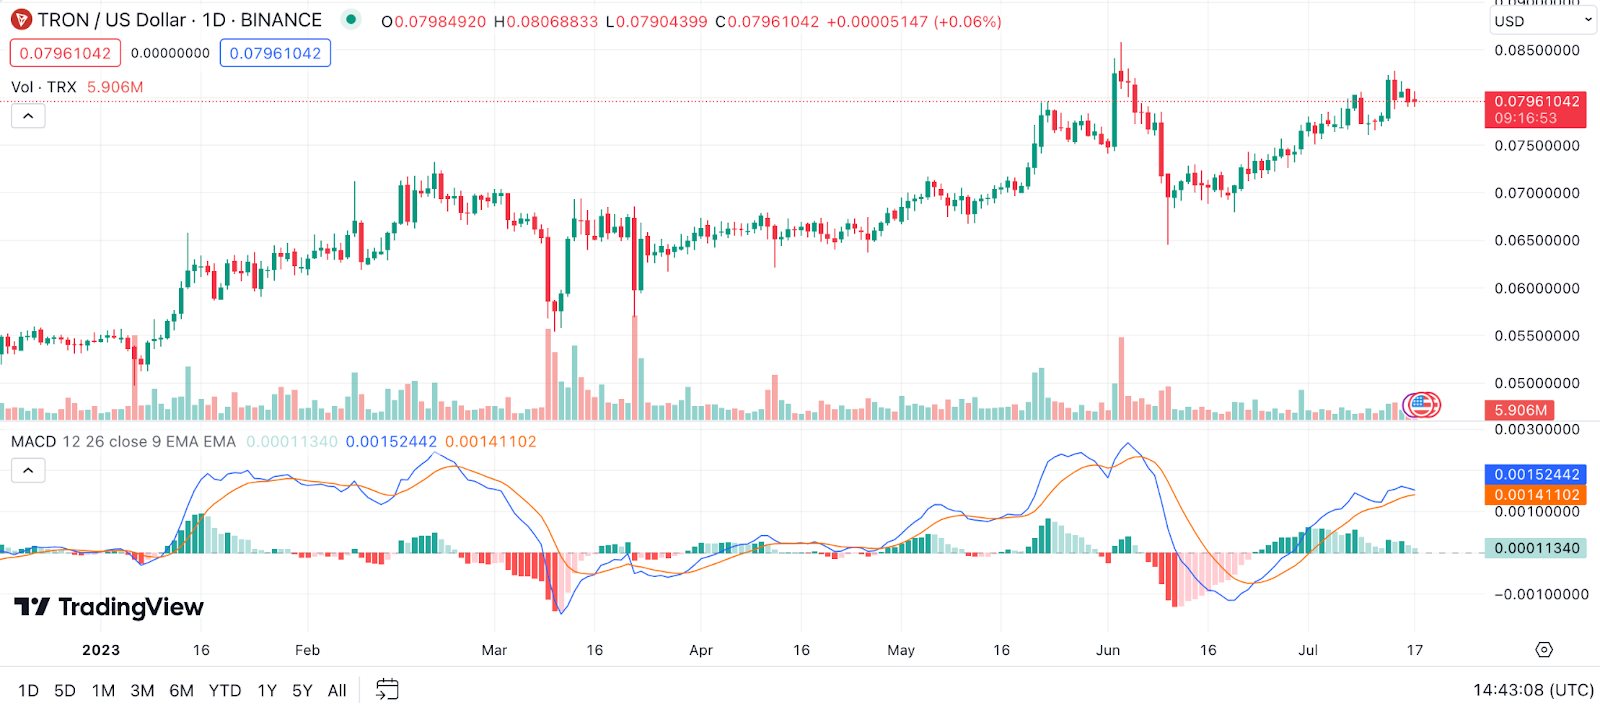
Example: For TRON (TRX) price prediction, a potential buy signal might have been generated when its MACD line crossed above the signal line, indicating bullish momentum. Conversely, if TRON’s MACD line crossed below the signal line, it might have been a sell signal, suggesting bearish momentum. For instance, consider a period where the MACD line of TRON crossed above the signal line. This could have suggested a bullish momentum and potentially a good time to enter a long position.
Bollinger Bands for TRON Price Prediction
Bollinger Bands are a volatility indicator created by John Bollinger. They consist of a simple moving average (middle band) with an upper and lower band. The upper and lower bands are typically 2 standard deviations plus and minus the simple moving average. Bollinger Bands expand and contract based on market volatility. When the bands are wide, it signals high volatility, and when they’re narrow, it indicates low volatility.
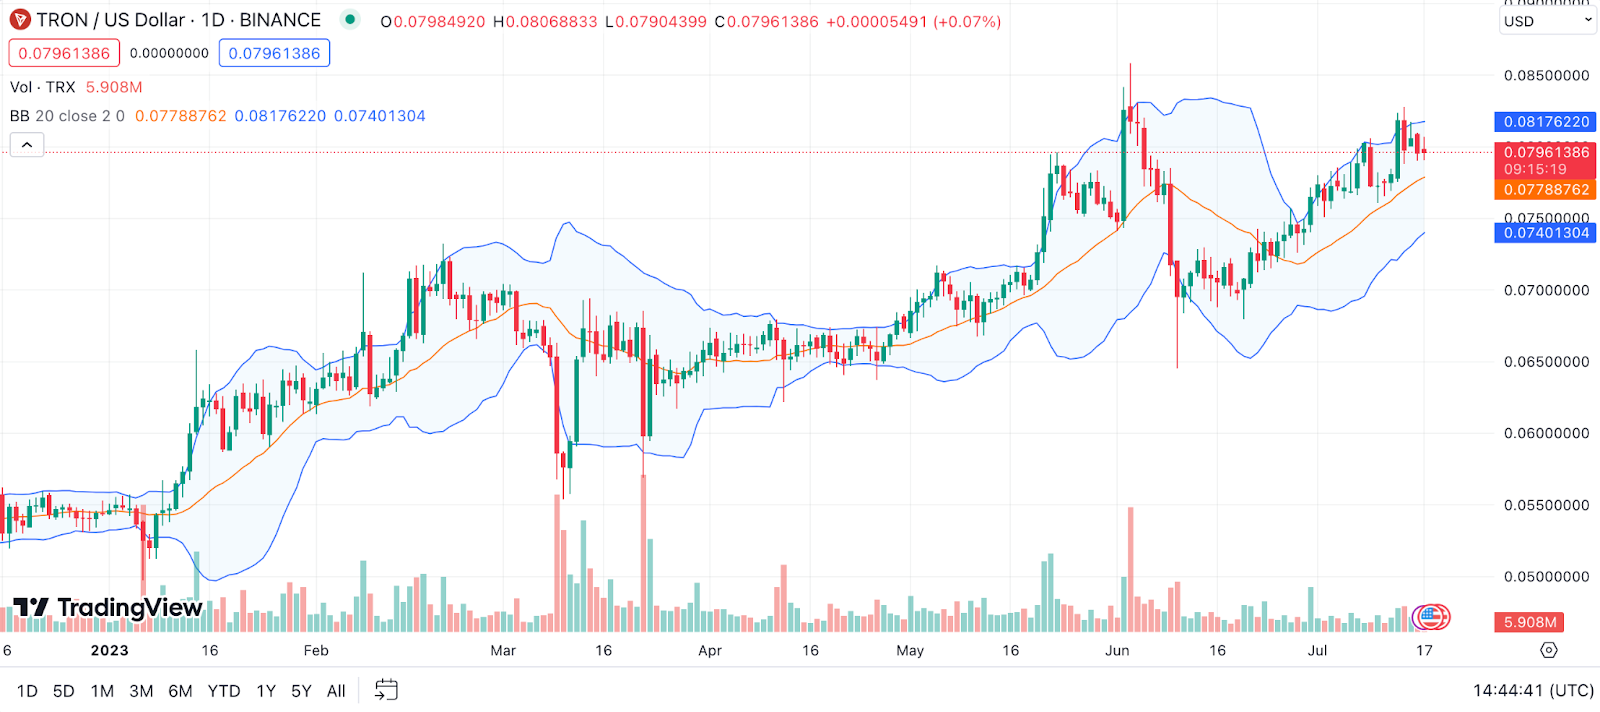
Example: For TRON (TRX) price prediction, a move that touches or crosses the bands might be significant. Let’s say TRON’s price rises and touches the upper band, it might be overbought, potentially suggesting a price reversal or pullback. Conversely, if TRON’s price falls and touches the lower band, it might be oversold, hinting at a possible price bounce back upwards. For instance, there might have been a time when TRON’s price touched the upper Bollinger Band, suggesting a potential overbought market.
Stochastic Oscillator for TRON Price Prediction
The Stochastic Oscillator is a momentum indicator that compares a particular closing price of a security to a range of its prices over a certain period. The oscillator’s readings range between zero and 100. Just like the RSI, the Stochastic Oscillator is used to generate potential buy and sell signals. Readings above 80 are considered overbought while readings below 20 are considered oversold.
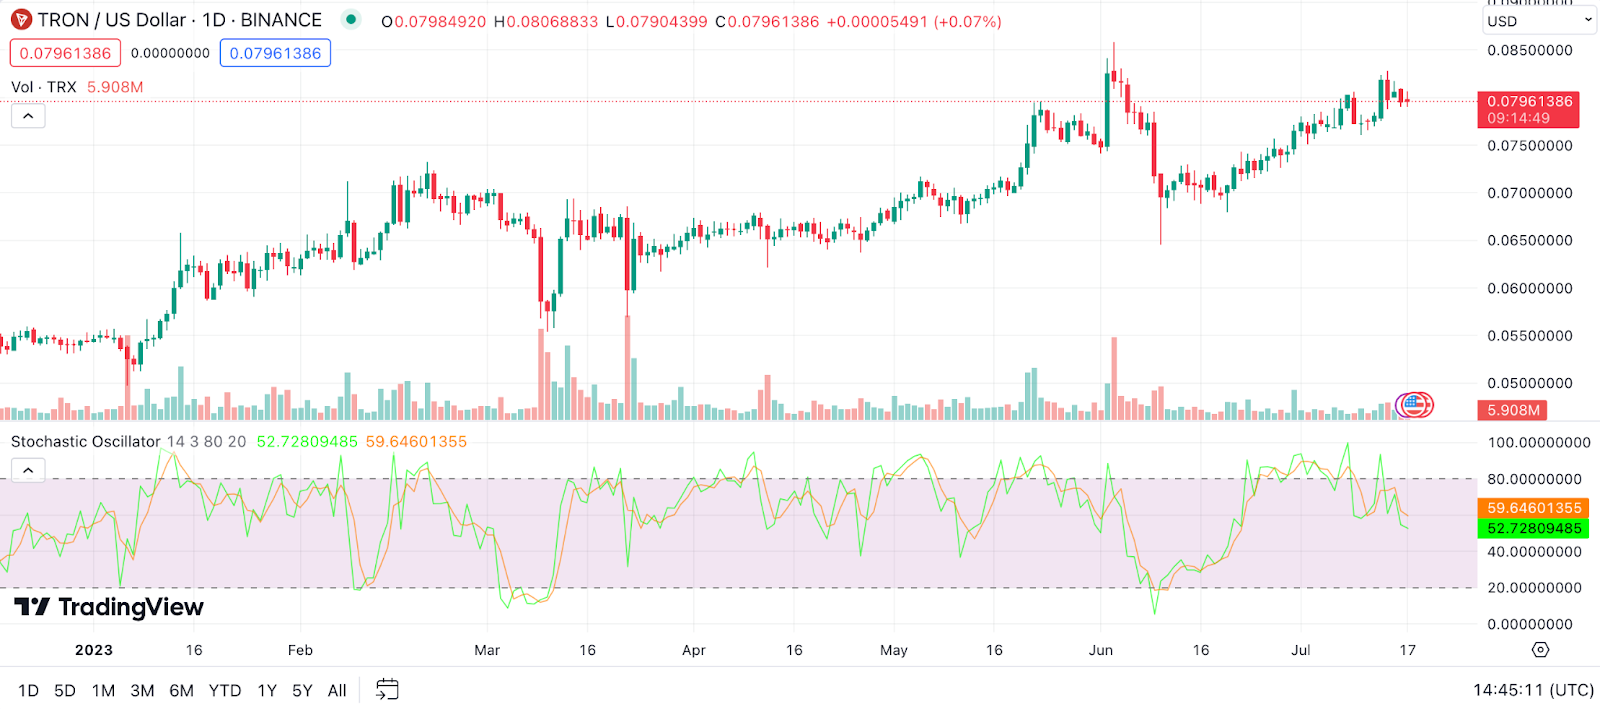
Example: When applied to TRON (TRX) price prediction, if the Stochastic Oscillator moves above 80, it could indicate that TRON is potentially overbought. Similarly, if it falls below 20, TRON could be potentially oversold. Picture a situation where the Stochastic Oscillator of TRON dipped below 20. This could have indicated an oversold condition and potentially a good time to consider buying.
Parabolic SAR (Stop and Reverse) for TRON Price Prediction
The Parabolic Stop and Reverse (SAR) is a technical indicator that helps determine the direction of a security’s momentum and provides potential entry and exit points. In a chart, the Parabolic SAR takes the form of dots placed above or below the price bars. When the dots are below the price bars, it indicates a bullish trend. Conversely, when the dots are above the price bars, it’s a bearish trend.
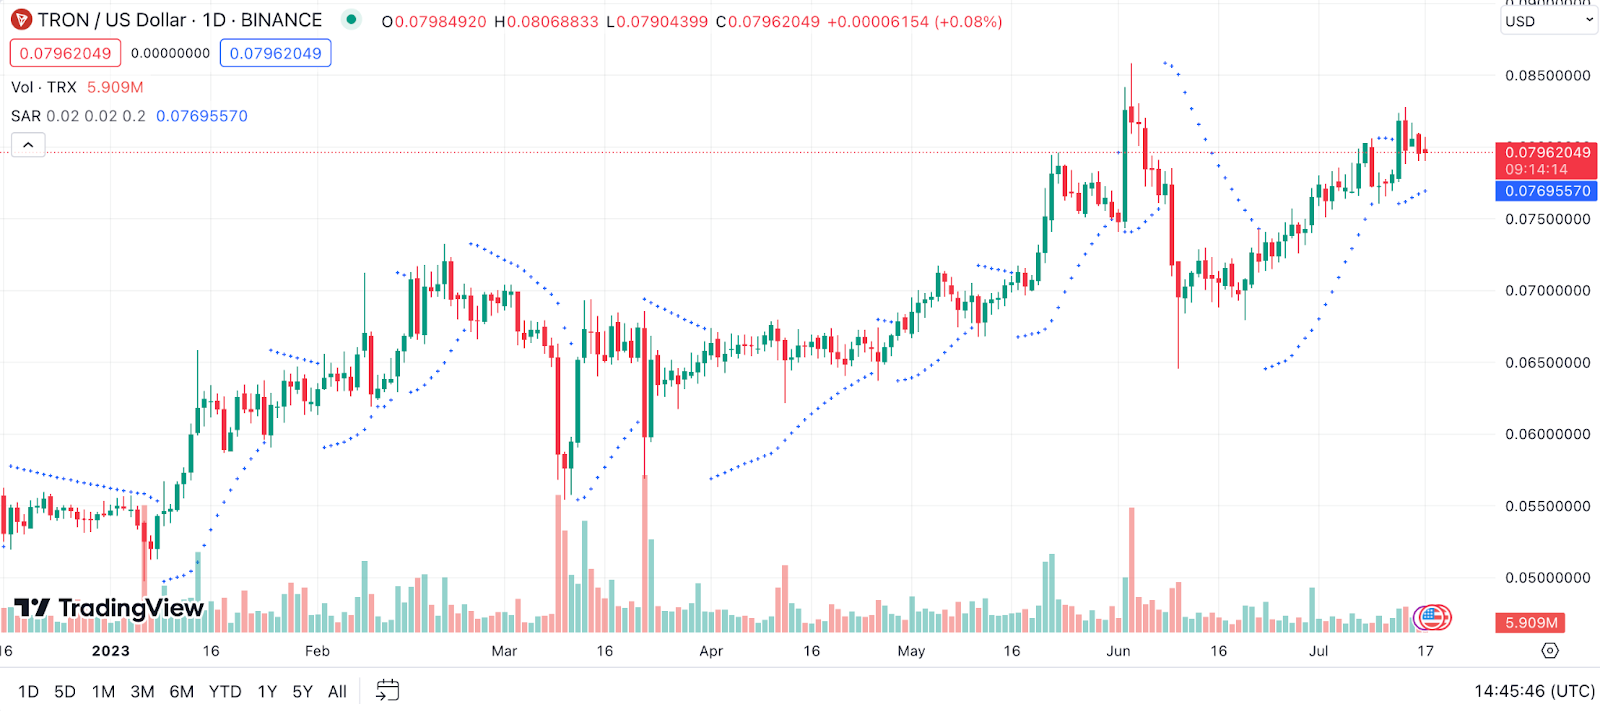
Example: Let’s say we’re analyzing the price of TRON. If the Parabolic SAR dots are below the current price of TRON, it suggests a bullish trend, meaning the price might keep rising. On the other hand, if the dots are above the current price, it implies a bearish trend, hinting at a potential fall in price. For example, there could have been a time when the Parabolic SAR dots were below TRON’s price bars, suggesting a bullish trend in TRON’s market.
Ichimoku Cloud for TRON Price Prediction
The Ichimoku Cloud, also known as Ichimoku Kinko Hyo, is a versatile indicator that defines support and resistance levels, identifies trend direction, measures momentum, and provides trading signals. It is designed to provide a complete picture of a market’s trend strength and direction. The Ichimoku cloud comprises five lines: the Tenkan-sen, Kijun-sen, Senkou Span A, Senkou Span B, and the Chikou Span.
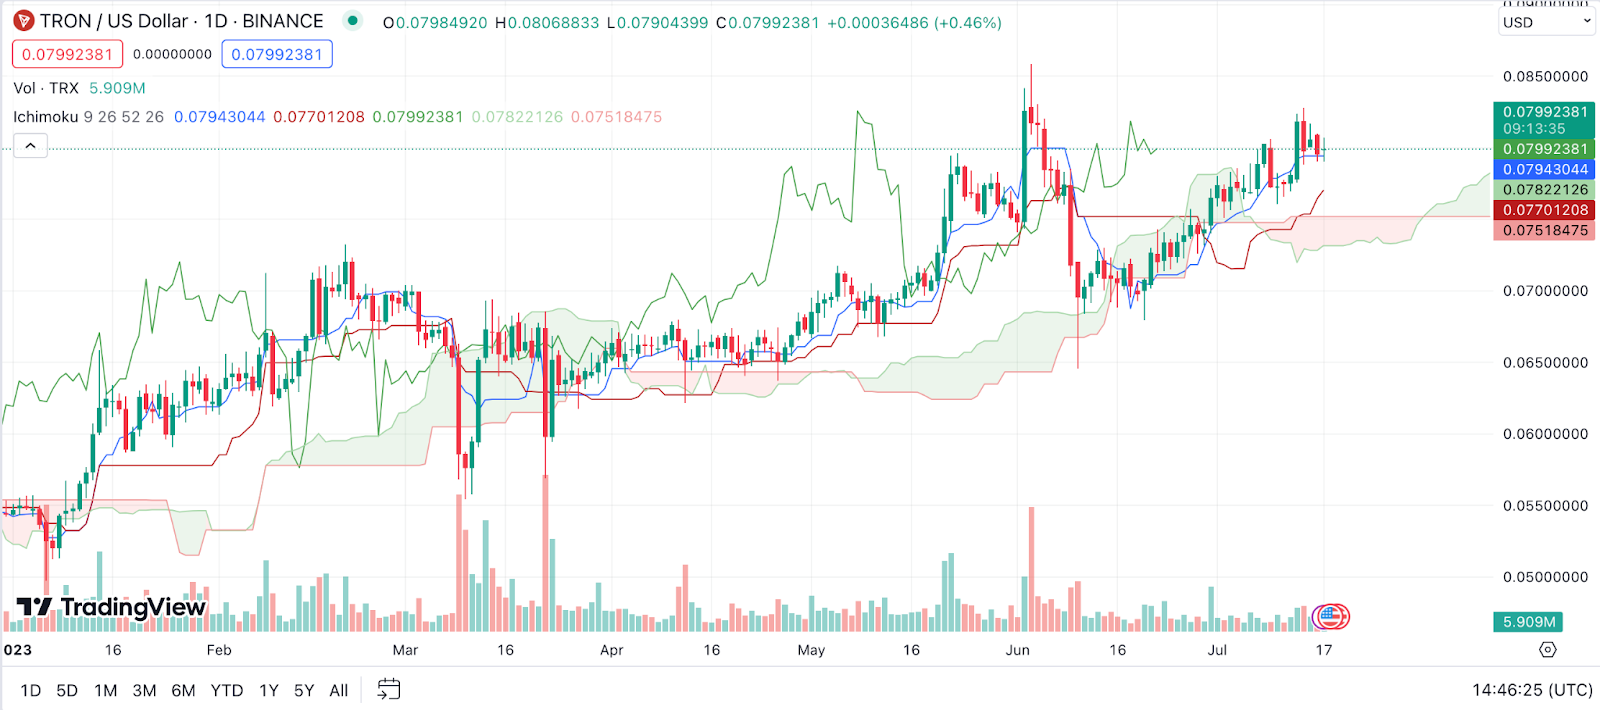
Example: When the price of TRON is above the cloud, it signifies a bullish trend. When it’s below, it suggests a bearish trend. For instance, if the price of TRON is moving above the Ichimoku cloud, this might suggest a good opportunity to consider buying, anticipating a bullish trend.
Fibonacci Retracement for TRON Price Prediction
Fibonacci Retracement is a popular technical analysis tool to determine potential support and resistance levels. These are horizontal lines that indicate where possible price reversals may happen. Fibonacci retracement levels are static prices that do not change, unlike MAs. The static nature of these price levels allows for quick and easy identification and enables traders and investors to react when the price levels are tested.
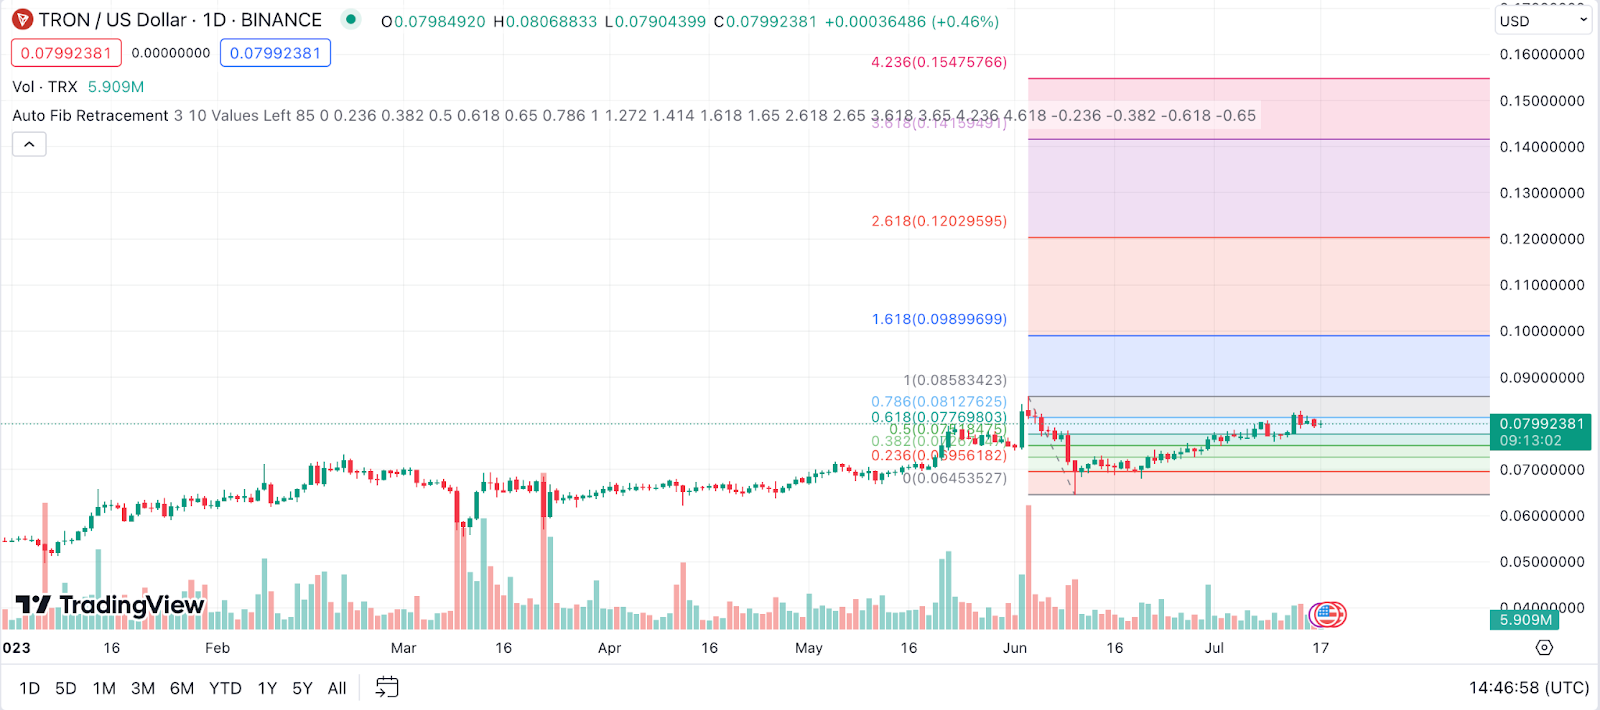
Example: Suppose TRON experienced a significant price surge over a period. After the surge, we could use the Fibonacci retracement to identify potential levels where the price might retrace before resuming the upward trend. For example, the retracement might suggest that a 50% pullback from the peak price could be a potential buying point.
Average Directional Index (ADX) for TRON Price Prediction
The Average Directional Index (ADX) measures the strength of a trend but does not indicate its direction. It ranges from 0 to 100, with a reading over 20 suggesting a strong trend and below 20 indicating a weak trend.
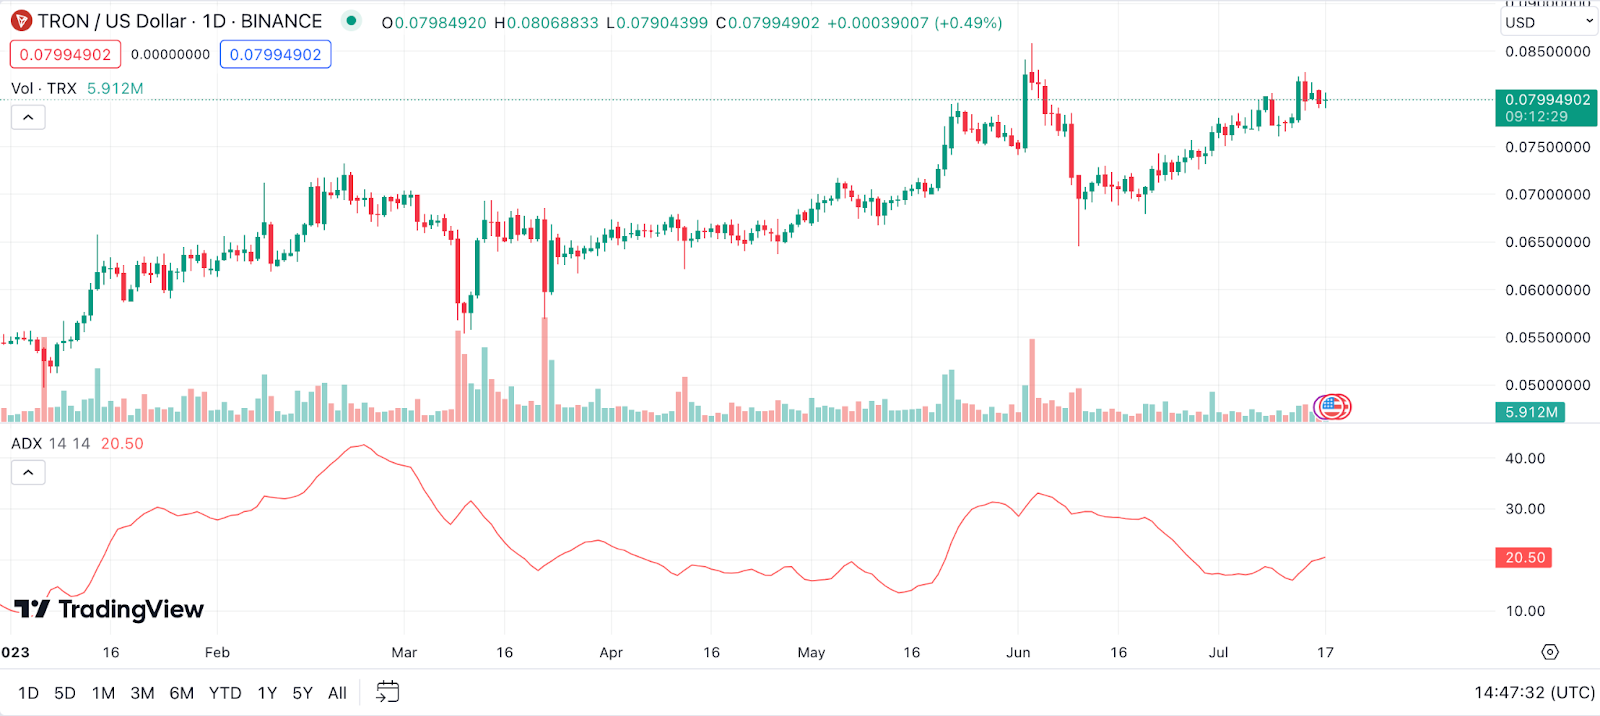
Example: Let’s say we’re analyzing TRON. If the ADX is above 20, it suggests that TRON is trending strongly. If it’s below 20, it indicates that TRON is in a weak trend or range-bound. For instance, there might have been times when the ADX for TRON surged above 20, suggesting a strong bullish or bearish trend in play.
On Balance Volume (OBV) for TRON Price Prediction
On Balance Volume (OBV) is a momentum indicator that uses volume flow to predict changes in stock price. Joseph Granville developed the OBV metric in the 1960s. He believed that when volume increases sharply without a significant change in the asset’s price, the price will eventually jump upward, and vice versa.
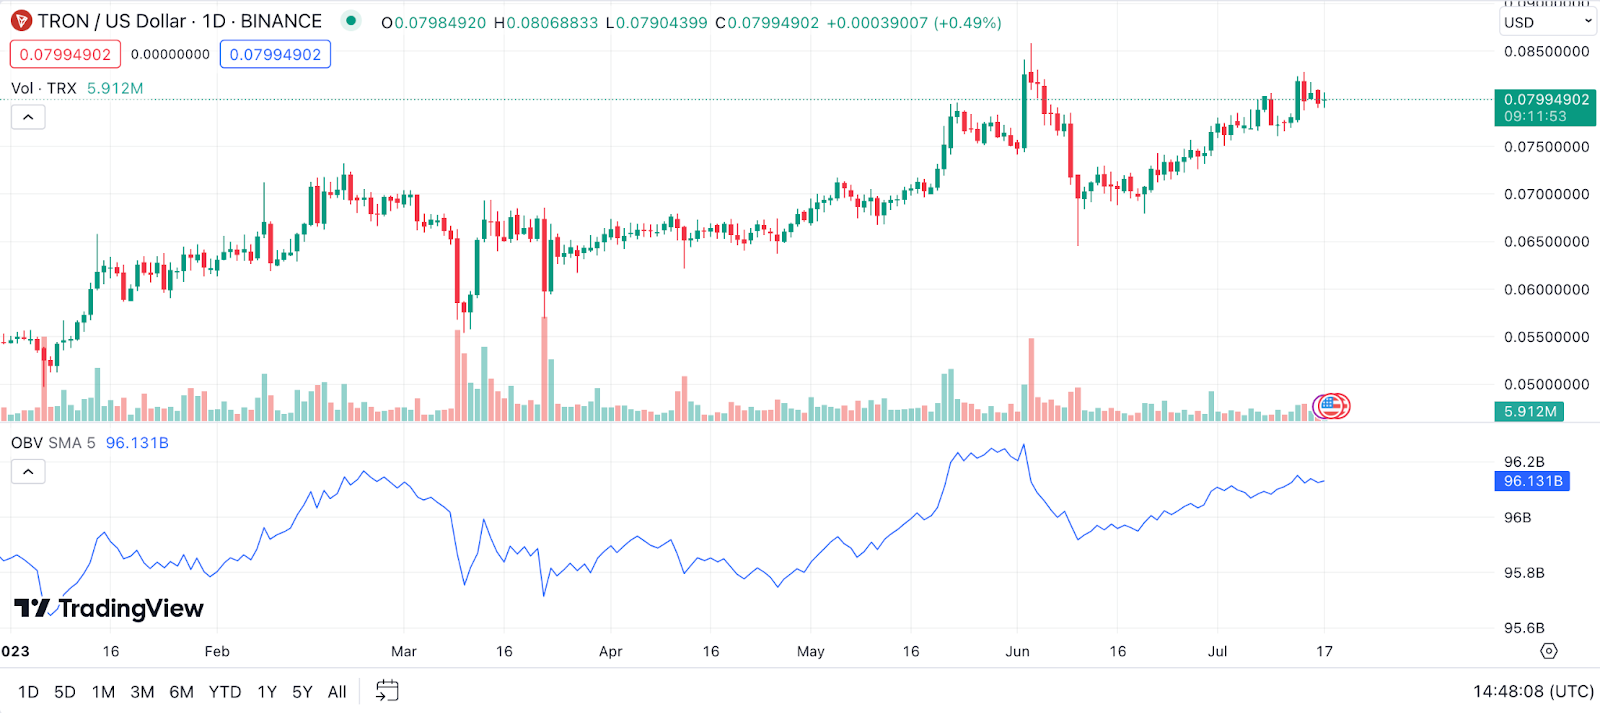
Example: Applying this to TRON (TRX) price prediction, if we observe a period where volume is steadily increasing while the price remains relatively stable, this could suggest an imminent rise in price, according to OBV. Conversely, if the volume is falling with stable prices, it could hint at a possible price drop.
Rate of Change (ROC) for TRON Price Prediction
The Rate of Change (ROC) is a momentum oscillator that measures the percentage change in price from one period to the next. The ROC calculation compares the current TRON price with the price “n” periods ago.
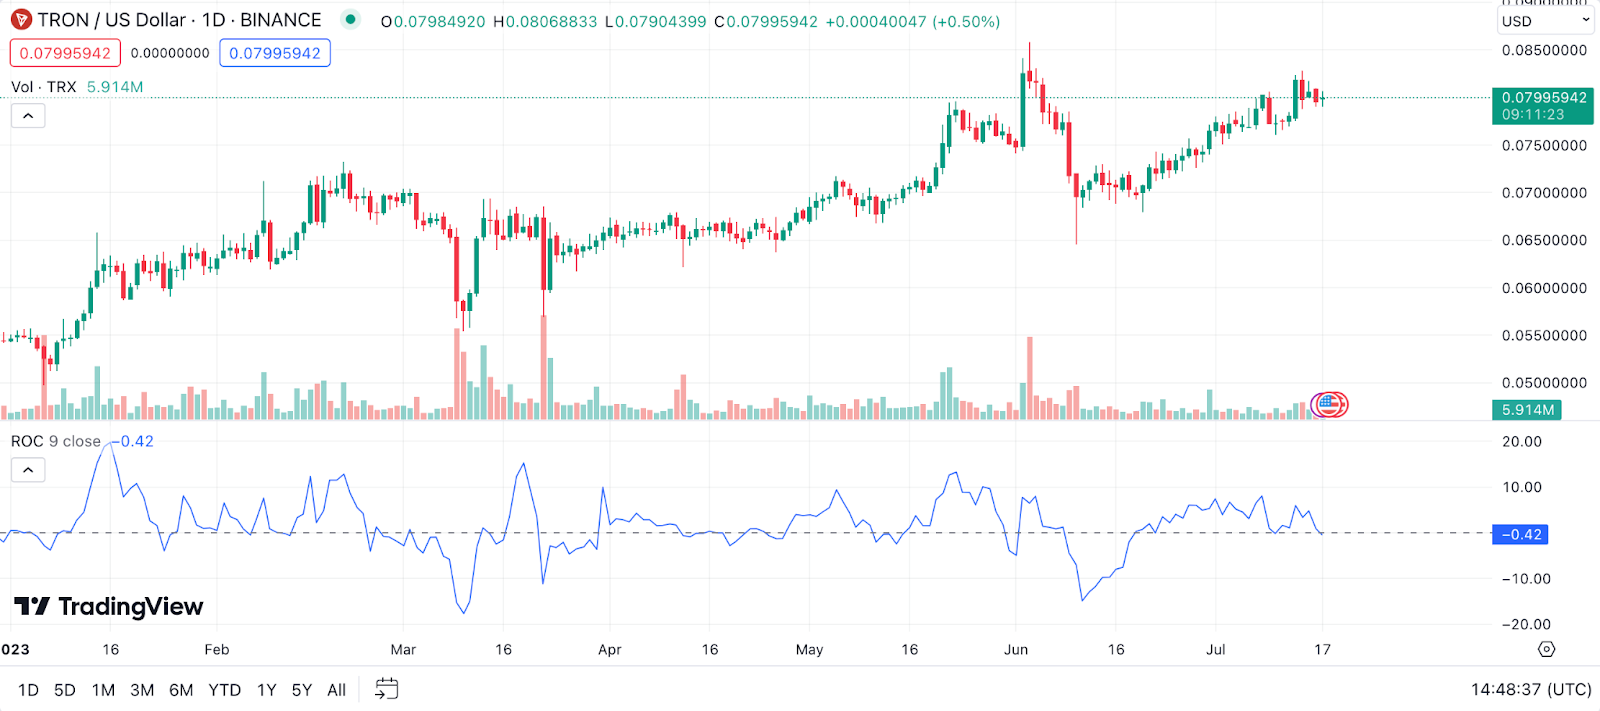
Example: When applied to TRON (TRX) price prediction, if the ROC is rising, this indicates an increasing momentum in the price change – the price is rising at a faster rate. This could be seen as a bullish signal. Conversely, if ROC is declining, this indicates decreasing momentum – the price may be rising, but at a slower pace, or even beginning to drop.
Commodity Channel Index (CCI) for TRON Price Prediction
The Commodity Channel Index (CCI) is a versatile indicator that can be used to identify a new trend or warn of extreme conditions. Donald Lambert developed the CCI to spot cyclical trends in commodities, but it can be applied to cryptocurrencies like TRON as well.
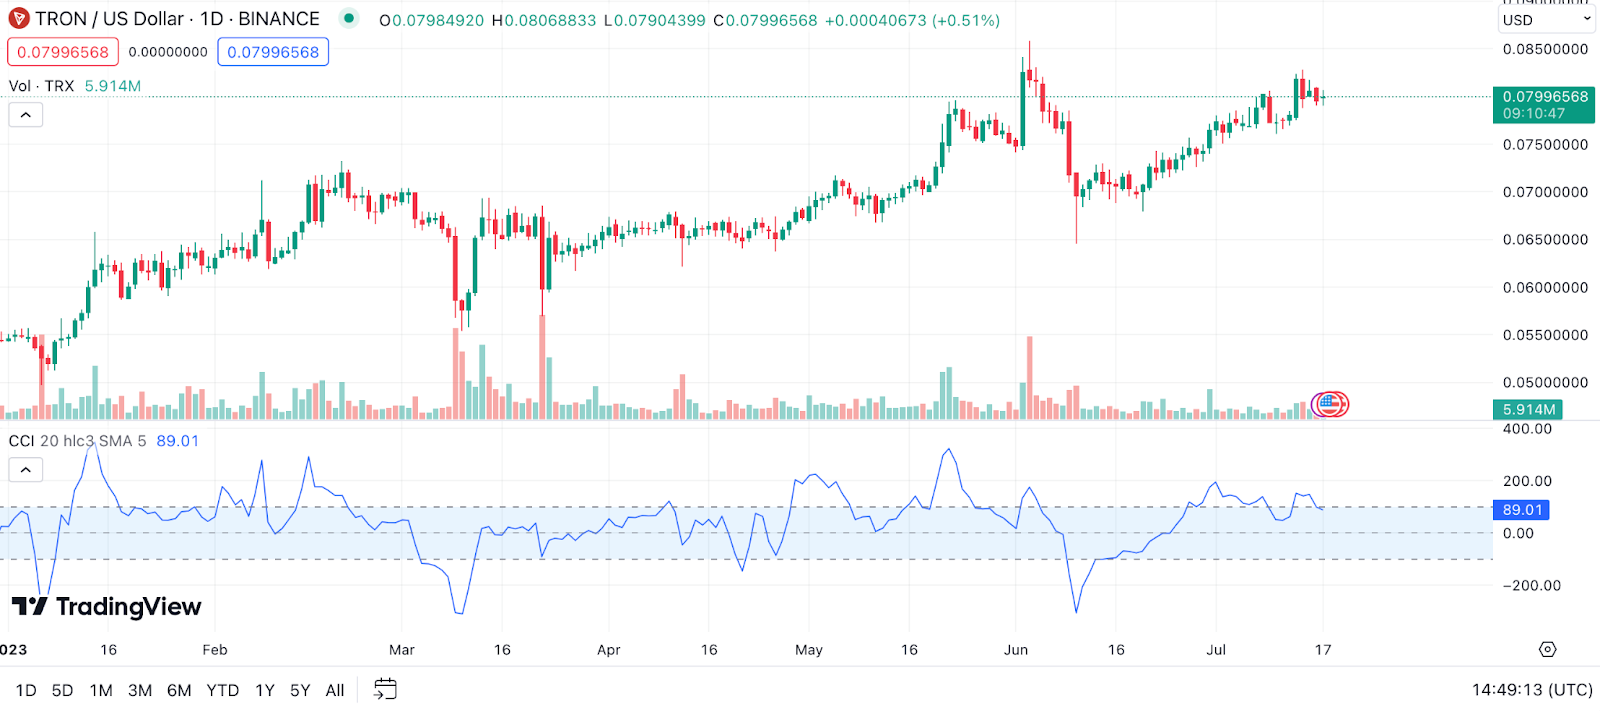
Example: If the CCI is above 100, this can indicate an uptrend, and it may be a good time to buy TRON. If the CCI is below -100, it could mean a downtrend is in progress, signaling a potential selling opportunity. For example, if we observe the CCI for TRON moving above 100, this might suggest the start of a bullish period for the coin.
Accumulation/Distribution Line (A/D Line) for TRON Price Prediction
The Accumulation/Distribution Line is a volume-based indicator designed to measure the cumulative flow of money into and out of a security. It was developed by Marc Chaikin who wanted to create an indicator that could help confirm a trend by looking at the money flow.
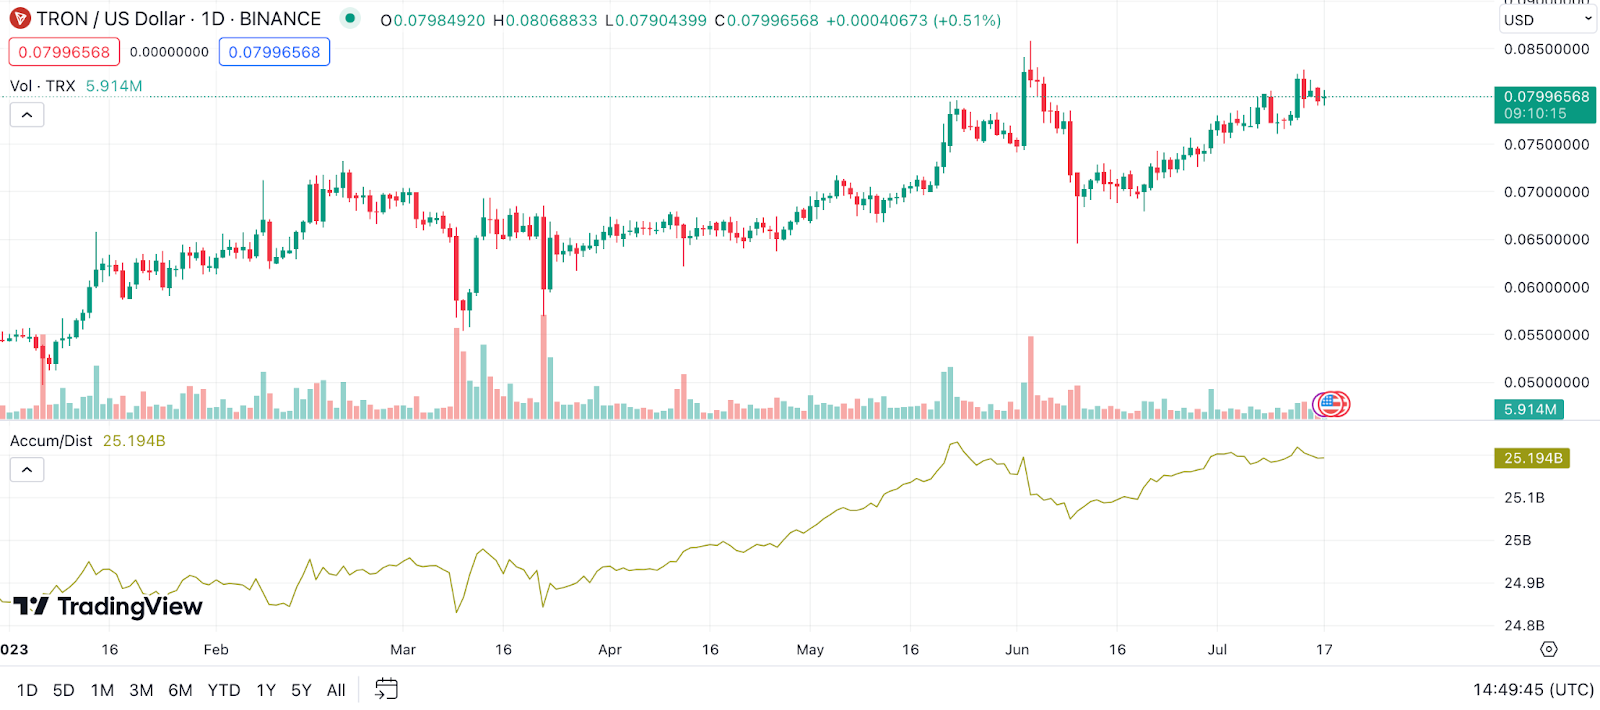
Example: To use the A/D Line in the context of TRON (TRX) price prediction, if you see the line rising, it suggests that TRON is being accumulated, as most of the trading volume is associated with upward price movement. On the flip side, if the line is falling, it indicates that TRON is being distributed, as most of the trading volume is associated with downward price movement. It’s a simple yet effective way to see whether the coin is being accumulated or distributed at a given time.
Pivot Points for TRON Price Prediction
Pivot Points are technical analysis indicators used to determine the overall trend of the market over different time frames. The pivot points are calculated using the previous day’s high, low, and close prices.
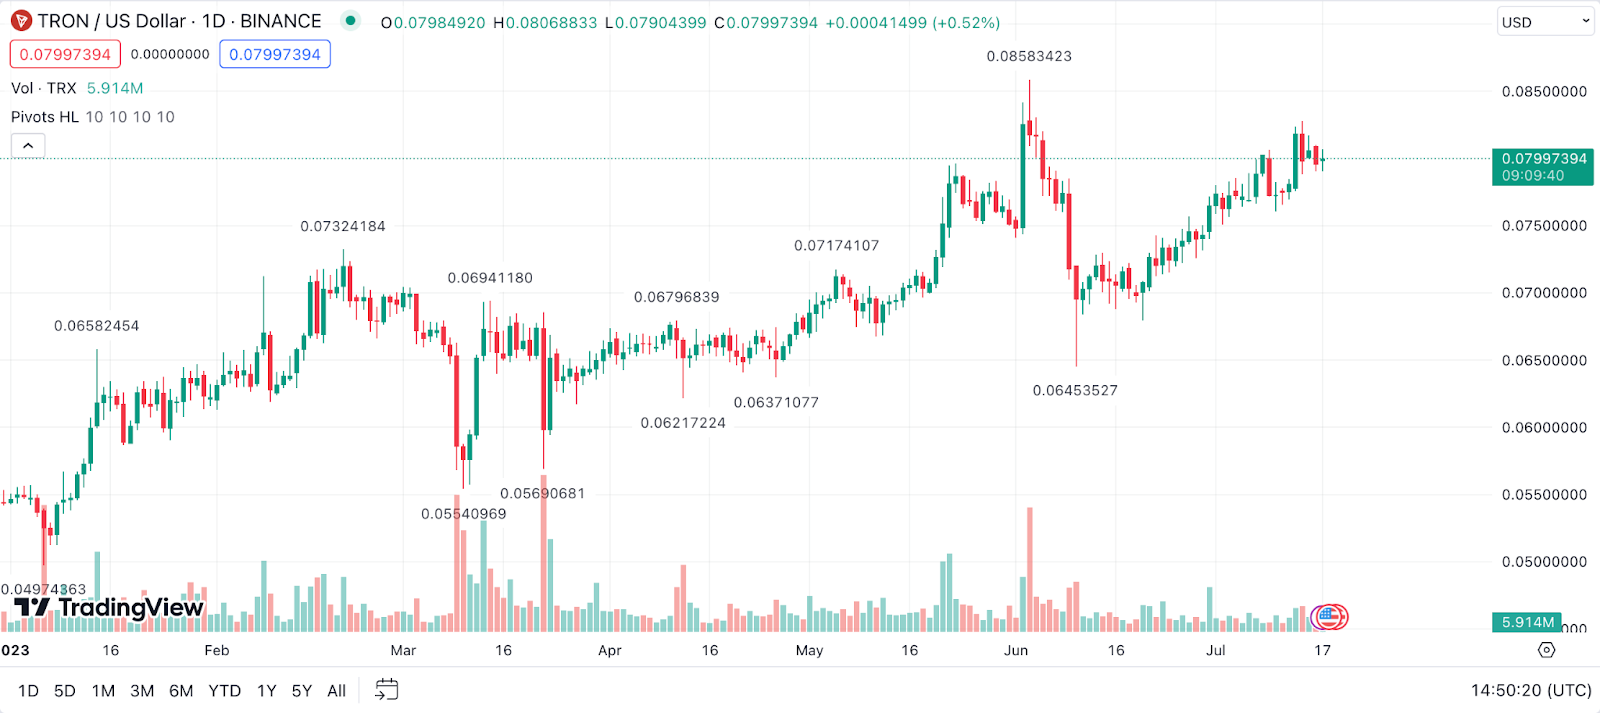
Example: To apply this to TRON (TRX) price prediction, if the price of TRON is above the pivot point, it could be considered bullish – a positive sentiment. If it’s below the pivot point, it could be seen as bearish – a negative sentiment. It gives you a quick glance at how the market is feeling at a given moment.
Chaikin Money Flow (CMF) for TRON Price Prediction
Chaikin Money Flow (CMF) is another technical analysis tool developed by Marc Chaikin. CMF measures the amount of Money Flow Volume over a specific period. Money Flow Volume forms the basis for the Accumulation Distribution Line. Instead of a cumulative line, Chaikin Money Flow sums Money Flow Volume for a specific look-back period, typically 20 or 21 days.
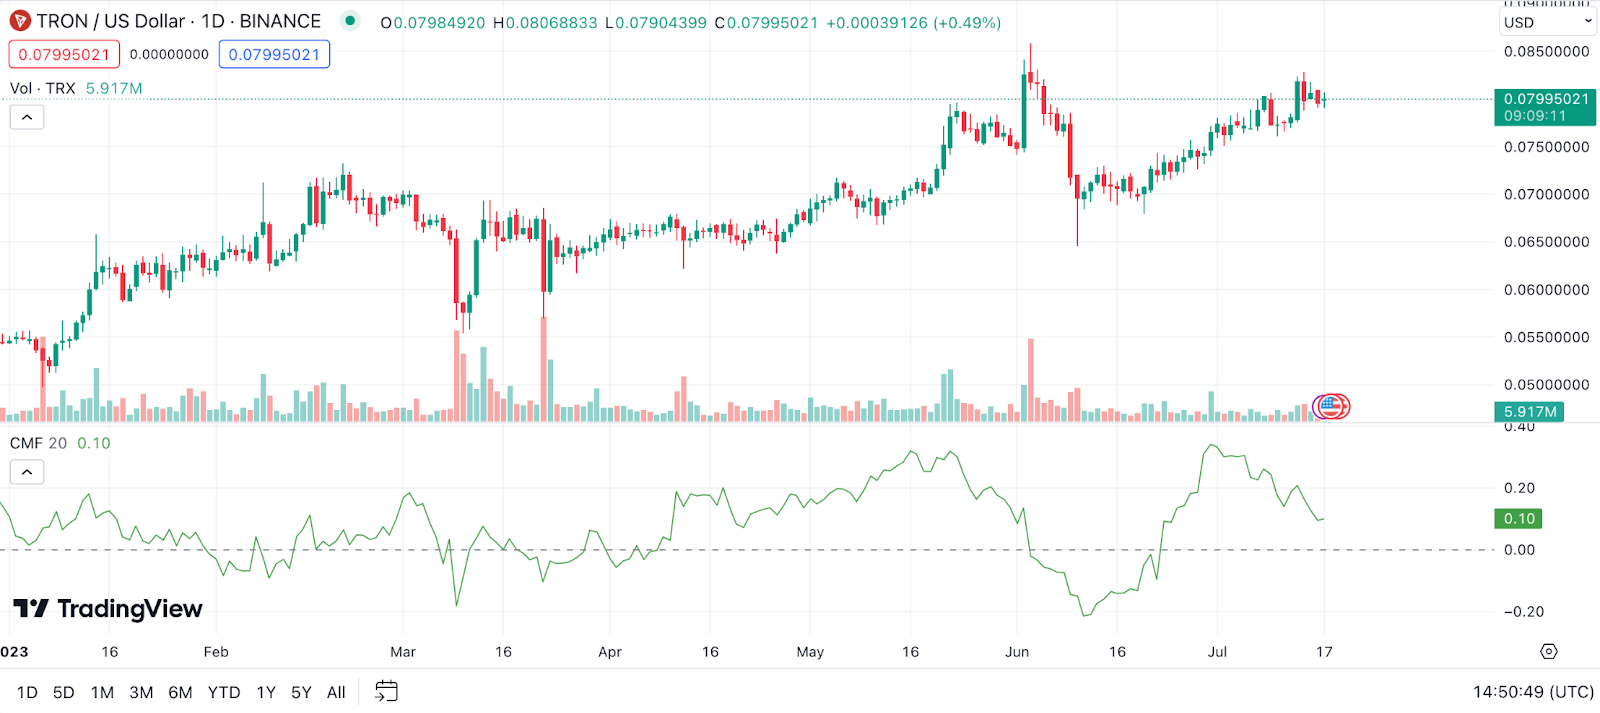
Example: In the context of TRON coin price prediction, a positive CMF would indicate buying pressure and a possible bullish sentiment, while a negative CMF would point to selling pressure and potentially bearish sentiment. If you see a divergence between the price trend of TRON and CMF, it could signal a future price reversal. For example, if the price of TRON is trending upwards, but the CMF is trending downwards, it may suggest that the upward trend is losing strength and a price reversal could be imminent.
Aroon Indicator for TRON Price Prediction
The Aroon Indicator, developed by Tushar Chande, helps to identify whether a price is trending or not and how strong the trend is. It consists of the “Aroon up” line, which measures the strength of the uptrend, and the “Aroon down” line, which measures the strength of the downtrend.

Example: Imagine we’re tracking TRX coin price prediction. If the Aroon up is above the Aroon down, it indicates bullish (upward) momentum. Conversely, if the Aroon down is above the Aroon up, it shows bearish (downward) momentum. If the lines cross, it could signal a trend change. So, the Aroon Indicator provides valuable insight into trend strength and direction.
Gann Fan for TRON Price Prediction
The Gann Fan is a technical analysis tool created by W.D. Gann. This tool is based on the premise that markets rotate from an important low or high at a consistent rate. These consistent rates are angles represented within the Gann Fan.
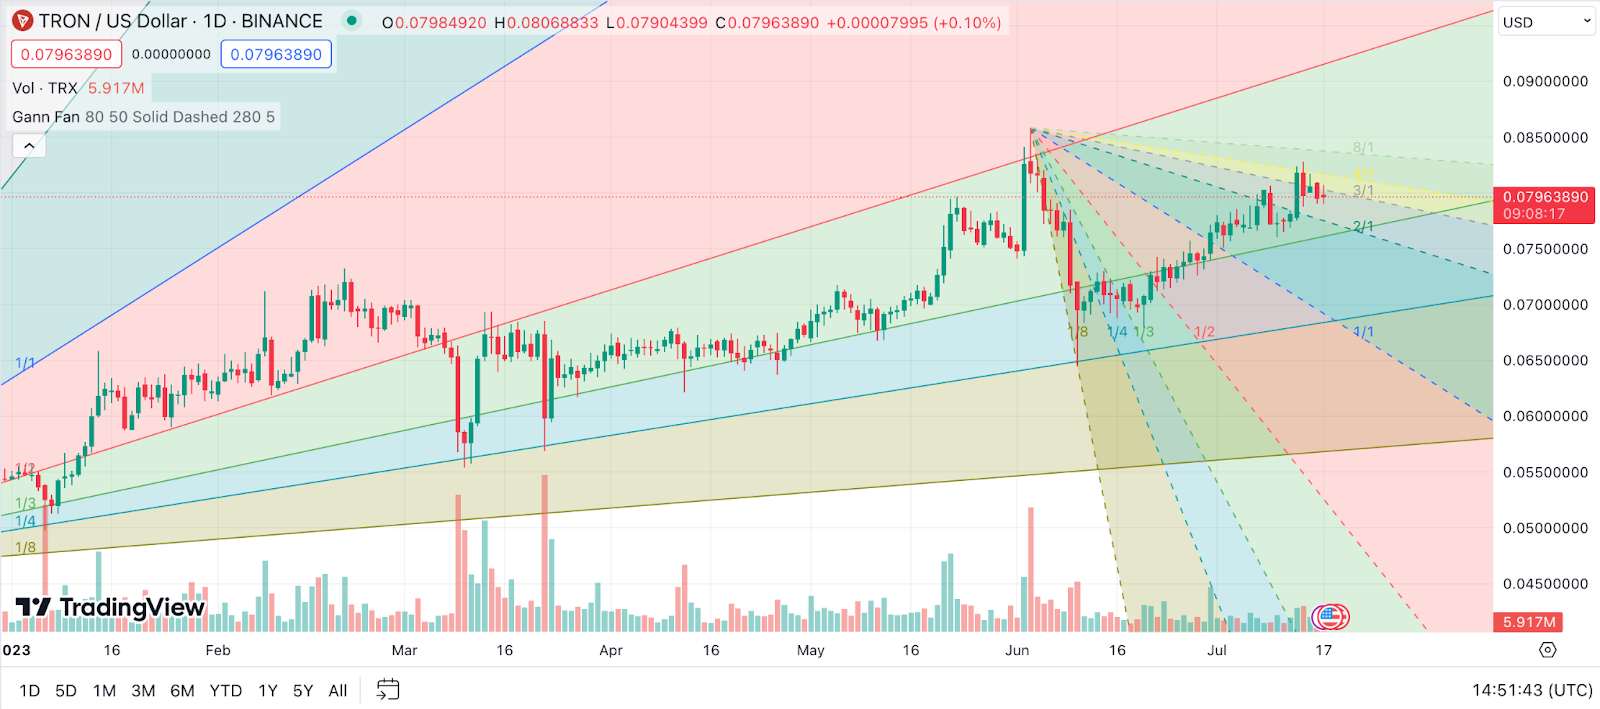
Example: When using the Gann Fan to analyze TRX price prediction, we would plot the fan from a significant high or low on the chart. The resulting diagonal lines can help predict potential support and resistance levels. For instance, if TRON (TRX) price falls and then starts to rise when it hits a line of the Gann Fan, this could suggest that this line is acting as a support level.
Keltner Channel for TRON Price Prediction
Keltner Channels, developed by Chester W. Keltner, are volatility-based envelopes set above and below an exponential moving average. This indicator is similar to Bollinger Bands, which use the standard deviation to set the bands.

Example: In the case of TRON price predictions, if it moves towards the upper line of the Keltner Channel, it might be considered overbought and due for a price correction or reversal. If it moves towards the lower line, TRON could be oversold and might rebound. Therefore, the Keltner Channel can provide both trend and volatility information for TRON traders.
Money Flow Index (MFI) for TRON Price Prediction
The Money Flow Index (MFI) is a momentum indicator that measures the inflow and outflow of money into a security over a specific period. It is related to the Relative Strength Index (RSI) but incorporates volume, whereas the RSI only considers price.
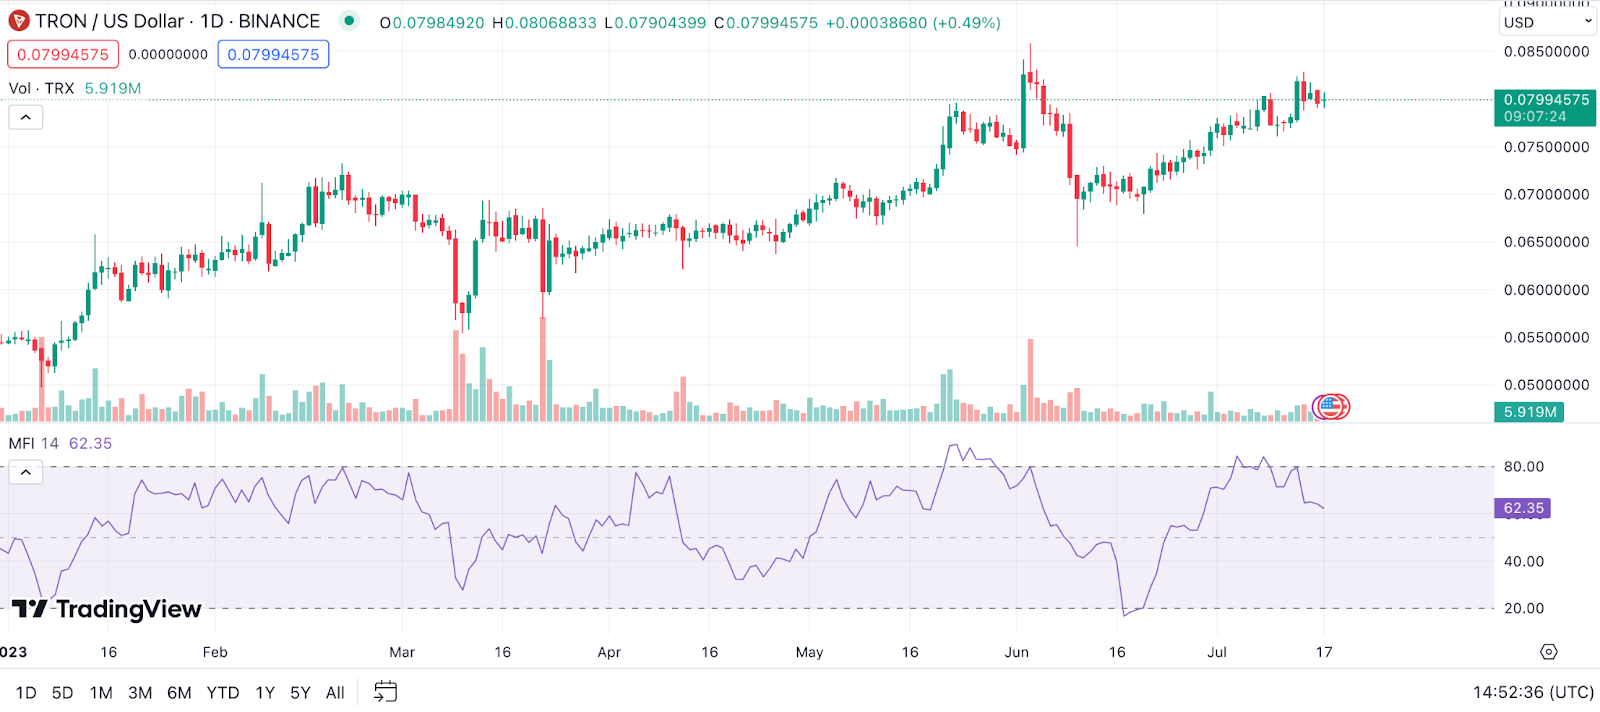
Example: Let’s consider detailed TRON price prediction. If its MFI is over 80, it might be overbought, suggesting that there could be a price pullback. Conversely, an MFI under 20 might mean TRON is oversold, implying the potential for a price bounce back. This way, the MFI can help TRON traders identify potential price reversals.
TRIX for TRON Price Prediction
The TRIX is a momentum oscillator that displays the percent rate of change of a triple exponentially smoothed moving average of a security’s closing price. Its primary purpose is to identify price trends and potential reversal points.
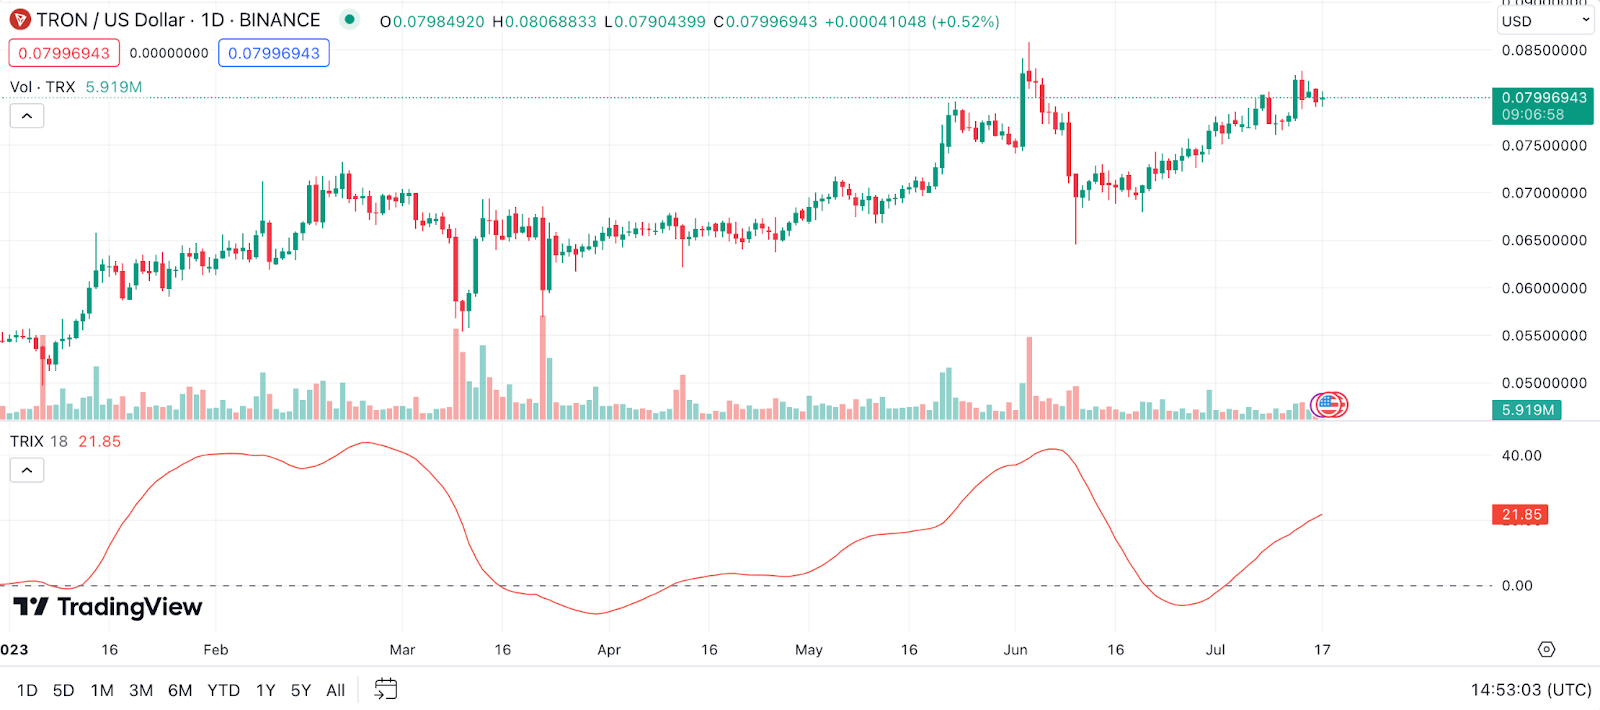
Example: If we apply TRIX to TRON price predictions, a positive TRIX reading suggests an upward trend, while a negative one indicates a downward trend. If the TRIX line crosses the zero line, it can be a signal of a trend reversal. In this regard, the TRIX can be a helpful tool to confirm TRON price trends and spot potential reversals early.
The Zig Zag Indicator for TRON Price Prediction
The Zig Zag indicator is a trend following indicator that highlights significant trends. It ignores minor price changes and instead focuses on significant price moves, both up and down.
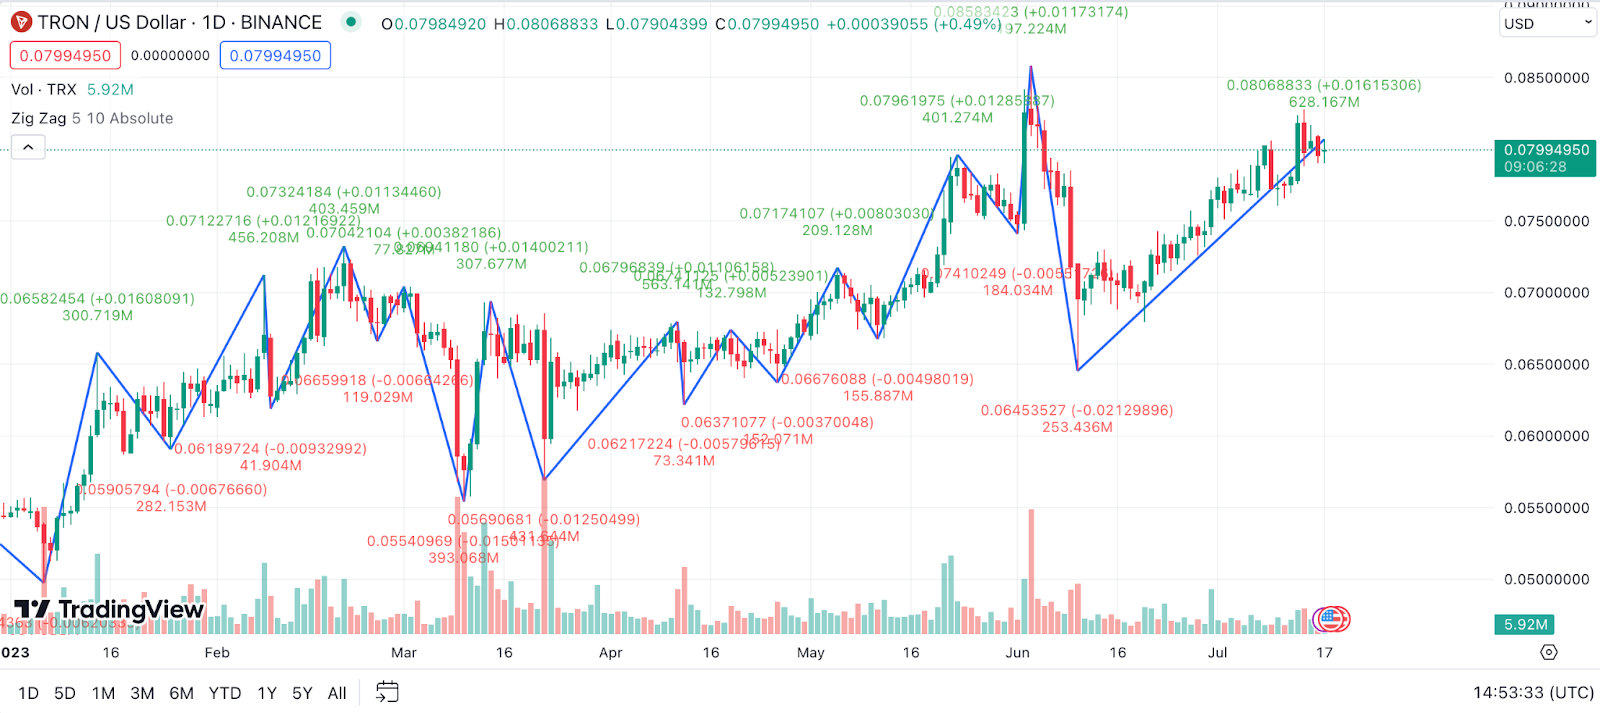
Example: In the context of current TRON price prediction, the Zig Zag indicator could be used to identify significant peaks and troughs in the price. The indicator would draw lines on the chart connecting significant up and down moves. The Zig Zag lines can provide a clearer picture of the overall trend, assisting TRON traders in understanding the bigger picture of price trends.
Detrended Price Oscillator (DPO) for TRON Price Prediction
The Detrended Price Oscillator (DPO) is an indicator designed to remove trend from price and make it easier to identify cycles. It does this by comparing the current price to a prior price from a chosen period.
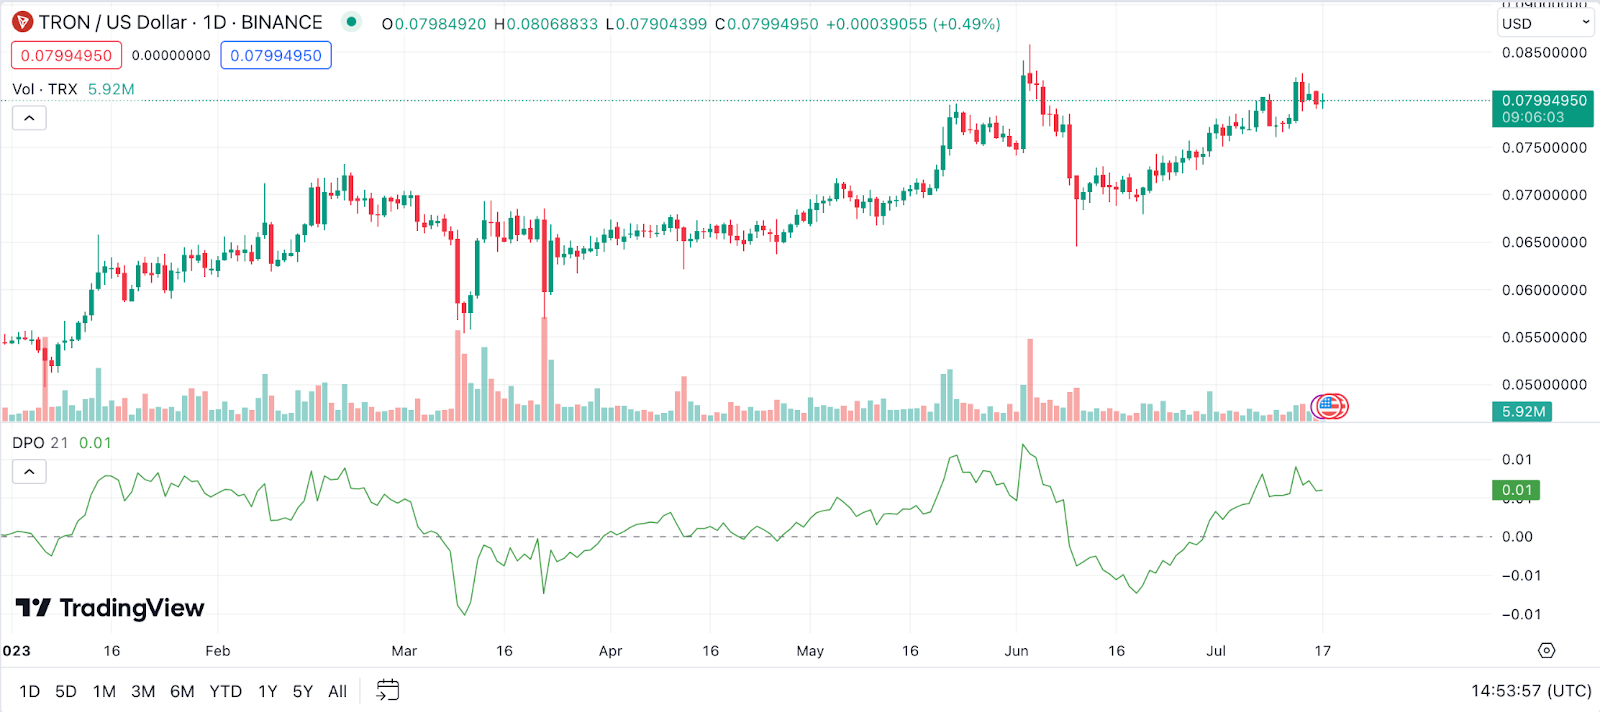
Example: When considering TRX coin price prediction, we could use DPO to identify cycles or patterns that repeat over time. For instance, if TRON (TRX) price tends to rise and fall in a predictable pattern, the DPO can help highlight these periods.
Vortex Indicator (VI) for TRON Price Prediction
The Vortex Indicator (VI) is designed to identify the start of a new trend or the continuation of an existing trend within a market. It does this by comparing the highs and lows of two periods and then creating two output lines.

Example: If we apply the Vortex Indicator to TRON price predictions, it would show two oscillating lines. When the positive VI (VI+) crosses above the negative VI (VI-), it could indicate a potential start of a bullish trend for TRON. Conversely, a cross of the VI- over the VI+ may suggest a possible bearish trend.
Elder’s Force Index (EFI) for TRON Price Prediction
The Elder’s Force Index (EFI) is an indicator that uses price and volume to assess the power behind a move or to affirm a trend. It can also identify potential reversals and price corrections.

Example: If we take TRON as an example, a rising EFI suggests increasing buying pressure, which could support an ongoing bullish trend or indicate a possible upward reversal if TRON is in a downtrend. Conversely, a falling EFI might imply growing selling pressure, possibly affirming a bearish trend or hinting at a downward reversal if TRON is in an uptrend.
Williams %R for TRON Price Prediction
Williams %R, also known as the Williams Percent Range, is a type of momentum indicator that moves between 0 and -100 and measures overbought and oversold levels.
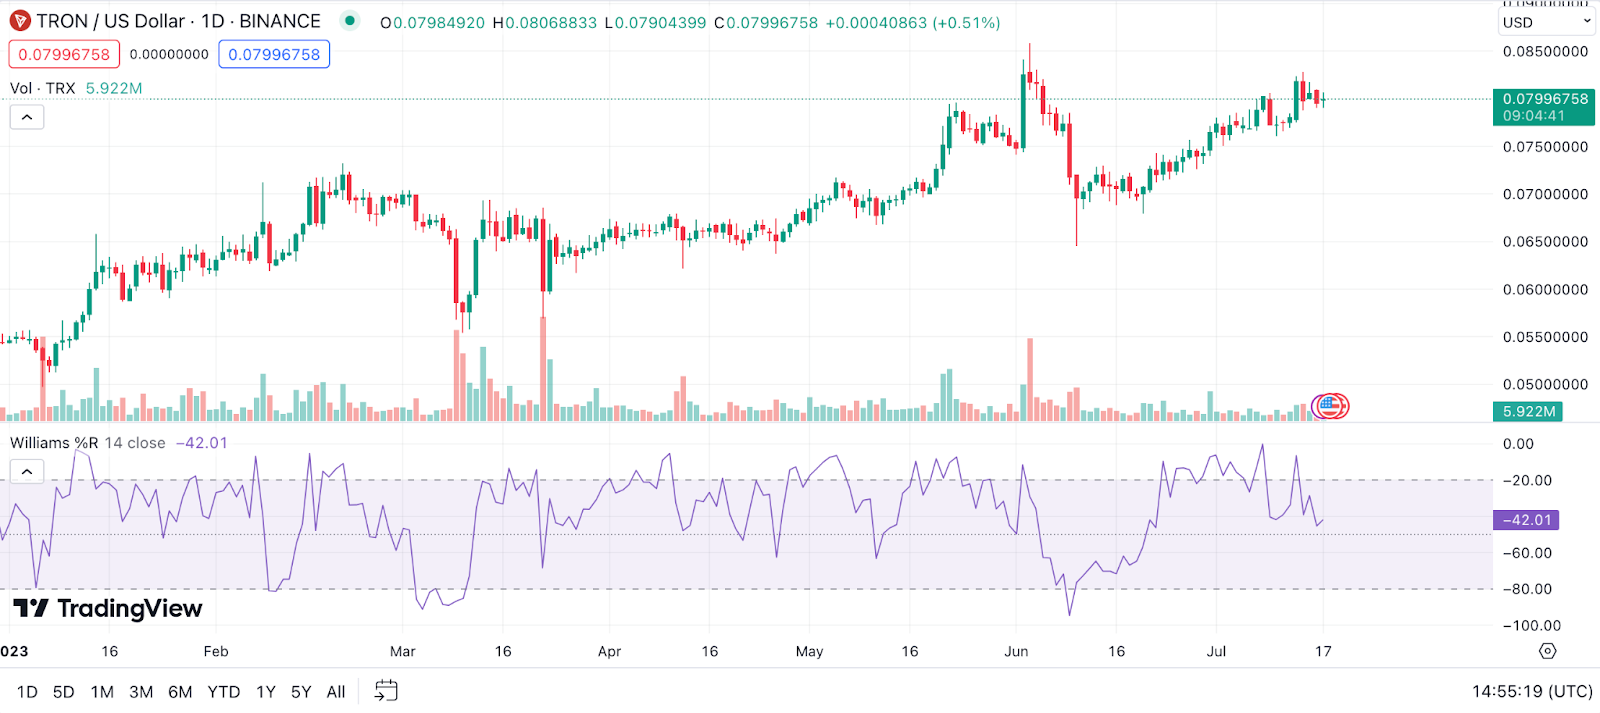
Example: In the case of TRX price prediction, if the Williams %R line dips below -80, it indicates that TRON might be oversold and potentially due for a price bounce back. Conversely, if the Williams %R rises above -20, it signifies that TRON may be overbought and a price pullback might be on the cards. Thus, Williams %R can assist TRON traders in spotting potential reversal points.
Combining Technical Indicators for Accurate TRON Price Prediction
If you’ve ever tried to predict the price of TRON using technical indicators, you might have realized that relying on just one tool can sometimes lead to faulty conclusions. Technical indicators are like pieces of a puzzle, each revealing a different aspect of the market. To get the full picture, it’s often best to combine them.
The Importance of Using Multiple Technical Indicators in TRON Price Predictions
When we rely on a single indicator, we run the risk of missing out on essential information. Different indicators can highlight various elements of market behavior, such as trend direction, momentum, volatility, and volume. It’s like hearing a story from different perspectives – the more views we consider, the better we understand the narrative. When it comes to TRON (TRX) price, multiple indicators can help us interpret the many factors influencing its movement.
For instance, let’s take a situation where the Relative Strength Index (RSI) shows TRON is oversold. On its own, this could indicate a potential buying opportunity. But what if our MAs are still trending downwards? That might suggest the downtrend is not over yet. By considering both indicators, we get a more nuanced view of the market conditions.
How to Combine Various Indicators for TRON Price Predictions
So, how can we effectively combine different indicators for TRON price analysis? Here are a few tips:
- Use Indicators from Different Categories: Different categories of indicators provide different types of information. Trend indicators, like MAs, reveal the direction of the market, while momentum indicators, like RSI, can signal the strength of the trend. Volume indicators, like the On Balance Volume (OBV), show the power behind the trend. By selecting indicators from different categories, you get a well-rounded view of the market.
- Look for Confluence: Confluence occurs when two or more indicators give the same signal. For example, if both RSI and the Bollinger Bands indicate that TRON is oversold, it strengthens the case for a potential price reversal.
- Be Mindful of Redundancy: While using multiple indicators is useful, be careful not to use several that tell you the same thing. Too many similar indicators can lead to “analysis paralysis,” where you overanalyze the situation and struggle to make a decision.
- Consider the Timeframe: Different indicators may work better on different timeframes. For instance, MAs might be more useful on longer timeframes, while oscillators like RSI can be handy on shorter ones. When analyzing TRON (TRX) price, consider what timeframe your analysis is targeting and choose your tools accordingly.
Remember, though, that no matter how many indicators you use, no tool can predict market movements with 100% accuracy. The aim is not to find a fail-safe prediction method, but rather to increase the probability of making a correct market judgment. Combining multiple technical indicators is one strategy that can help you achieve this goal in your TRON trading journey.
The Pillars of TRON Price Predictions: Fundamental Factors
Just like our bodies can’t function without the spine, technical analysis isn’t complete without a backbone of fundamental factors. If we think about the entire crypto landscape, these fundamentals are some of the driving forces that give technical indicators their substance. So, let’s dive into some crucial fundamental aspects to consider when predicting TRON (TRX) price.
Adoption Rate
When it comes to TRON, adoption rate is one key factor to consider. In essence, the adoption rate reflects how widely TRON is being used, whether it’s being incorporated into various platforms or if the number of transactions is increasing.
Some key metrics to gauge TRON’s adoption rate include:
- Number of Active Addresses: This is one of the most direct indicators of network usage. An increase in active addresses shows that more people are using the TRON network, indicating higher adoption.
- Transaction Volume: The volume of TRX being sent over the network is a valuable measure of adoption. Higher transaction volumes often correlate with increased utility and adoption. This, however, should be analyzed in conjunction with transaction fees, as high fees can sometimes discourage network use.
- Network Partnerships: TRON’s partnerships can have a significant impact on its adoption rate. Businesses and platforms that accept TRX as a form of payment or integrate with the TRON network can increase its exposure and usability.
- DApps on TRON: The number and usage of decentralized applications (DApps) on the TRON network can be a good indicator of adoption. TRON’s ability to attract developers to build on its platform indicates the network’s utility and potential for future growth.
- Coin Distribution: A more distributed supply of TRX might indicate a wider user base. A concentration of coins in a small number of addresses, on the other hand, might point to centralization, which could discourage new users.
- Community Growth: The size and activity of TRON’s community, as evidenced by social media followers, Reddit subscribers, or forum posts, can also be a good indicator of its adoption. A growing and engaged community often reflects a healthy adoption rate.
- Exchange Listings: The number of exchanges where TRX is listed and its trading pairs can also impact its adoption. The easier it is to acquire TRX, the more likely it is to be adopted.
Regulatory Developments
Regulatory developments can heavily influence any cryptocurrency’s price, including TRON. Governments around the world are still figuring out how to regulate cryptocurrencies, and their decisions can have significant impacts.
Some examples of regulatory changes and their potential impact include:
- Cryptocurrency Regulations in Key Markets: As TRON continues to grow in popularity, it will likely face increased scrutiny from regulators in key markets such as the United States, the European Union, China, and South Korea. Regulatory approval in these markets can significantly boost TRON’s credibility and adoption, while regulatory crackdowns could limit its growth.
- Securities Regulations: If regulators in any jurisdiction were to classify TRX as a security, this could significantly impact its accessibility and value. Cryptocurrencies classified as securities must comply with a stringent set of rules and are typically less accessible to retail investors.
- AML and KYC Regulations: Increasingly, regulators worldwide are implementing anti-money laundering (AML) and know your customer (KYC) regulations for cryptocurrencies. While these measures can bring more legitimacy to the sector, they can also create barriers to entry that might impact TRON’s adoption rate.
- Taxation Policies: The way cryptocurrencies are taxed can also impact their use. If tax policies are favorable, they could encourage more people to hold and use TRX. On the other hand, unfavorable tax treatment could discourage people from buying and using it.
- ICO and DeFi Regulations: TRON has a vibrant ecosystem of decentralized applications (DApps), many of which have been launched through initial coin offerings (ICOs) or operate in the decentralized finance (DeFi) space. New regulations affecting ICOs or DeFi could impact these DApps and, by extension, TRON.
- Legal Recognition of Cryptocurrencies: Legal recognition of cryptocurrencies as a form of payment, property, or financial instrument can greatly impact their adoption and value. Positive legal status in influential jurisdictions could lend more credibility to TRON, increasing its adoption.
Utility
The utility of a cryptocurrency is paramount in its long-term success. TRON isn’t just a digital asset; it’s a whole ecosystem that’s designed to revolutionize the way we interact with digital content. Its native token, TRX, has numerous applications within and beyond the TRON network.
Here are some of the many real-world use cases of TRON:
- Content Sharing: One of the primary objectives of TRON is to create a decentralized internet. In this regard, it allows content creators to share their content directly with consumers, eliminating the need for intermediaries like Google Play or the App Store. This freedom encourages a diverse range of content creation and direct profit to creators.
- In-App Purchases: TRX is not just a tradable asset; it’s also a medium of exchange within numerous DApps and online games. The gamers and users can use TRX for in-app purchases, expanding its real-world use cases.
- Decentralized Exchanges: TRON’s blockchain has been designed to support a robust ecosystem of decentralized exchanges (DEXs). On these DEXs, users can trade TRX directly for other tokens. This direct, peer-to-peer exchange system improves liquidity and accessibility for traders.
- Data Liberation: In a world where data privacy is a growing concern, TRON’s mission is to liberate data. It aims to decentralize the web and give control of data back to users, presenting an alternative to platforms that sell user data for profit. By providing users with ownership of their data, TRON stands out from traditional social media and data-sharing platforms.
- Token Creation: The TRON network provides a platform for developers to create their own tokens, fostering a diverse ecosystem of DApps. This attribute not only enhances the utility of TRON but also promotes innovation and development within its ecosystem.
- DeFi Applications: As the DeFi sector continues to grow, so does the potential utility of TRON. It provides a platform for a range of DeFi applications, from lending and borrowing platforms to yield farming and liquidity mining programs. These applications are giving rise to new opportunities for users to earn passive income and engage in decentralized finance.
- Staking and Governance: TRX holders can participate in the TRON network’s governance by staking their tokens. Staking TRX allows users to vote on various proposals, including transaction fee adjustments and block size changes. Additionally, staking TRX offers an incentive model, giving users the opportunity to earn rewards for their participation.
Market Sentiment: How TRON Price Prediction Forecasts Work
Market sentiment is the overall attitude of investors towards a particular security or financial market. It’s what drives demand, and by extension, the price of an asset. When it comes to predicting the price of TRON (TRX), gauging market sentiment can be a valuable tool. Here are some factors and tools that can be used to assess market sentiment for TRON:
- Social Media Monitoring: Platforms like Twitter, Reddit, and various crypto-specific forums are a hotbed for investor sentiment. Paying attention to the conversation around TRON on these platforms can provide insight into how the community feels about the coin. Are the conversations mostly positive, negative, or neutral? These can all impact investor sentiment and, subsequently, the price of TRON.
- News Outlets: Crypto news outlets often report on TRON’s developments, partnerships, or any significant changes in its ecosystem. Positive news can result in increased investor confidence and a potential increase in TRX coin price, while negative news can lead to a decrease in investor confidence and a potential drop in TRON coin price.
- Google Trends: Google Trends is a useful tool for assessing public interest in TRON over time. A spike in TRON-related searches may indicate growing interest in the coin, which could translate to increased buying pressure.
- Exchange Data: Trading volume on exchanges can give a sense of the momentum behind TRON (TRX) price movement. A significant change in volume could indicate a strong market sentiment towards TRX coin. For instance, a sharp increase in TRX’s trading volume often accompanies significant price increases.
- Crypto Fear & Greed Index: This index measures the sentiment of the entire cryptocurrency market by analyzing volatility, market momentum and volume, social media trends, surveys, and dominance. Although it’s not TRON-specific, it can provide a sense of the general market sentiment, which can indirectly impact TRX token.
- Sentiment Analysis Tools: These tools use AI and machine learning to analyze social media posts, news articles, and other textual content to determine the sentiment towards a particular cryptocurrency. Services like The TIE or Santiment provide sentiment scores for various cryptocurrencies, including TRON.
- TRON’s Official Announcements: TRON’s official social media accounts and website are often the first to report on major developments within the TRON ecosystem. These can significantly impact market sentiment, especially if they involve substantial changes or improvements to the network.
These pillars of fundamental analysis, combined with technical indicators, can provide a comprehensive framework for predicting TRON price. Remember, though, no method is foolproof. Price predictions are, at best, educated guesses, not certainties. Always do your own research and consider multiple factors before making trading decisions.
The Bottom Line: Making Your Own TRON Price Predictions
As we pull the curtain on our exploration into a detailed TRON price prediction, I hope you’ve found the journey insightful. We’ve traversed the landscapes of expert opinions, technical analysis intricacies, and delved into the crucial pillars of fundamental analysis TRON. All these are pieces of a much larger puzzle that shapes the trajectory of TRX’s future.
Remember, predicting cryptocurrency prices is not an exact science; it’s a blend of educated guesses, calculated risks, and a dash of gut instinct. Keep your wits about you, stay informed, and here’s to hoping your crypto adventures be fruitful!
FAQ
When Will TRON Go Up?
That’s the million-dollar question, isn’t it? Like any cryptocurrency, TRON (TRX) price today is influenced by many factors, including market trends, investor sentiment, and broader economic factors. While no one can predict with absolute certainty, market indicators and expert predictions suggest TRON could see growth in the coming years. Remember, though, always do your own research before investing.
Should I Buy TRX?
As an advisor, I can’t tell you definitively whether to buy TRX or not, because that decision depends on your personal financial situation, your risk tolerance, and your investment goals. What I can tell you is that TRX has shown potential in the past and it has a solid technology backing it up. Conduct thorough research, and perhaps consult with a financial advisor, before making your decision.
How High Can TRON (TRX) Go?
The sky’s the limit in the world of cryptocurrencies! But to be grounded, predicting the exact height TRON can reach is challenging due to the volatile nature of cryptocurrencies. Expert predictions and technical analyses suggest a potential for growth, but as always, these should not be the only factors in your investment decisions.
Will TRX Crash Again in 2024?
Predicting crashes in the crypto market can be as tricky as predicting bull runs. Cryptocurrencies are known for their volatility, and TRX is no exception. While it’s possible TRX could experience a downturn in 2024, it’s equally possible it could rise. Factors such as regulatory changes, market sentiment, and broader economic factors will play significant roles.