Hello, dear readers! As the world of cryptocurrency evolves and expands, it’s essential to stay informed about the potential trajectory of major players. One such standout is Tezos, and that’s why today we’re diving deep into the topic of Tezos price prediction. Predicting the XTZ price isn’t a walk in the park; it’s intricate and influenced by countless variables. To give you a clearer picture, we’ll journey through Tezos’ history, exploring its origins and purpose.
Now, you might wonder, why is predicting the XTZ coin’s value such a big deal? Simply put, knowledge is power. An accurate forecast can be the difference between making a fruitful investment and missing out on an opportunity. By understanding trends and patterns, one can potentially strategize better in the unpredictable world of cryptocurrency.
So, are you intrigued yet? We’ve laid out a comprehensive analysis for you. Dive in and unravel the potential future of XTZ with us. Your next insightful read awaits!
Tezos (XTZ) Overview
| XTZ Price | $0.5307 |
| XTZ Price Change 24h | -1.29% |
| XTZ Price Change 7d | 1.08% |
| XTZ Market Cap | $557,062,737.96 |
| XTZ Circulating Supply | 1,049,718,175.58 |
| XTZ Trading Volume | $10,951,548.58 |
| XTZ All-Time High (ATH) | $9.18 |
| XTZ All-Time Low (ATL) | $0.3146 |
A Brief History: Tezos and Its Purpose
Tezos, often flying under the radar amid the crypto giants, has an intriguing story worth delving into. This decentralized blockchain promises to make old-school contracts on its platform safer through its unique proof-of-stake consensus mechanism. Unlike many other blockchains, Tezos was designed with the primary purpose of reducing the risks associated with upgrading or modifying the system. It offers a built-in process for its users to vote on amendments to the protocol, making it a democratic and evolving entity in the fast-paced world of digital currencies.
Established by Arthur and Kathleen Breitman, this project stemmed from a vision of creating a cryptocurrency platform where the very rules governing it could be changed without the notorious “hard forks.” This philosophy of adaptability, combined with a commitment to creating a genuinely decentralized ecosystem, quickly caught the attention of many investors during its Initial Coin Offering (ICO) phase. For anyone dabbling in cryptocurrencies, understanding the past of Tezos provides valuable insight, especially if you’re aiming to crack the code behind the Tezos price prediction.
Most Notable XTZ Price Shifts
The price of Tezos has experienced a rollercoaster ride since its inception. To provide you with a clearer picture, here’s a list capturing some of its defining moments:
- The ICO Hype: Its Initial Coin Offering in 2017 raked in a whopping $232 million, making it one of the largest ICOs at the time.
- Post-ICO Slump: After the ICO, its value experienced a decline, mirroring the general crypto market’s bearish trend.
- 2020 Resurgence: Tezos saw a significant upswing in 2020, ranking among the top 10 cryptocurrencies by market capitalization.
- Periodic Peaks and Valleys: Like many cryptos, Tezos experienced periodic highs and lows, reacting to global economic situations, regulatory news, and internal developments.
Tezos – XTZ Price Prediction For Today, Tomorrow, This Week, and Next 30 Days
| Date | Price | Change |
|---|---|---|
| July 06, 2025 | 0.5345 | 0.71% |
| July 07, 2025 | 0.5393 | 0.90% |
| July 08, 2025 | 0.5440 | 0.87% |
| July 09, 2025 | 0.5446 | 0.12% |
| July 10, 2025 | 0.5472 | 0.47% |
| July 11, 2025 | 0.5459 | -0.23% |
| July 12, 2025 | 0.5416 | -0.79% |
| July 13, 2025 | 0.5453 | 0.68% |
| July 14, 2025 | 0.5501 | 0.89% |
| July 15, 2025 | 0.5454 | -0.86% |
| July 16, 2025 | 0.5451 | -0.06% |
| July 17, 2025 | 0.5443 | -0.15% |
| July 18, 2025 | 0.5473 | 0.55% |
| July 19, 2025 | 0.5440 | -0.60% |
| July 20, 2025 | 0.5420 | -0.36% |
| July 21, 2025 | 0.5381 | -0.72% |
| July 22, 2025 | 0.5420 | 0.72% |
| July 23, 2025 | 0.5423 | 0.05% |
| July 24, 2025 | 0.5437 | 0.27% |
| July 25, 2025 | 0.5438 | 0.01% |
| July 26, 2025 | 0.5388 | -0.91% |
| July 27, 2025 | 0.5429 | 0.76% |
| July 28, 2025 | 0.5467 | 0.70% |
| July 29, 2025 | 0.5514 | 0.85% |
| July 30, 2025 | 0.5481 | -0.60% |
| July 31, 2025 | 0.5466 | -0.27% |
| August 01, 2025 | 0.5488 | 0.41% |
| August 02, 2025 | 0.5493 | 0.08% |
| August 03, 2025 | 0.5532 | 0.72% |
| August 04, 2025 | 0.5583 | 0.91% |
Tezos Price Prediction 2024
Upon analyzing the projected price data for Tezos in 2024, our findings suggest a potential minimum price of $0.4776. Meanwhile, the average price is anticipated to be around $0.5572, with the possibility of reaching highs up to $0.6368.
From our perspective, Tezos 2024 forecast appears stable, displaying moderate growth potential. The fairly consistent price projection implies that we might not witness any drastic market fluctuations. However, for those risk-takers among you, this might be a golden opportunity for notable returns, especially considering the inherent volatility associated with Tezos.
A word of advice for our fellow crypto aficionados: tread carefully. It’s essential to conduct thorough own research and due diligence before diving into any investment, especially within the ever-volatile crypto arena.
| Month | Minimum Price | Average Price | Maximum Price |
|---|---|---|---|
| February 2024 | 0.9582 | 0.9951 | 1.0359 |
| March 2024 | 0.9841 | 1.0219 | 1.0638 |
| April 2024 | 1.0107 | 1.0495 | 1.0925 |
| May 2024 | 1.0380 | 1.0779 | 1.1220 |
| June 2024 | 1.0660 | 1.1070 | 1.1523 |
| July 2024 | 1.0948 | 1.1368 | 1.1835 |
| August 2024 | 1.1243 | 1.1675 | 1.2154 |
| September 2024 | 1.1547 | 1.1991 | 1.2482 |
| October 2024 | 1.1859 | 1.2314 | 1.2819 |
| November 2024 | 1.2179 | 1.2647 | 1.3165 |
| December 2024 | 1.2508 | 1.2988 | 1.3521 |
| January 2025 | 1.2845 | 1.3339 | 1.3886 |
January 2024: Tezos Price Forecast
As we embark on a new year, the forecasting models suggest a sturdy beginning for Tezos with a minimal price of $0.8724, an average hovering around $0.9582, and a potential spike to a maximum price of $0.9951. This indicates a bullish outset for investors, suggesting that XTZ’s fundamentals are gaining solid ground within the crypto community.
XTZ Price Forecast for February 2024
As February rolls in, we’re seeing a distinct upward trajectory in Tezos prices. The minimum price is set to hover around $0.9582, with an average that’s expected to settle at $0.9951. Notably, the maximum price could reach an impressive $1.0359, indicating a bullish market sentiment. These numbers reflect a growing confidence among crypto enthusiasts in XTZ’s potential.
March 2024: Tezos Price Forecast
March appears to continue the positive trend with Tezos prices pushing further up the chart. We anticipate the minimum price to be around $0.9841, suggesting a solid floor beneath. The average price is projected to cross the psychological threshold of 1 at $1.0219, while the maximum price could see a peak at $1.0638. This consistent growth could be a sign of market stability and increasing investor interest.
XTZ Price Forecast for April 2024
April’s forecast for Tezos is marked by a continuation of growth. The data points to a minimum price of $1.0107, solidifying the asset’s stance above the $1 mark. The average price is expected to climb to $1.0495, with the maximum price possibly stretching to $1.0925. This ascending pattern indicates an enduring investor confidence as springtime bullishness blooms in the crypto market.
May 2024: Tezos Price Forecast
May brings a fresh perspective on Tezos, with the numbers indicating a strengthening market. The minimum price is projected to be a robust $1.0380, which bodes well for a stable growth curve. The average price is seen reaching $1.0779, and the maximum price is expected to test new heights at $1.1220. This could be the month where seasoned investors and new entrants alike might look to solidify their positions in XTZ.
XTZ Price Forecast for June 2024
June’s forecast for Tezos showcases a sunny outlook for the summer months. A minimum price of $1.0660 suggests that the floor is rising, providing a solid base for the month. The average price is anticipated to notch up to $1.1070, with the maximum price potentially soaring to $1.1523. These figures suggest that Tezos could be gaining significant momentum.
July 2024: Tezos Price Forecast
July’s data presents a Tezos market that’s heating up, with the minimum price expected to reach $1.0948. The average price is predicted to be a healthy $1.1368, while the maximum price could escalate to $1.1835. This continued uptrend might reflect the vigorous activity in the market and could signal the start of a promising second half of the year for XTZ holders.
XTZ Price Forecast for August 2024
In August, the forecast indicates that Tezos’s growth is not taking a summer break. The minimum price is expected to stay strong at $1.1243, ensuring a good support level for the cryptocurrency. With an average price of $1.1675, investors might find a consistent path for mid-term strategies. Furthermore, a maximum price of $1.2154 could open up the field for new highs, suggesting an optimistic outlook among traders.
September 2024: Tezos Price Forecast
September brings a continuation of the bullish trend for Tezos, with the data showing no signs of a slowdown. The minimum price is set to rise to $1.1547, which could mean a stable floor for the month. The average price is expected to increase further to $1.1991, and the maximum price could reach a new zenith at $1.2482. This might indicate a strong investor trust and a potential for record-breaking performance.
XTZ Price Forecast for October 2024
October’s Tezos price forecast maintains the optimistic narrative with a minimum price projected at $1.1859. The average price could elevate to $1.2314, with the maximum price reaching for an impressive $1.2819. This continued upward trend is a clear signal to market watchers that Tezos could be shaping up for an eventful end to the year.
November 2024: Tezos Price Forecast
Come November, the Tezos market is expected to stay on its upward climb. The minimum price could stand firm at $1.2179, while the average price is predicted to be $1.2647. A maximum price soaring to $1.3165 could be on the cards, suggesting a potentially lucrative phase for XTZ as the year starts to wrap up.
XTZ Price Forecast for December 2024
Closing out the year, December’s forecast for Tezos continues to show positive signs. With a minimum price of $1.2508 and an average price of $1.2988, the stability and growth of XTZ look promising. The maximum price could escalate to $1.3521, possibly setting a new high for the year. Investors might view this as a bullish signal, wrapping up a year of significant growth for Tezos.
Tezos Price Prediction 2025
According to our in-depth analysis, 2025 holds steady growth potential for XTZ. With a forecasted minimal price of $1.3186 and an average price sitting at $1.5644, there’s room for growth. On the optimistic side of things, Tezos might reach a commendable maximum price of $1.8606. Given these projections, traders should be primed for an eventful year.
| Month | Minimum Price | Average Price | Maximum Price |
|---|---|---|---|
| February 2025 | 1.3186 | 1.3693 | 1.4254 |
| March 2025 | 1.3542 | 1.4063 | 1.4639 |
| April 2025 | 1.3908 | 1.4442 | 1.5035 |
| May 2025 | 1.4284 | 1.4832 | 1.5440 |
| June 2025 | 1.4669 | 1.5233 | 1.5857 |
| July 2025 | 1.5065 | 1.5644 | 1.6286 |
| August 2025 | 1.5472 | 1.6066 | 1.6725 |
| September 2025 | 1.5890 | 1.6500 | 1.7177 |
| October 2025 | 1.6319 | 1.6946 | 1.7641 |
| November 2025 | 1.6759 | 1.7403 | 1.8117 |
| December 2025 | 1.7212 | 1.7873 | 1.8606 |
| January 2026 | 1.7677 | 1.8356 | 1.9108 |
Tezos Price Prediction 2026
Based on the price fluctuations of XTZ, the outlook for 2026 is quite engaging. Experts project a minimal price of $1.7483, while the average price might hover around $2.0741. And for the bullish amongst us, the year could see a maximum level of $2.4668. It’s essential to remain vigilant and responsive to these predicted numbers.
| Month | Minimum Price | Average Price | Maximum Price |
|---|---|---|---|
| February 2026 | 1.7483 | 1.8154 | 1.8899 |
| March 2026 | 1.7955 | 1.8644 | 1.9409 |
| April 2026 | 1.8439 | 1.9148 | 1.9933 |
| May 2026 | 1.8937 | 1.9665 | 2.0471 |
| June 2026 | 1.9449 | 2.0196 | 2.1024 |
| July 2026 | 1.9974 | 2.0741 | 2.1591 |
| August 2026 | 2.0513 | 2.1301 | 2.2174 |
| September 2026 | 2.1067 | 2.1876 | 2.2773 |
| October 2026 | 2.1636 | 2.2467 | 2.3388 |
| November 2026 | 2.2220 | 2.3073 | 2.4019 |
| December 2026 | 2.2820 | 2.3696 | 2.4668 |
| January 2027 | 2.3436 | 2.4336 | 2.5334 |
Tezos Price Prediction 2027
Cryptocurrency experts, after meticulous research, are ready to announce their forecast for 2027. The year could see Tezos starting with a minimal price of $2.3178. The projected average price stands at $2.7498. However, the real highlight could be the potential maximum price of $3.2705. Such insights emphasize the importance of staying updated with Tezos’s market trends.
| Month | Minimum Price | Average Price | Maximum Price |
|---|---|---|---|
| February 2027 | 2.3178 | 2.4069 | 2.5056 |
| March 2027 | 2.3804 | 2.4719 | 2.5732 |
| April 2027 | 2.4447 | 2.5386 | 2.6427 |
| May 2027 | 2.5107 | 2.6071 | 2.7140 |
| June 2027 | 2.5785 | 2.6775 | 2.7873 |
| July 2027 | 2.6481 | 2.7498 | 2.8626 |
| August 2027 | 2.7196 | 2.8241 | 2.9399 |
| September 2027 | 2.7930 | 2.9003 | 3.0192 |
| October 2027 | 2.8684 | 2.9786 | 3.1008 |
| November 2027 | 2.9459 | 3.0591 | 3.1845 |
| December 2027 | 3.0254 | 3.1417 | 3.2705 |
| January 2028 | 3.1071 | 3.2265 | 3.3588 |
Tezos Price Prediction 2028
Diving deep into the Tezos landscape, 2028 might be another year of growth. The data suggests a minimal price of $3.0729. On average, the price might settle around $3.6457, with the potential to soar to a maximum price of $4.3359. For those keen on Tezos, these figures provide a roadmap for potential investment strategies.
| Month | Minimum Price | Average Price | Maximum Price |
|---|---|---|---|
| February 2028 | 3.0729 | 3.1910 | 3.3218 |
| March 2028 | 3.1559 | 3.2771 | 3.4115 |
| April 2028 | 3.2411 | 3.3656 | 3.5036 |
| May 2028 | 3.3286 | 3.4565 | 3.5982 |
| June 2028 | 3.4185 | 3.5498 | 3.6954 |
| July 2028 | 3.5108 | 3.6457 | 3.7951 |
| August 2028 | 3.6056 | 3.7441 | 3.8976 |
| September 2028 | 3.7029 | 3.8452 | 4.0029 |
| October 2028 | 3.8029 | 3.9490 | 4.1109 |
| November 2028 | 3.9056 | 4.0556 | 4.2219 |
| December 2028 | 4.0110 | 4.1651 | 4.3359 |
| January 2029 | 4.1193 | 4.2776 | 4.4530 |
Tezos Price Prediction 2029
According to the technical analysis, 2029 could be a pivotal year for Tezos. Anticipations are set with a minimal price of $4.0740. An average price of $4.8333 seems probable, but there’s an exciting possibility of Tezos touching a maximum price of $5.7484. Investors should be prepared for a dynamic year ahead.
| Month | Minimum Price | Average Price | Maximum Price |
|---|---|---|---|
| February 2029 | 4.0740 | 4.2305 | 4.4040 |
| March 2029 | 4.1840 | 4.3447 | 4.5229 |
| April 2029 | 4.2970 | 4.4621 | 4.6450 |
| May 2029 | 4.4130 | 4.5825 | 4.7704 |
| June 2029 | 4.5321 | 4.7063 | 4.8992 |
| July 2029 | 4.6545 | 4.8333 | 5.0315 |
| August 2029 | 4.7802 | 4.9638 | 5.1673 |
| September 2029 | 4.9092 | 5.0978 | 5.3069 |
| October 2029 | 5.0418 | 5.2355 | 5.4501 |
| November 2029 | 5.1779 | 5.3768 | 5.5973 |
| December 2029 | 5.3177 | 5.5220 | 5.7484 |
| January 2030 | 5.4613 | 5.6711 | 5.9036 |
Tezos Price Prediction 2030
From the troves of data we’ve gathered, 2030 looks like a year of opportunities for XTZ. The minimal price is predicted at $5.4012, with the average price nearing $6.4079. And for those who see the glass half full, there’s a potential maximum value of $7.6212. It’s vital to strategize investments based on these predictions.
| Month | Minimum Price | Average Price | Maximum Price |
|---|---|---|---|
| February 2030 | 5.4012 | 5.6088 | 5.8387 |
| March 2030 | 5.5471 | 5.7602 | 5.9964 |
| April 2030 | 5.6968 | 5.9157 | 6.1583 |
| May 2030 | 5.8506 | 6.0754 | 6.3245 |
| June 2030 | 6.0086 | 6.2395 | 6.4953 |
| July 2030 | 6.1708 | 6.4079 | 6.6707 |
| August 2030 | 6.3375 | 6.5810 | 6.8508 |
| September 2030 | 6.5086 | 6.7586 | 7.0357 |
| October 2030 | 6.6843 | 6.9411 | 7.2257 |
| November 2030 | 6.8648 | 7.1285 | 7.4208 |
| December 2030 | 7.0501 | 7.3210 | 7.6212 |
| January 2031 | 7.2405 | 7.5187 | 7.8269 |
Tezos Price Prediction 2031
Crypto analysts, after evaluating the price trends, have some compelling insights for 2031. The year might start with Tezos at a minimal price of $7.1609. The average price could be around $8.4955. And if the stars align, Tezos might reach a maximum price of $10.1040. Being armed with this knowledge could be the difference in making strategic investment decisions.
| Month | Minimum Price | Average Price | Maximum Price |
|---|---|---|---|
| February 2031 | 7.1609 | 7.4360 | 7.7409 |
| March 2031 | 7.3542 | 7.6368 | 7.9499 |
| April 2031 | 7.5528 | 7.8430 | 8.1645 |
| May 2031 | 7.7567 | 8.0547 | 8.3850 |
| June 2031 | 7.9661 | 8.2722 | 8.6114 |
| July 2031 | 8.1812 | 8.4955 | 8.8439 |
| August 2031 | 8.4021 | 8.7249 | 9.0826 |
| September 2031 | 8.6290 | 8.9605 | 9.3279 |
| October 2031 | 8.8619 | 9.2024 | 9.5797 |
| November 2031 | 9.1012 | 9.4509 | 9.8384 |
| December 2031 | 9.3469 | 9.7061 | 10.1040 |
| January 2032 | 9.5993 | 9.9681 | 10.3768 |
Tezos Price Prediction 2032
Drawing from the latest data gathered, 2032 seems promising for Tezos. The year might kick off with a minimal price of $9.49. Meanwhile, an average price of $11.26 is on the horizon, and for those with an optimistic lens, a high of $13.40 could be within reach. As always, being in tune with market shifts is crucial.
| Month | Minimum Price | Average Price | Maximum Price |
|---|---|---|---|
| February 2032 | 9.49 | 9.86 | 10.26 |
| March 2032 | 9.75 | 10.12 | 10.54 |
| April 2032 | 10.01 | 10.40 | 10.82 |
| May 2032 | 10.28 | 10.68 | 11.12 |
| June 2032 | 10.56 | 10.97 | 11.42 |
| July 2032 | 10.85 | 11.26 | 11.73 |
| August 2032 | 11.14 | 11.57 | 12.04 |
| September 2032 | 11.44 | 11.88 | 12.37 |
| October 2032 | 11.75 | 12.20 | 12.70 |
| November 2032 | 12.07 | 12.53 | 13.04 |
| December 2032 | 12.39 | 12.87 | 13.40 |
| January 2033 | 12.73 | 13.22 | 13.76 |
The Main Questions Of Critical Thinking When We Talk About Tezos Price Forecast
Tezos, like any other digital currency, is influenced by a myriad of factors, both internal and external. Before making decisions based on any Tezos price forecast, it’s prudent to pose some critical questions. These questions not only guide us in understanding the intricacies of the forecast but also ensure that we don’t fall prey to unfounded hype or unwarranted panic.
- What factors have historically influenced Tezos’s price?
- How does Tezos differentiate itself from other cryptocurrencies?
- What is the overall trend in the cryptocurrency market, and how might it affect Tezos forecast?
- Are there any upcoming technological advancements or updates in the Tezos ecosystem that might impact its price?
- How do external factors such as regulations, global events, or economic shifts impact Tezos?
- Who are the major stakeholders in Tezos, and what are their views on its future?
- How do other market experts and analysts view Tezos’s price potential?
- What are the potential risks associated with investing in Tezos in the short and long term?
- How does the adoption rate of Tezos’s platform influence its price?
- Are there any geopolitical factors that might uniquely affect Tezos’s price compared to other cryptocurrencies?
- How do market sentiments and media coverage influence Tezos’s price fluctuations?
- Is the Tezos community growing, stagnating, or declining, and how might that impact its future value?
- How does Tezos’s scalability and transaction speed compare to other cryptocurrencies, and how might this impact its price?
- Are there any competitors or emerging technologies that could potentially challenge Tezos’s position in the market?
- How do global economic conditions, such as inflation rates and interest rates, impact Tezos’s value?
- How does Tezos’s actual use-case and utility in real-world applications affect its price forecast?
- What percentage of Tezos is held by “whales” or large investors, and how might their actions influence its price?
- Are there any upcoming partnerships, collaborations, or integrations that Tezos is involved in that could impact its price?
- How do the tokenomics (supply, distribution, staking rewards, etc.) of Tezos play a role in its price prediction?
- What would be the potential impact on Tezos’s price if a major exchange were to list or delist it?
By considering the questions highlighted above, one can gain a comprehensive perspective on Tezos’s potential trajectory. Always remember: in the dynamic world of cryptocurrency, critical thinking isn’t just beneficial – it’s essential.
Tezos (XTZ) Future Price Predictions by Experts
Diving into insights from industry experts and analysts gives us a glimpse into XTZ’s potential future price. While these perspectives are from seasoned professionals, it’s important to note that they shouldn’t be taken as financial advice.
- Price Prediction: According to the latest long-term forecast for Tezos, its price is predicted to reach $1.29 by the end of 2024 and then rise to $1.99 by the end of 2025.
- Digital Coin Price: Digital Coin Price suggests that, based on their analyses, Tezos could achieve a value of $2.34 by the end of 2024.
- GOV Capital: According to GOV Capital, their prediction for Tezos indicates a potential price of $2.47 by the end of 2024.
- Long Forecast: Long Forecast believes that by the end of 2024, Tezos might be valued around $0.68. They further predict a maximum price of $0.73 in 2025, with a possible drop to a minimum of $0.23.
- Coin Price Forecast: Coin Price Forecast predicts that Tezos will be priced at $1.14 by the end of 2024. They expect it to increase slightly to $1.19 in mid-2025, followed by a climb to $1.34 in the first half of 2025, finishing that year at approximately $1.40.
- Wallet Investor: According to Wallet Investor, Tezos might not be a favorable long-term investment. Their analysis suggests a potential drop in its price to $0.0650 by the end of 2024.
Decoding the Charts: XTZ Technical Price Analysis
Navigating the dynamic realm of cryptocurrencies is no simple feat. But friends, it’s not all about keeping an ear to the ground for the latest news. A comprehensive understanding requires an intimate dance with its technical charts. Now, let me unravel some mysteries of XTZ’s technical price analysis for you. However, before we whisk away into the nuances, let’s brush up on some cornerstone concepts and tools pivotal in technical analysis:
- Price Charts: Essential for technical analysts, price charts are available in multiple formats. This includes everything from line and bar charts to the detailed candlestick charts. These charts vividly illustrate historical price data, emphasizing potential patterns or trends.
- Trend Analysis: Pinpointing the prevailing trend is crucial in technical analysis. Traders carefully watch uptrends, characterized by consistent higher highs and higher lows, and downtrends, identified by ongoing lower highs and lower lows. Recognizing these trends offers traders a glimpse into the market’s temperament.
- Support and Resistance Levels: Think of support levels as cushions, where a cryptocurrency’s price seldom drops beneath. On the other hand, resistance levels act like invisible ceilings, restricting an asset’s upward movement. Recognizing these thresholds is essential, as they can highlight optimal moments to either engage or disengage from a trade.
- Technical Indicators: Digging deeper, technical analysts employ various mathematical instruments to assess market trends and momentum. Popular indicators include moving averages, the Relative Strength Index (RSI), the Moving Average Convergence Divergence (MACD), and the adaptable Bollinger Bands.
- Chart Patterns: Acting like seasoned investigators, technical analysts are always on the lookout for unique chart patterns forecasting potential price movements. Essential patterns to monitor include configurations like the head and shoulders, double tops and bottoms, triangles, and the elusive flags.
- Volume Analysis: Trade volume can provide a deeper understanding of the robustness of particular price actions. For instance, an uptick in volume during a price rise indicates a bullish stance. In contrast, a volume dip during a price drop could suggest a lack of selling momentum.
- Timeframes: The flexibility of technical analysis is one of its standout features. Analysts can tailor their methods to fit different timeframes – from the swift dynamics of intraday charts to the broader perspective of weekly or monthly charts. This choice often mirrors the analyst’s specific approach and goals.
Technical Indicators: Origin and Purpose
Stepping into the world of trading without acquainting yourself with technical indicators? That’s like diving deep into the ocean without a compass. Stemming from time-honored stock trading strategies, these nifty tools transform perplexing data into lucid, interpretable visual bullish or bearish signals. They are the beacon for traders, from greenhorns to the seasoned, illuminating the path of informed decision-making.
The Role of Technical Indicators in Financial Markets
Consider this analogy: trading without technical indicators is akin to assembling a jigsaw puzzle in the dark. Quite a challenge, right? Technical indicators are our torchlight in this scenario. They dissect the performance nuances of an asset, spotlighting momentum shifts, potential trend reversals, and volatility bursts, thereby refining the often turbulent journey of crypto trading.
How Technical Indicators Can Help Predict Tezos Price
Alright, Tezos aficionados, let’s get to the heart of the matter. Why, you ask, should you be engrossed in these indicators? Here’s the lowdown: Tezos, despite its unique features, dances to the rhythm of market trends. Tools like the Parabolic SAR or the Ichimoku Cloud can help forecast potential bullish or bearish shifts. And Trend Lines? They can potentially pinpoint where the price might encounter resistance or find support. To distill this, these indicators, when leveraged astutely, can serve as your north star, guiding you through the thrilling yet complex narrative of Tezos’ price journey.
Gaining a solid understanding of the key technical indicators is crucial, especially when diving into crypto price analysis and predicting the potential value of XTZ. In this section, I’ll highlight the essential indicators that have significantly influenced my trading journey. Additionally, I’ll provide practical examples to demonstrate their effective use in XTZ price predictions.
Moving Averages (MAs) for Tezos Price Prediction
Moving Averages smooth out price data to create a single flowing line, which makes it easier to identify the direction of the trend. The two most common types are the Simple Moving Average (SMA) and the Exponential Moving Average (EMA). The former takes the average closing prices of a coin over a specified number of days, while the latter gives more weight to recent prices.
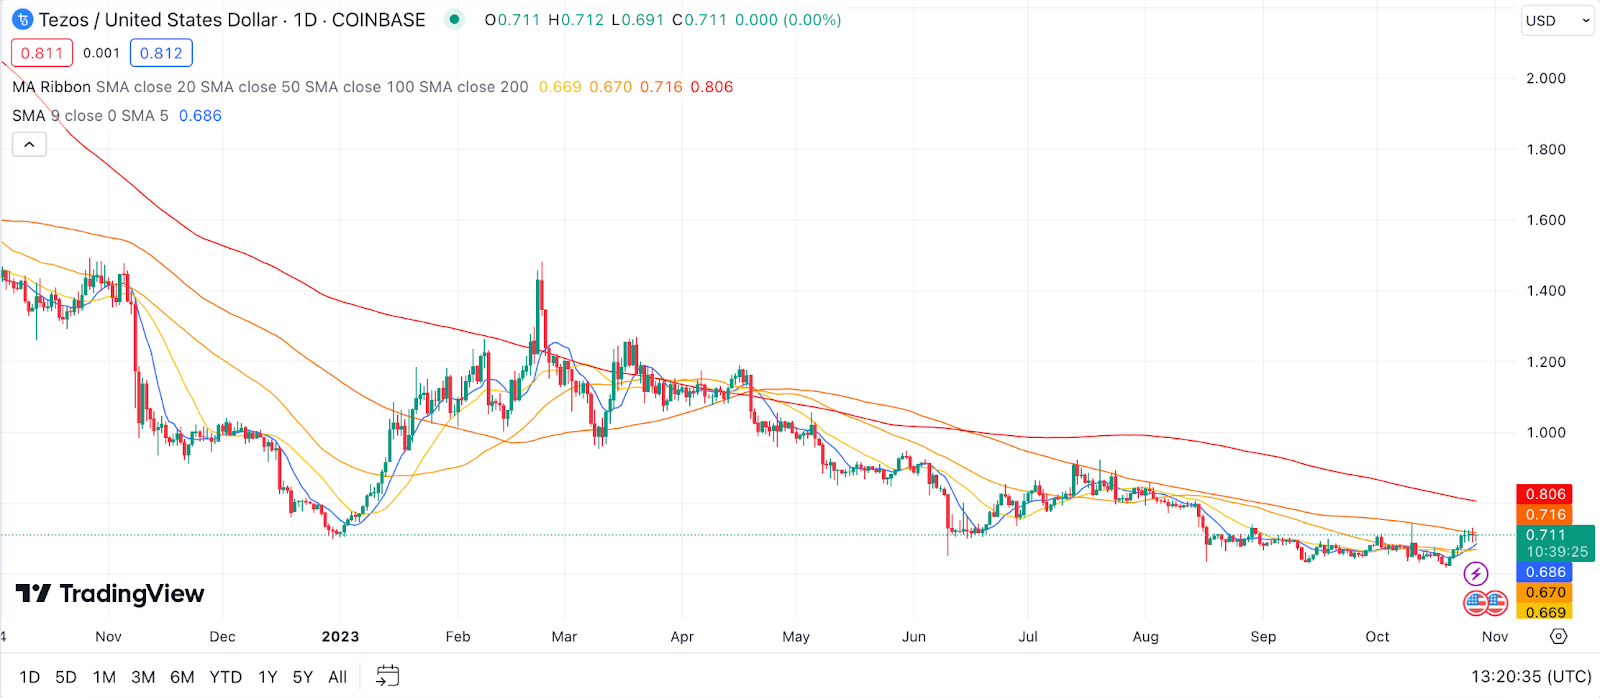
Example: If XTZ’s 50-day SMA crosses above its 200-day SMA, this could signal a potential bullish uptrend, commonly referred to as a “golden cross.” Conversely, if the 50-day SMA crosses below the 200-day SMA, it’s a bearish signal, known as a “death cross.”
Relative Strength Index (RSI) for Tezos Price Prediction
The RSI is a momentum oscillator that measures the speed and change of price movements. RSI oscillates between zero and 100. Typically, an RSI above 70 indicates that a coin might be overbought, suggesting a potential price correction, while an RSI below 30 suggests the coin may be oversold, indicating a potential price bounce back.
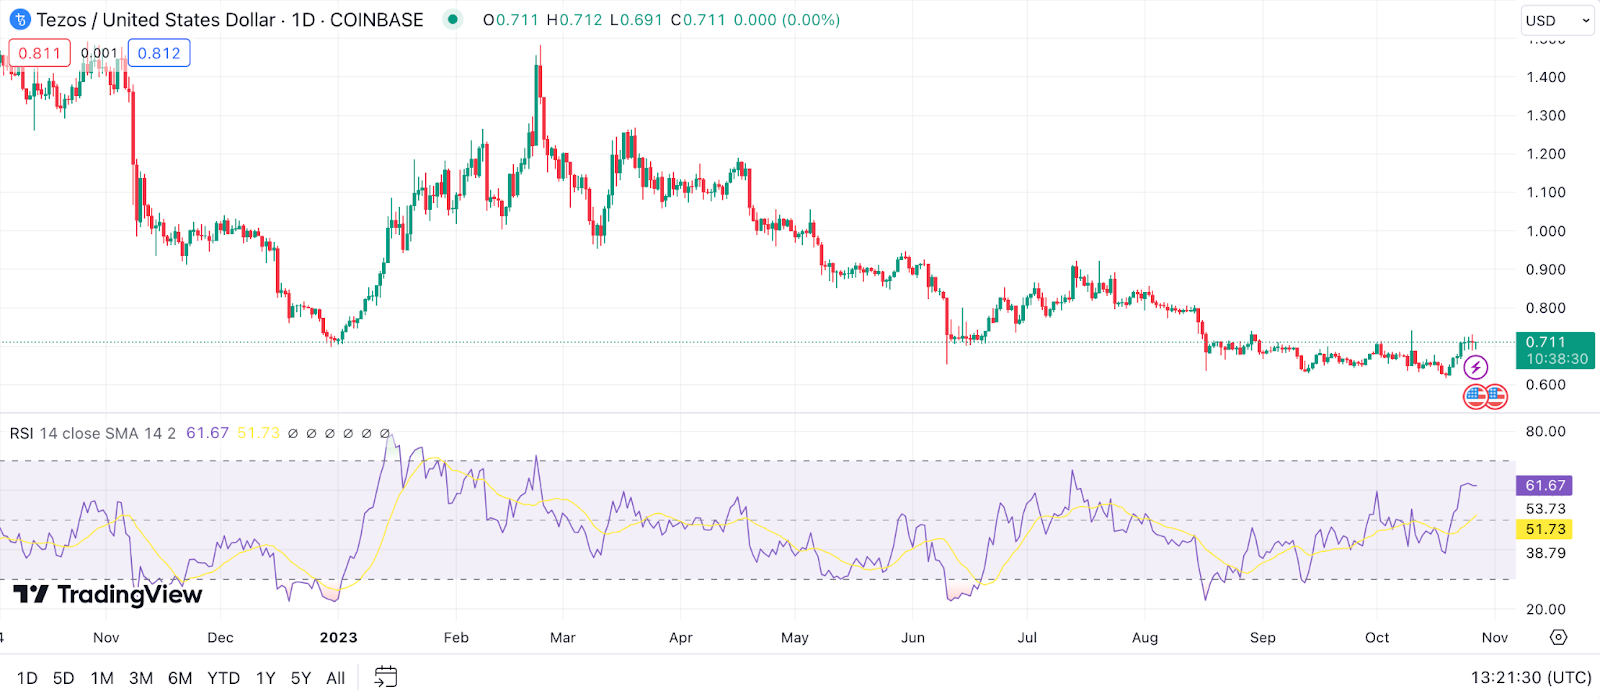
Example: If the RSI for XTZ is hovering around 78, this might imply that Tezos is currently overbought, and a price drop could be imminent. On the other hand, if the RSI is around 25, it might indicate that Tezos is oversold and could be primed for a price increase.
Moving Average Convergence Divergence (MACD) for Tezos Price Prediction
The MACD is a trend-following momentum indicator that shows the relationship between two moving averages of a coin’s price – the MACD line and the signal line. When the MACD line crosses above the signal line, it’s a bullish signal, suggesting it might be a good time to buy. Conversely, when the MACD line crosses below the signal line, it’s a bearish sign, hinting at a potential sell-off.
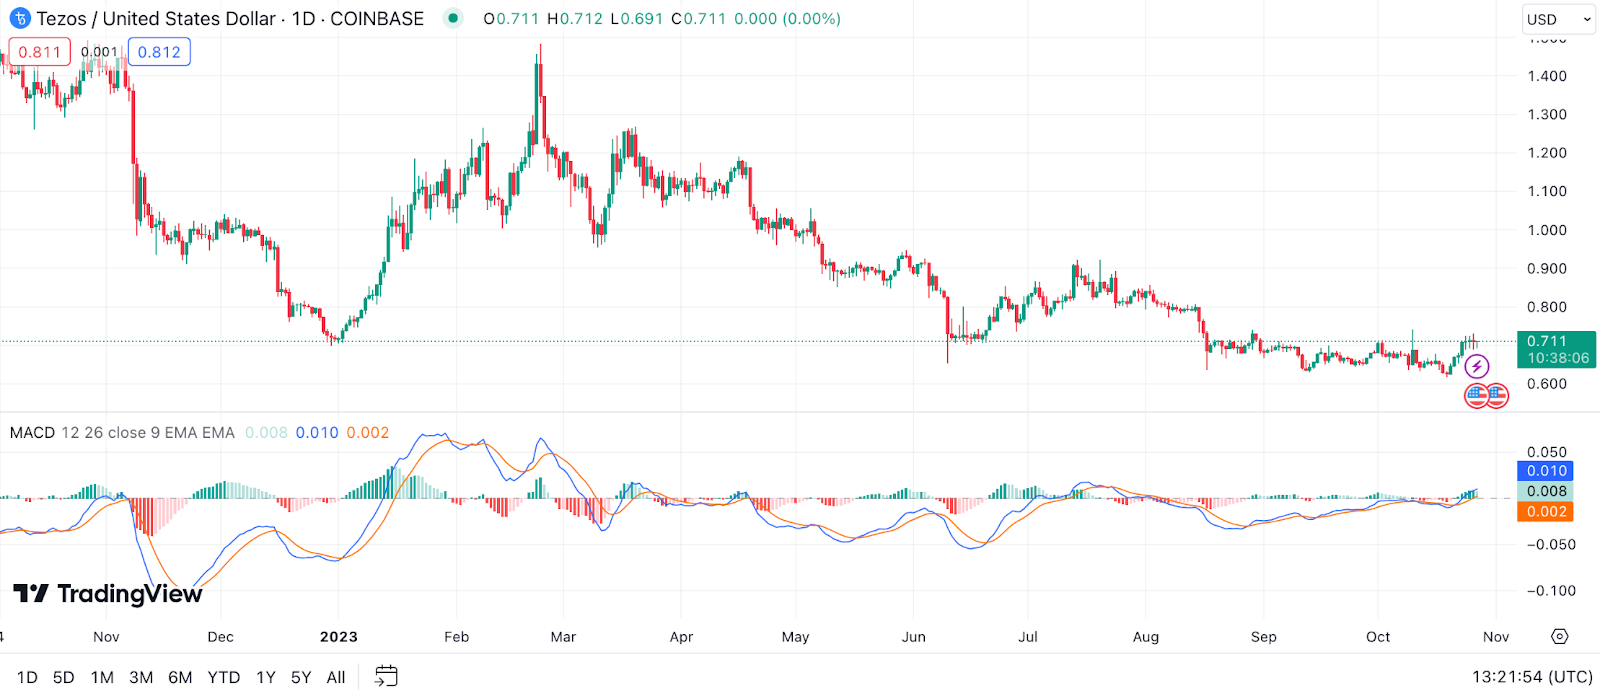
Example: Suppose XTZ’s MACD line recently moved above the signal line and has remained there for several days. This could be an indication that the momentum for Tezos is bullish and might be a good entry point for potential buyers. If the MACD line dips below the signal line, it might indicate a potential trend reversal, signaling a good exit point.
Bollinger Bands for Tezos Price Prediction
Bollinger Bands consist of a middle band being an N-period simple moving average (SMA), an upper band, and a lower band. The space between the upper and lower bands reflects the coin’s volatility. When the bands contract, it indicates decreased volatility, and when they expand, it points to increased volatility. Often, sharp price changes follow periods of band contraction.
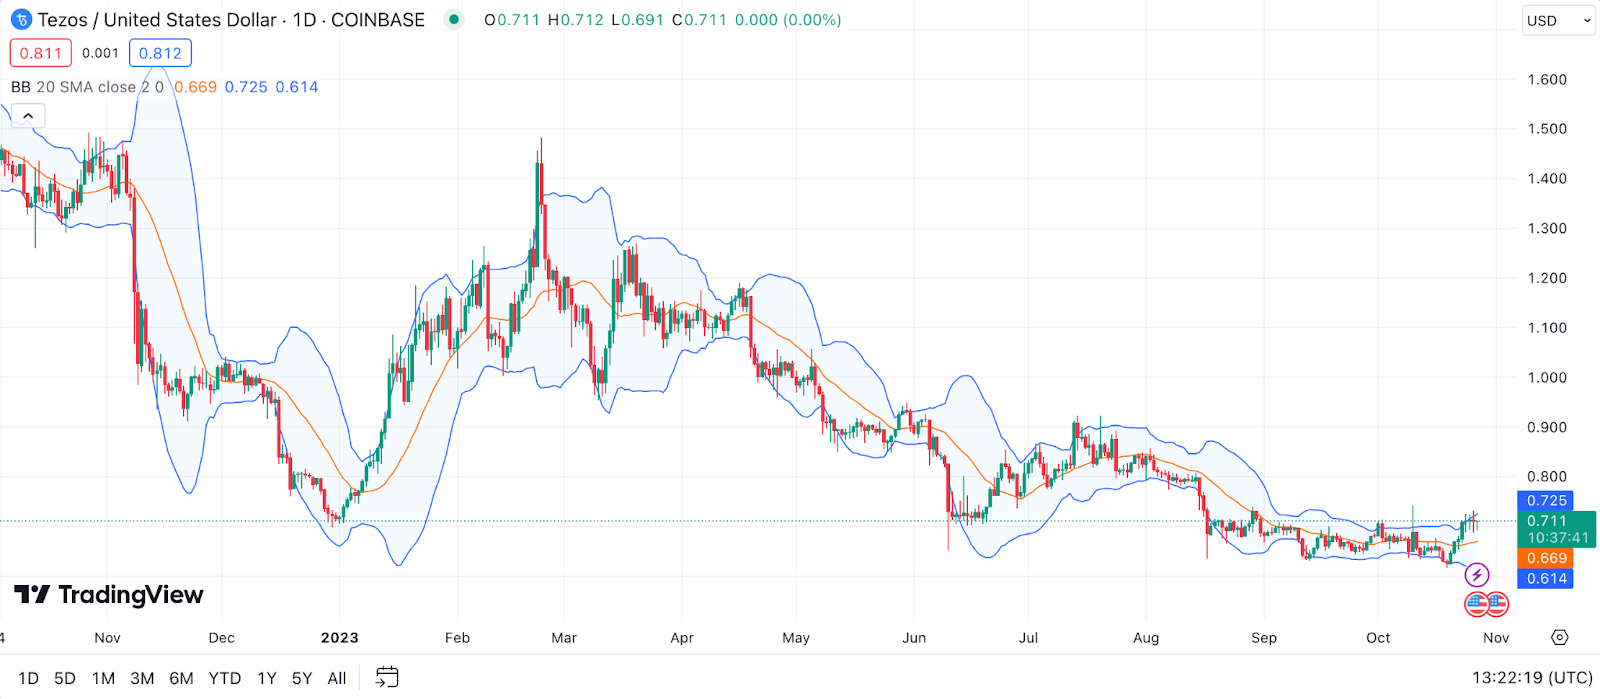
Example: If XTZ’s price starts touching the upper Bollinger Band, it might indicate that the coin is overbought and a price correction could be in the offing. Conversely, if Tezos touches the lower Bollinger Band, it suggests the coin might be undervalued, signaling a potential buying opportunity.
Stochastic Oscillator for Tezos Price Prediction
The Stochastic Oscillator compares a coin’s closing price to its price range over a specific time frame. This indicator oscillates between 0 and 100 and provides insights into a coin’s momentum. Typically, a reading over 80 is considered overbought, while a reading under 20 is seen as oversold.
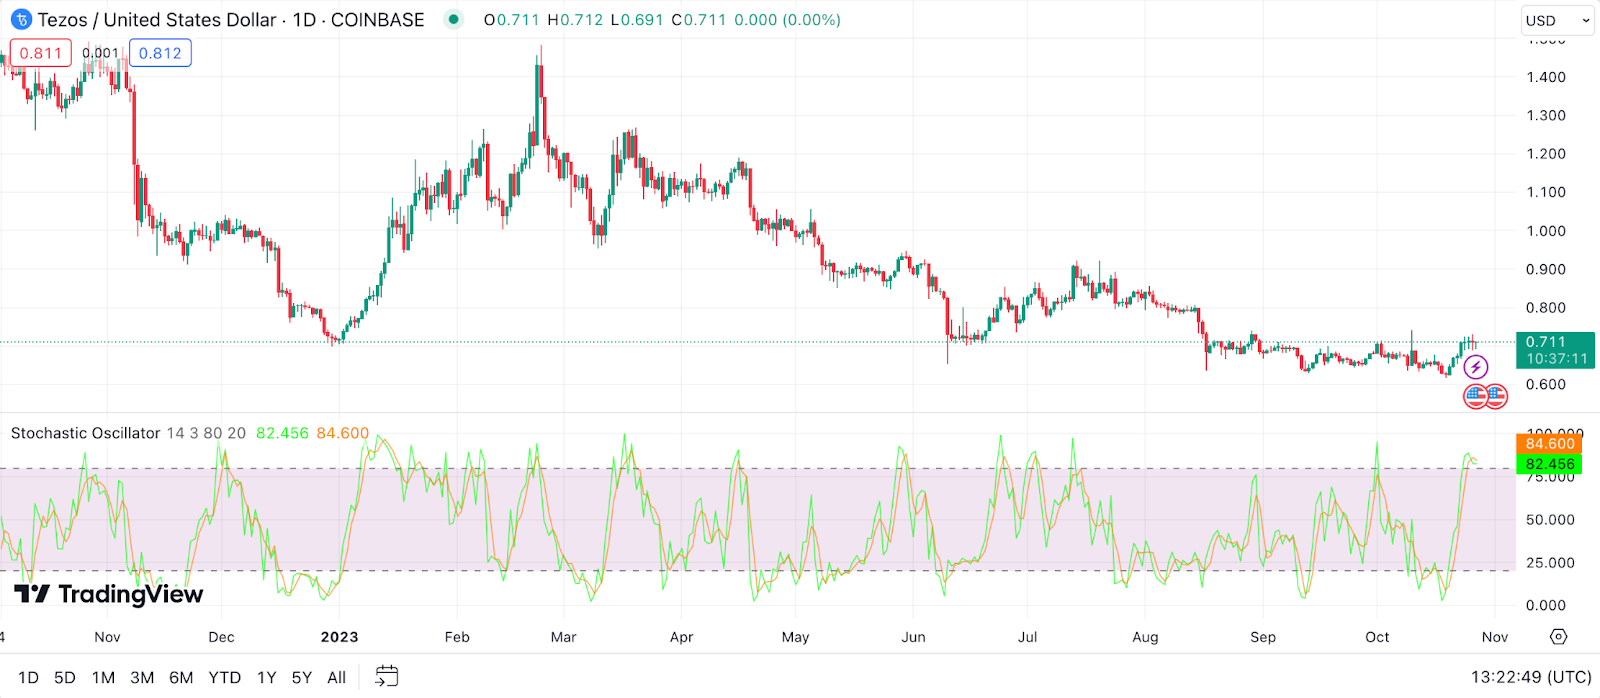
Example: If the Stochastic Oscillator for XTZ reads 85, it might imply that Tezos has been trading near its high for the given period, potentially indicating an overbought condition and suggesting caution for buyers. If it reads 15, it indicates that XTZ has been trading near its low, hinting that it might be oversold and could be a buy signal for traders.
Parabolic SAR (Stop and Reverse) for Tezos Price Prediction
The Parabolic SAR provides entry and exit points based on price movements. It appears as dots either above or below a coin’s chart, indicating the direction of the trend. Dots below the price chart signal a bullish trend, while dots above indicate a bearish trend.
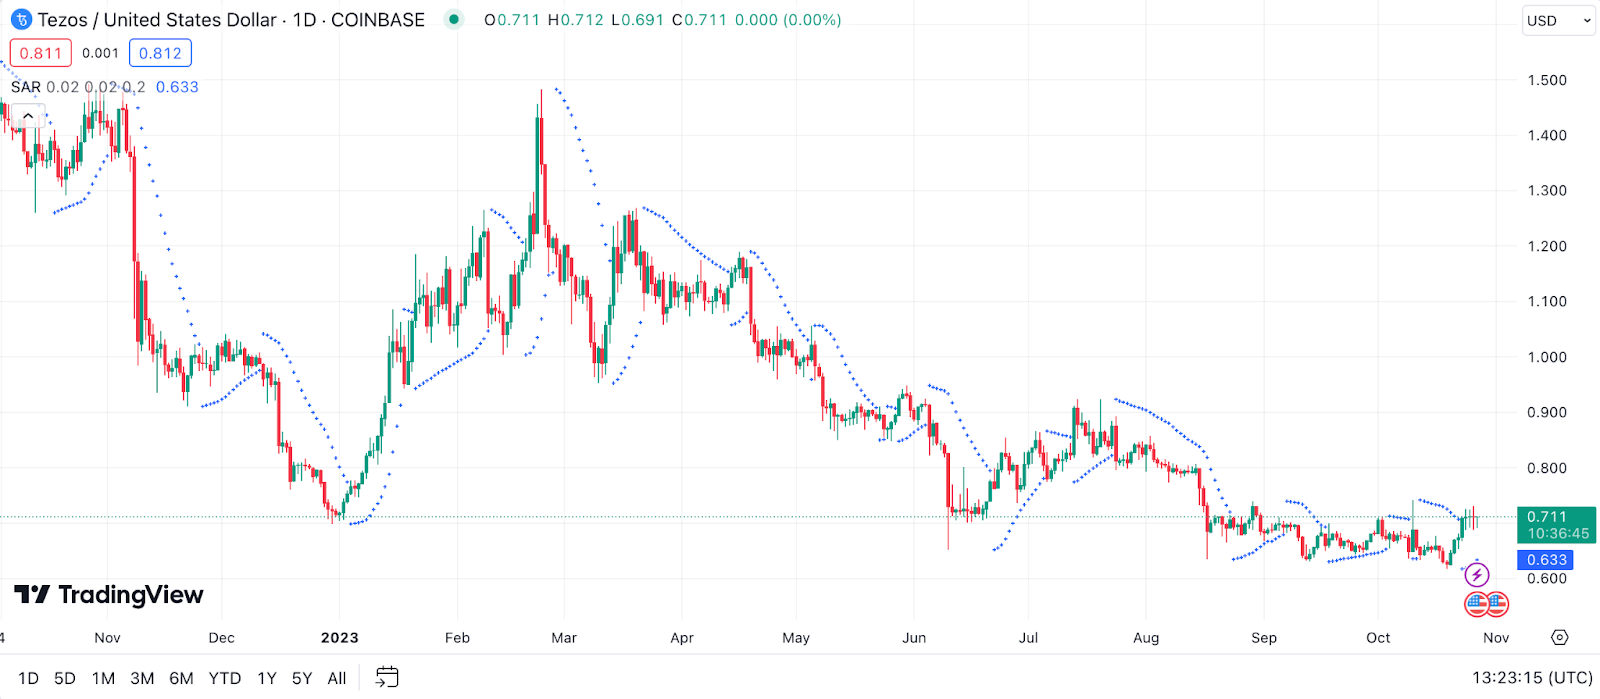
Example: If the Parabolic SAR dots are positioned below the XTZ price chart for several days, this suggests that the trend for Tezos is upward, and it might be an excellent opportunity for buying. Conversely, if the dots shift above the XTZ price chart, it signals that the trend has possibly reversed, and it might be time to consider selling.
Ichimoku Cloud for Tezos Price Prediction
The Ichimoku Cloud, often simply referred to as Ichimoku, is a comprehensive indicator providing insight into support and resistance, momentum, and trend direction. It comprises five lines: Tenkan-sen, Kijun-sen, Senkou Span A, Senkou Span B, and Chikou Span. When prices are above the cloud, it signals a bullish trend, and when below, a bearish trend.
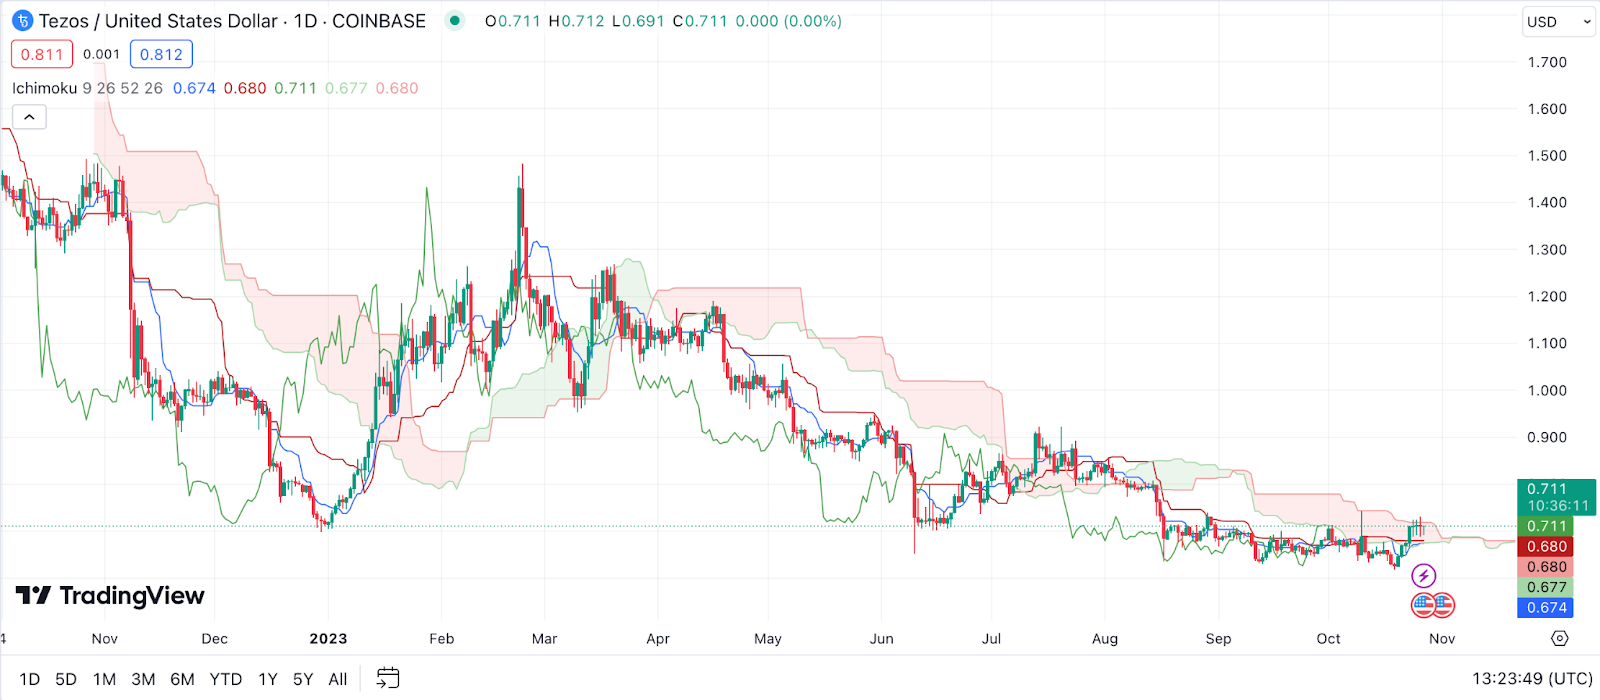
Example: If the XTZ price chart shows it moving above the Ichimoku Cloud, this indicates a strong upward momentum. In such a scenario, Tezos might be in a bullish phase. However, if XTZ starts dipping below the cloud, traders might interpret it as a sign to be cautious, as it could herald a potential bearish reversal.
Fibonacci Retracement for Tezos Price Prediction
Fibonacci Retracement levels are horizontal lines that indicate potential support and resistance levels based on the Fibonacci sequence. By assessing historical price data, traders can identify potential future levels where the asset might find support or resistance.
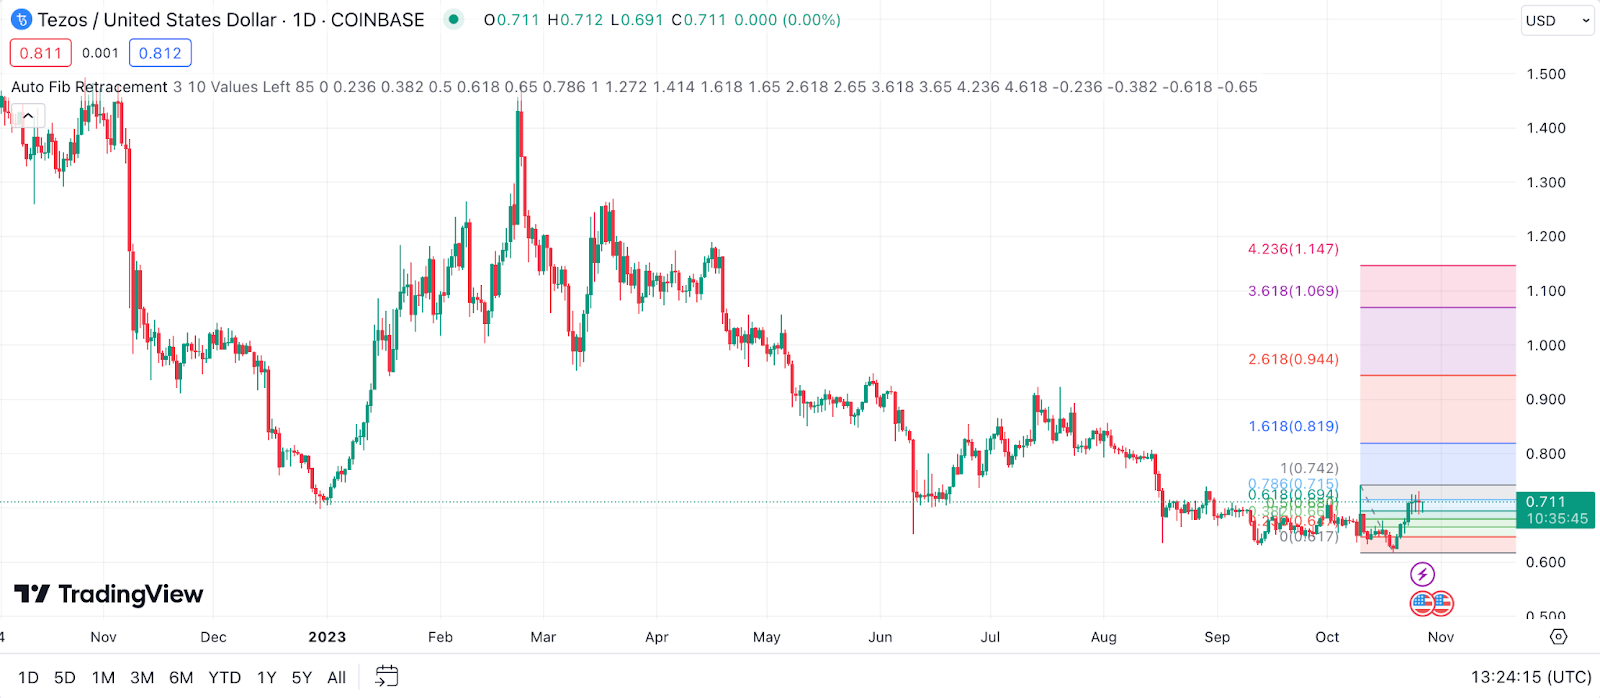
Example: After observing a significant price surge in XTZ, traders might use Fibonacci Retracement to gauge where the price might pull back before continuing its upward trend. If Tezos retraces to the 0.618 level and then bounces back, it suggests that this level serves as a robust support, potentially providing a favorable buying opportunity.
Average Directional Index (ADX) for Tezos Price Prediction
The ADX measures the strength of a trend irrespective of its direction, with readings above 25 indicating a strong trend and below 20 suggesting a weak or non-trending market. ADX is often accompanied by two other lines, +DI and -DI, which signal the direction of the trend.
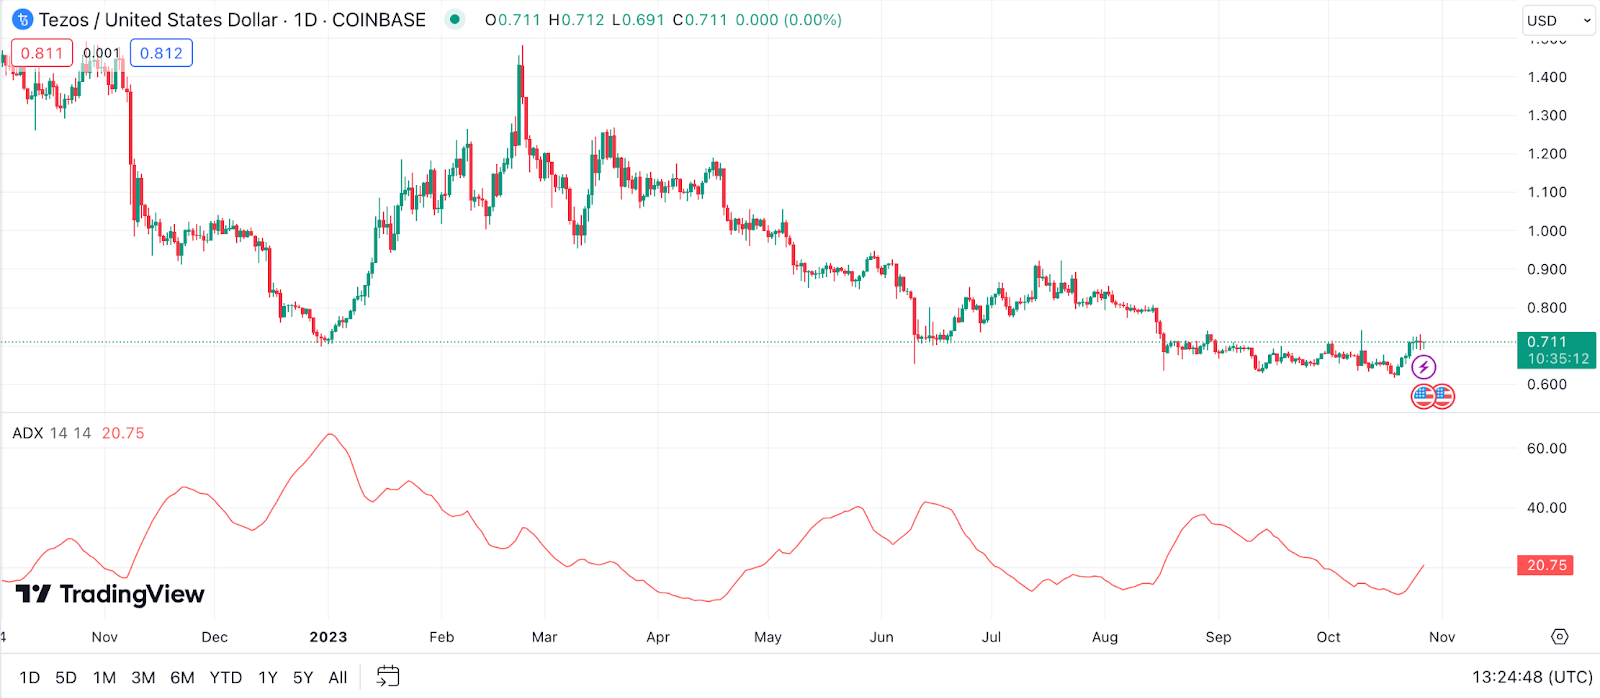
Example: If the ADX for XTZ surpasses 25 and the +DI line is above the -DI line, it indicates that Tezos is in a strong uptrend. On the other hand, if the -DI line overtakes the +DI while the ADX is above 25, it suggests a strong downtrend for the cryptocurrency.
On Balance Volume (OBV) for Tezos Price Prediction
The On Balance Volume (OBV) is a momentum indicator that uses volume to predict changes in the price of an asset. By tallying volume on up days and subtracting volume on down days, the OBV gives traders a cumulative total, which can then be used to ascertain buying and selling pressures. When OBV aligns with the current trend, it indicates strength in that trend, but a divergence can signal potential reversals.
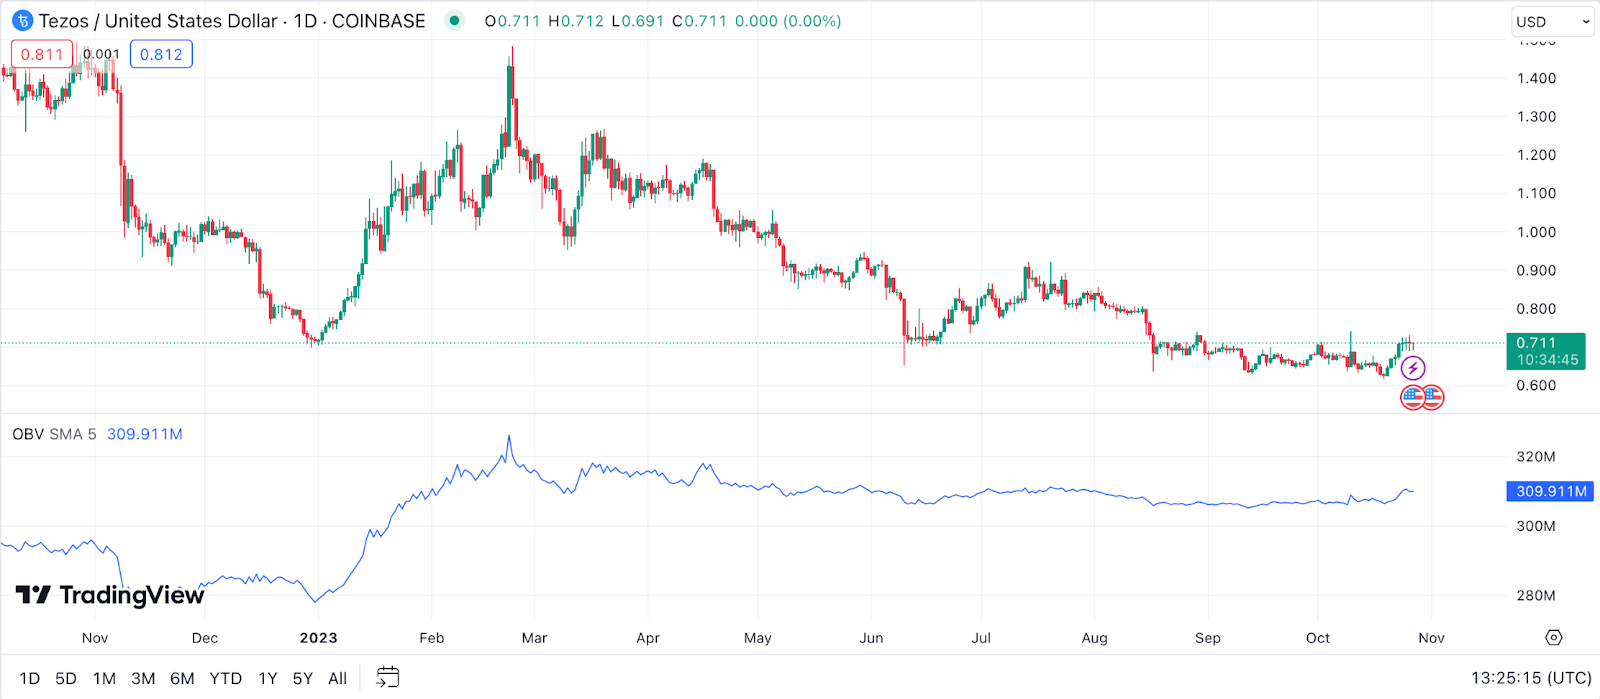
Example: If XTZ’s price is on an upward trajectory and the OBV also demonstrates a similar incline, it’s a sign that the upward movement is backed by strong volume, indicating genuine buying pressure. But if XTZ’s price rises and the OBV either remains stagnant or declines, it could suggest the rally lacks volume support and may soon reverse.
Rate of Change (ROC) for Tezos Price Prediction
The Rate of Change (ROC) is a momentum oscillator measuring the percentage change between the current price and a price a specific number of periods ago. Positive ROC indicates an uptrend, while negative ROC signifies a downtrend. The more significant the ROC, the stronger the momentum.
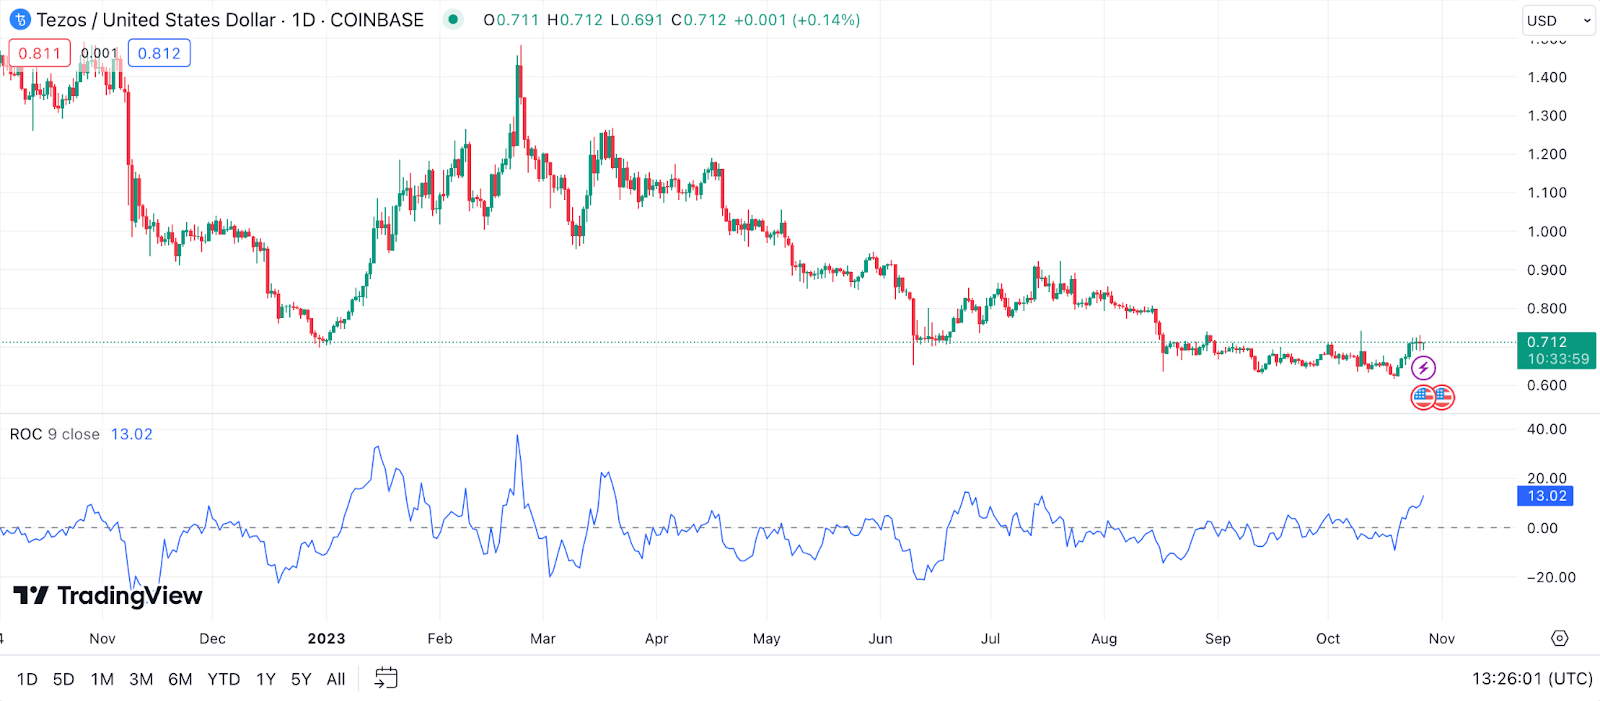
Example: Let’s say XTZ’s price increases by 15% over a 14-day period, resulting in a ROC value of +15. This suggests that momentum is on the side of the bulls. Conversely, if XTZ’s price drops by 10% over the same period, leading to a ROC of -10, it shows bearish momentum.
Commodity Channel Index (CCI) for Tezos Price Prediction
The Commodity Channel Index (CCI) is an oscillator used to determine whether an asset is overbought or oversold. Typically, readings above +100 indicate an overbought condition, which might signal a price pullback, while readings below -100 suggest an oversold condition, hinting at a potential bullish reversal.
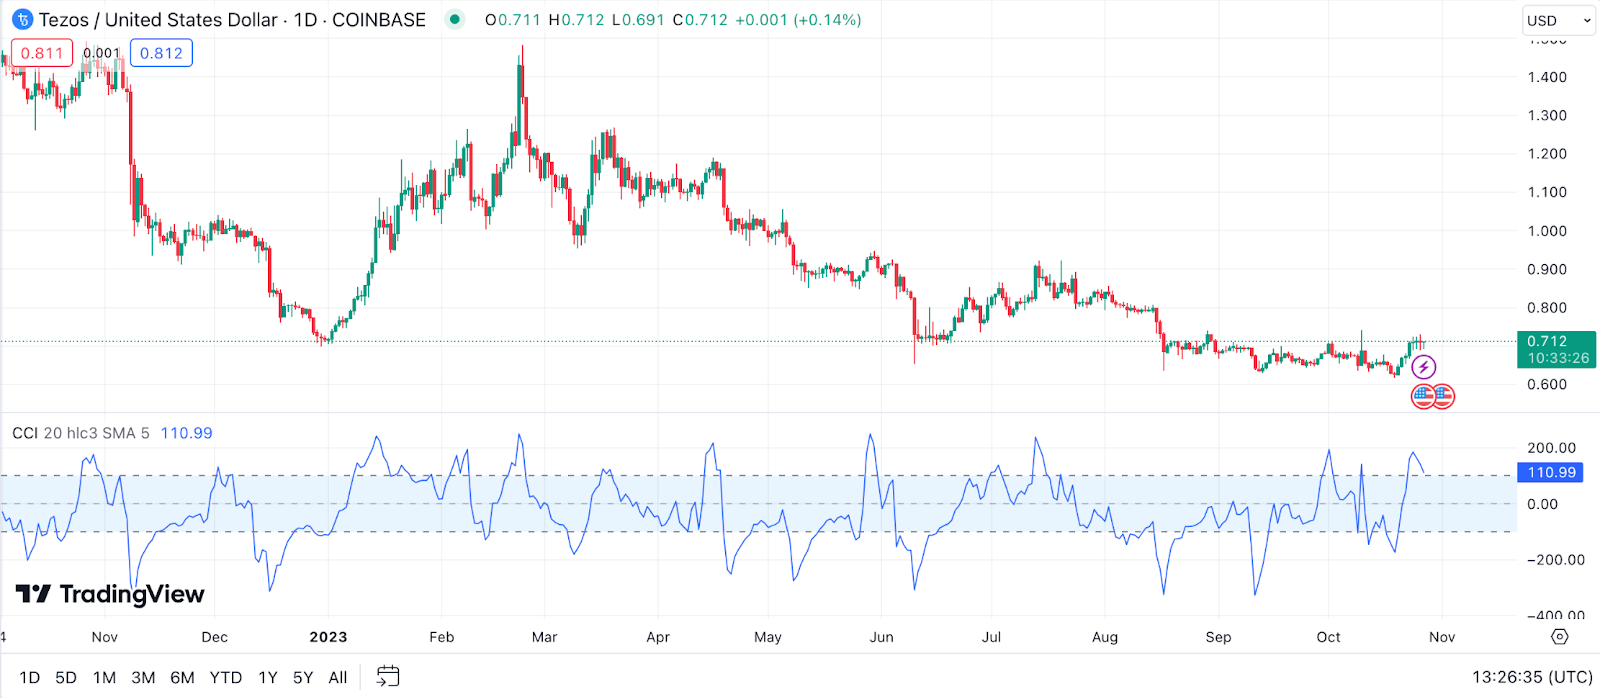
Example: If the CCI for XTZ surpasses the +100 level and remains there for a prolonged period, it might indicate that Tezos is overbought and a correction might be due. If the CCI plunges below -100, it could signify that XTZ is oversold, presenting a potential buying opportunity for traders who believe a rebound is imminent.
Accumulation/Distribution Line (A/D Line) for Tezos Price Prediction
The Accumulation/Distribution Line (A/D Line) is a volume-based indicator designed to reflect the cumulative flow of money into and out of an asset. It does this by considering the close price relative to the high and low of a given period, coupled with trading volume. When the A/D line is rising, it suggests that the asset is being accumulated (more buying pressure), and when it’s declining, it hints at distribution (more selling pressure).
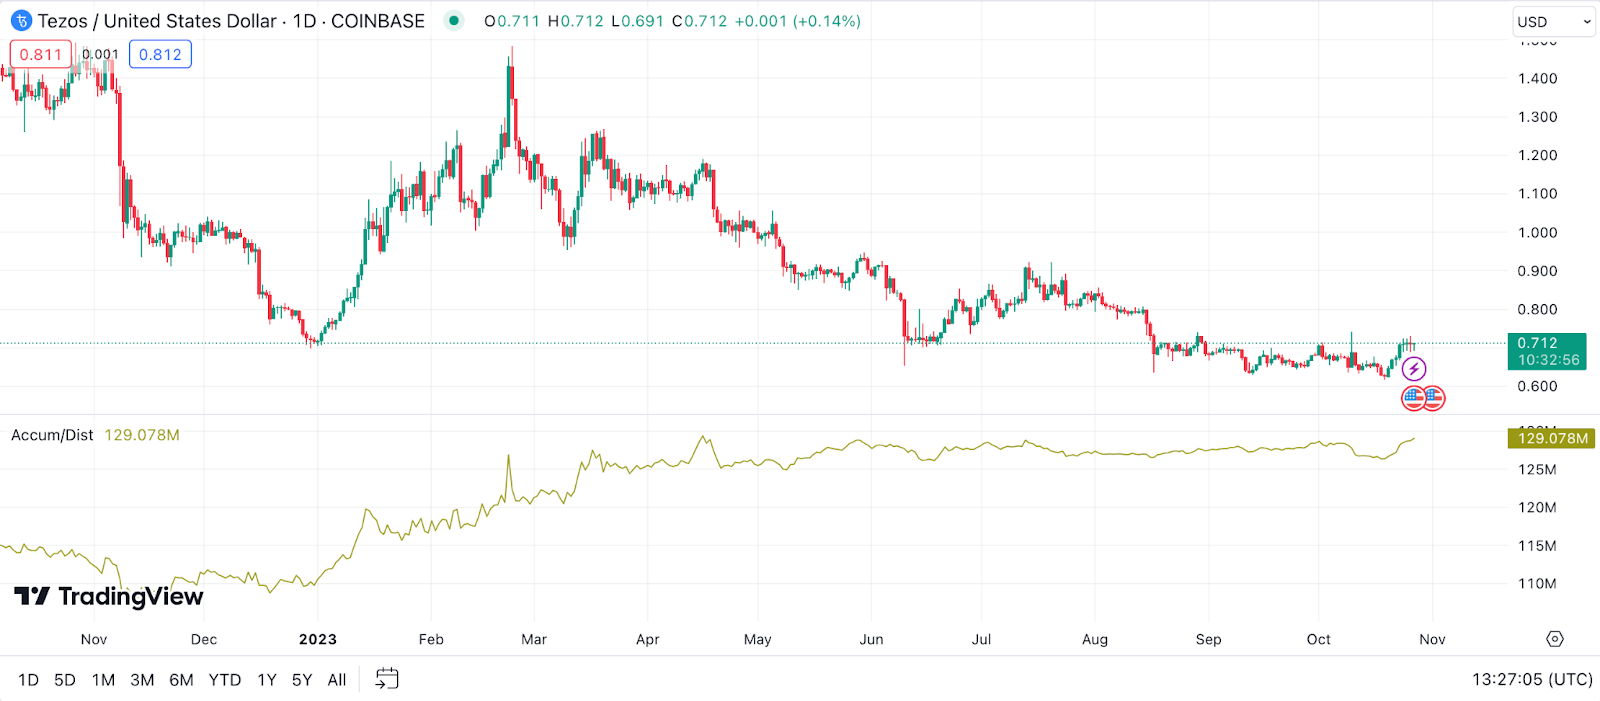
Example: If XTZ’s price is trending upward alongside a rising A/D Line, this demonstrates robust buying interest, strengthening the ongoing trend. On the other hand, if the A/D Line starts to drop while XTZ’s price is still rising, it could indicate a bearish divergence, hinting that a potential price reversal might be around the corner.
Pivot Points for Tezos Price Prediction
Pivot Points are tools used by traders to identify potential support and resistance levels. These points are calculated using the average of the high, low, and closing prices from a previous trading period. Once calculated, pivot points provide a set of resistance and support levels that traders can use for entry or exit points.
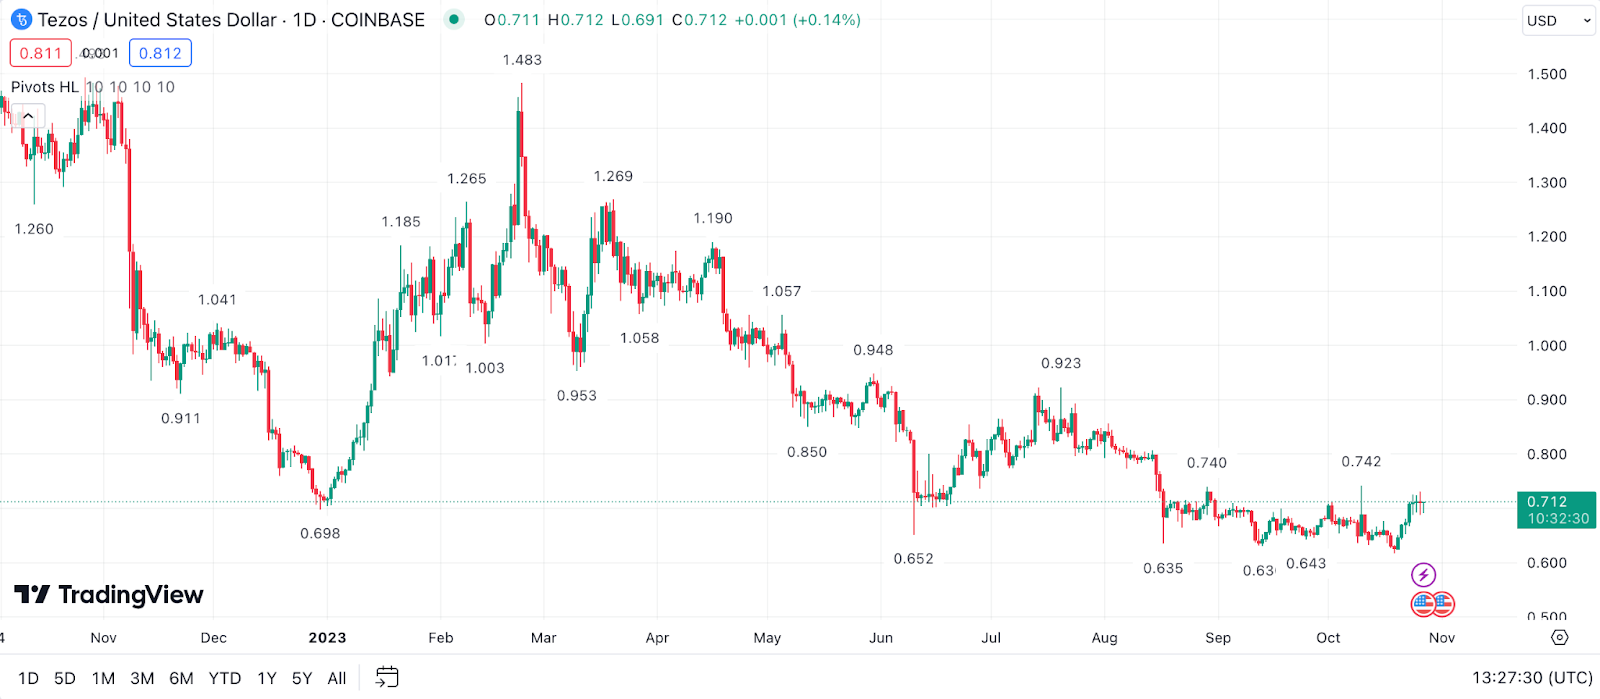
Example: Suppose XTZ’s pivot point for the day is calculated at $5. If the price starts to move above this, the first resistance level (R1) might be $5.30, and the first support level (S1) might be $4.70. Should XTZ price breach the R1 level, it could move towards the next resistance (R2) and so on. Conversely, if the price moves below the S1 level, it could seek support at the next level (S2).
Chaikin Money Flow (CMF) for Tezos Price Prediction
The Chaikin Money Flow (CMF) is an oscillator that measures the amount of Money Flow Volume over a specific period. It gauges buying and selling pressure by considering both price action and volume. A positive CMF indicates that the market is being dominated by buyers, while a negative CMF suggests more selling activity.
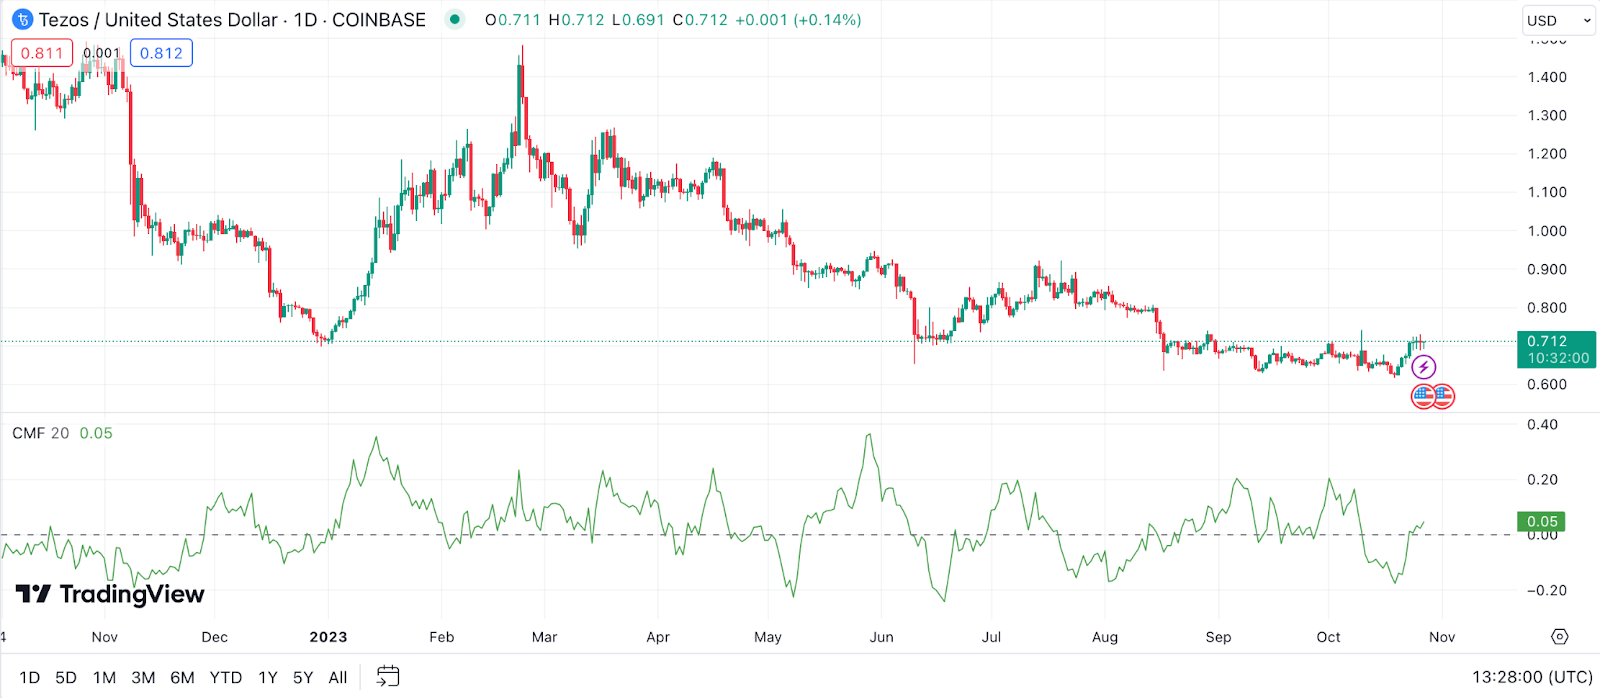
Example: If the CMF for XTZ remains above the zero line for a prolonged period, it suggests that buying pressure dominates, potentially indicating a bullish sentiment. Conversely, if the CMF remains below the zero line, it points to more significant selling pressure, suggesting a bearish sentiment for XTZ.
Aroon Indicator for Tezos Price Prediction
The Aroon Indicator consists of two distinct lines: Aroon Up and Aroon Down. It is designed to help traders identify the strength of a trend and potential reversals. Aroon Up focuses on the time since the last 25-period high, while Aroon Down reflects the time since the last 25-period low. When the Aroon Up is dominant and above 70, it suggests a strong bullish trend, while an Aroon Down above 70 indicates a bearish trend.
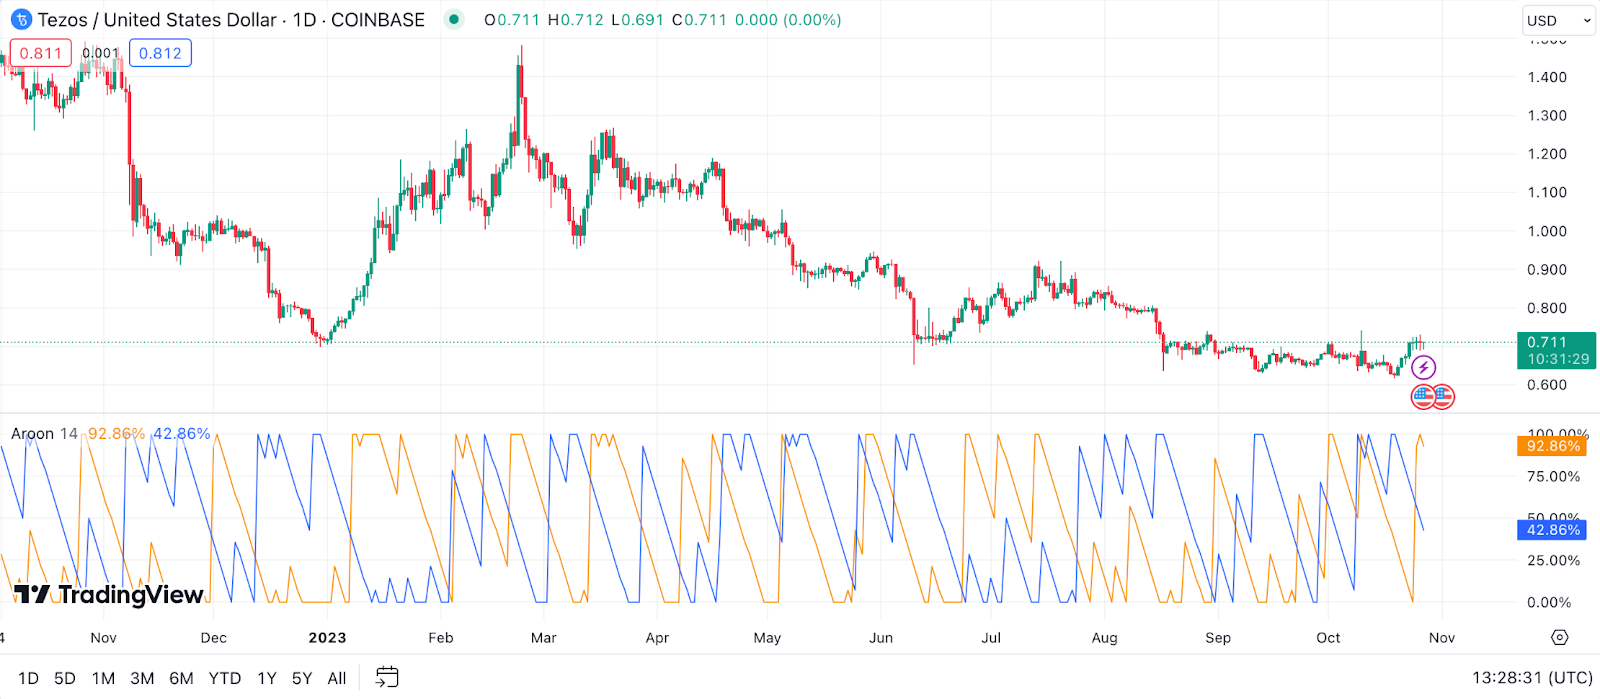
Example: Suppose the current Tezos price has been on a steady climb for the past few weeks. If the Aroon Up line is above 70 and the Aroon Down line is below 30, it reinforces the bullish momentum. However, if these roles begin to reverse, with the Aroon Down crossing above the Aroon Up, this could suggest an impending bearish reversal for XTZ.
Gann Fan for Tezos Price Prediction
Developed by W.D. Gann, the Gann Fan is a set of diagonal lines that indicate possible support and resistance levels at various angles. Each angle represents a potential rate of price movement. The 45-degree line, often seen as the most crucial, denotes a balanced market where time and price move in tandem.
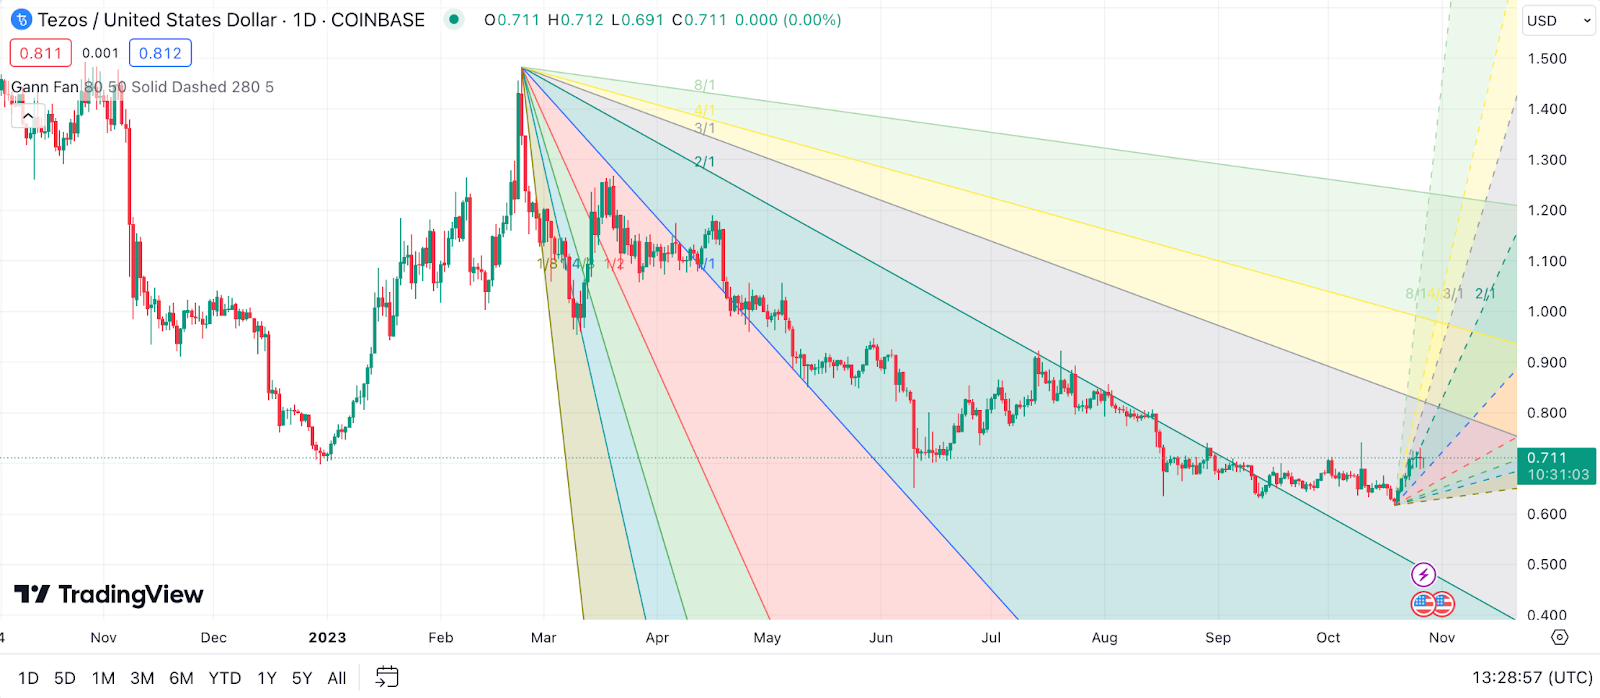
Example: Consider a scenario where XTZ’s price starts accelerating faster than the 45-degree line in the Gann Fan. This could imply a robust bullish trend. Conversely, if XTZ falls below the 45-degree trajectory, it might signify a bearish outlook. Notably, the further the price moves from the 45-degree line, the stronger the trend is perceived to be.
Keltner Channel for Tezos Price Prediction
The Keltner Channel is a volatility-based envelope set above and below an exponential moving average of the price. This indicator helps traders gauge the price’s volatility and trend. When the price moves towards the upper band, it can be seen as overbought, and when it moves towards the lower band, it’s potentially oversold.
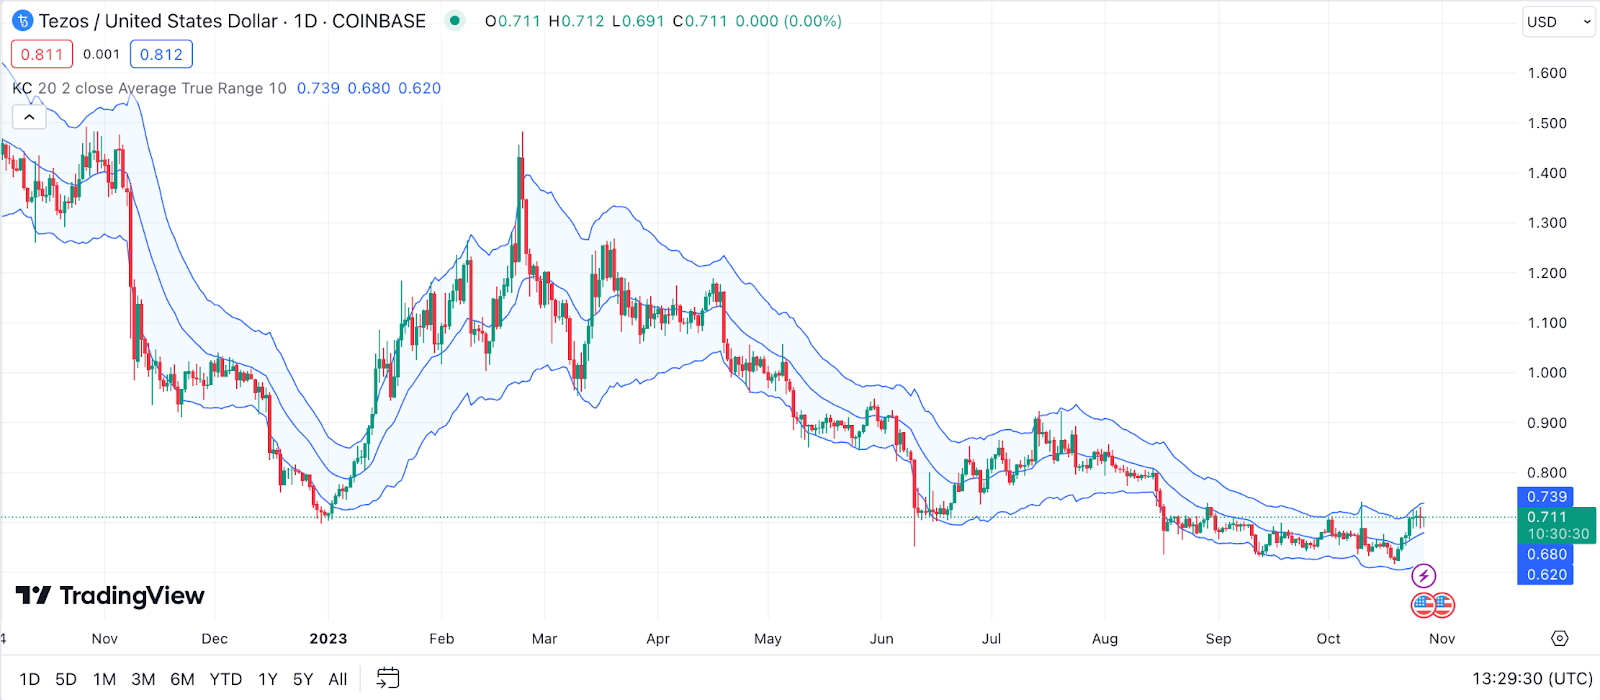
Example: If XTZ’s price consistently rides the upper Keltner Channel, showing persistent closings near the band, it’s a sign of strong bullish momentum. On the flip side, if XTZ continually gravitates towards the lower band, it can be a signal that bears are in control. If XTZ’s price moves sideways within the Keltner Channel, it might indicate a range-bound market with no clear direction.
Money Flow Index (MFI) for Tezos Price Prediction
The Money Flow Index (MFI) is a momentum oscillator that measures the flow of money into and out of a security over a specific period. Essentially, it combines both price and volume data to evaluate overbought or oversold conditions. Typically ranging between 0 to 100, an MFI value above 80 suggests that XTZ might be overbought, whereas a value below 20 suggests it might be oversold.
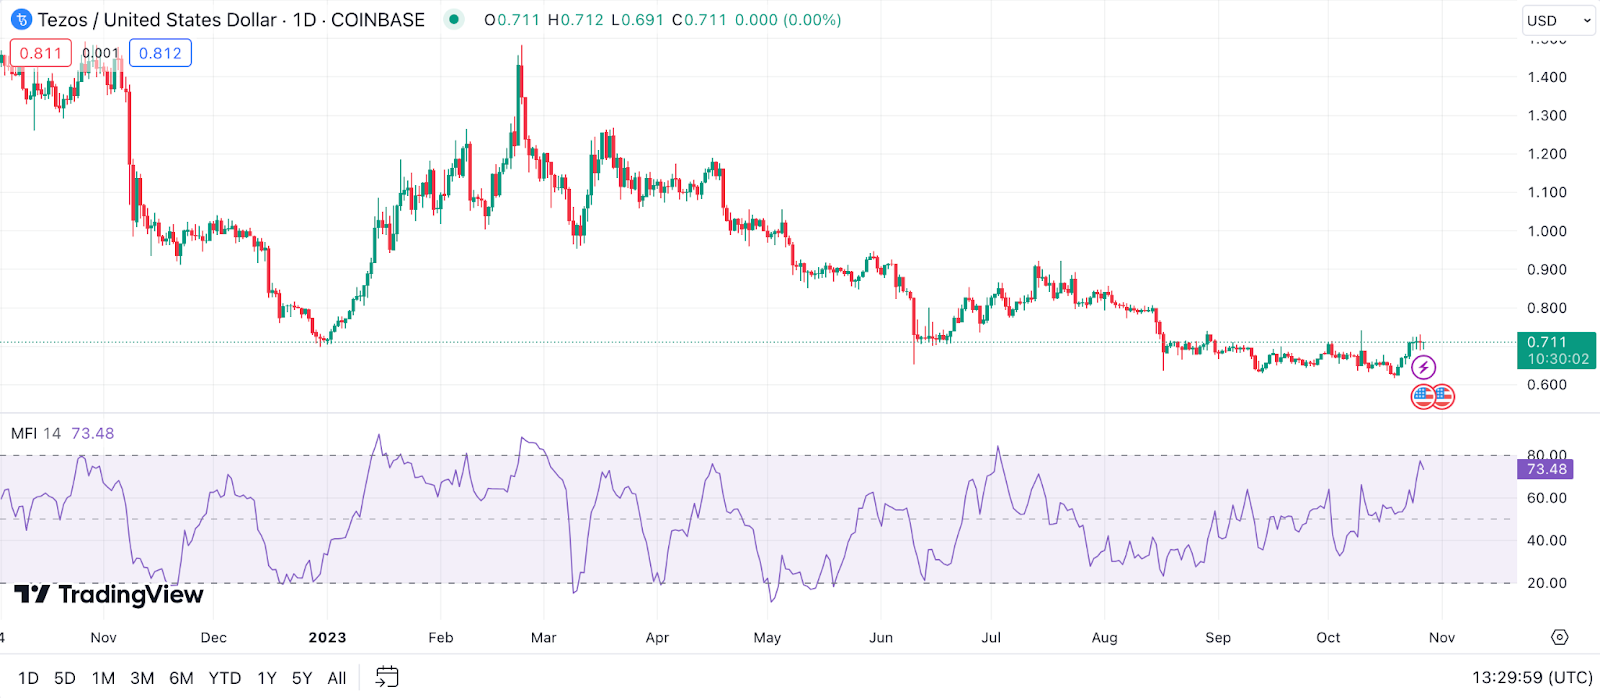
Example: Imagine there’s a sudden spike in the XTZ’s trading volume, and its price starts rising simultaneously. If the MFI breaches the 80 level during this period, it might hint that XTZ is in overbought territory and could see a potential pullback soon.
TRIX for Tezos Price Prediction
TRIX, also known as the Triple Exponential Average, is a momentum oscillator designed to filter out market noise and highlight the underlying trend of an asset. By focusing on XTZ’s triple-smoothed exponential moving average, it provides insights into potential reversals and trend strengths. A positive TRIX suggests a bullish momentum, while a negative value indicates bearish momentum. Signal line crossovers can also provide entry or exit prompts.
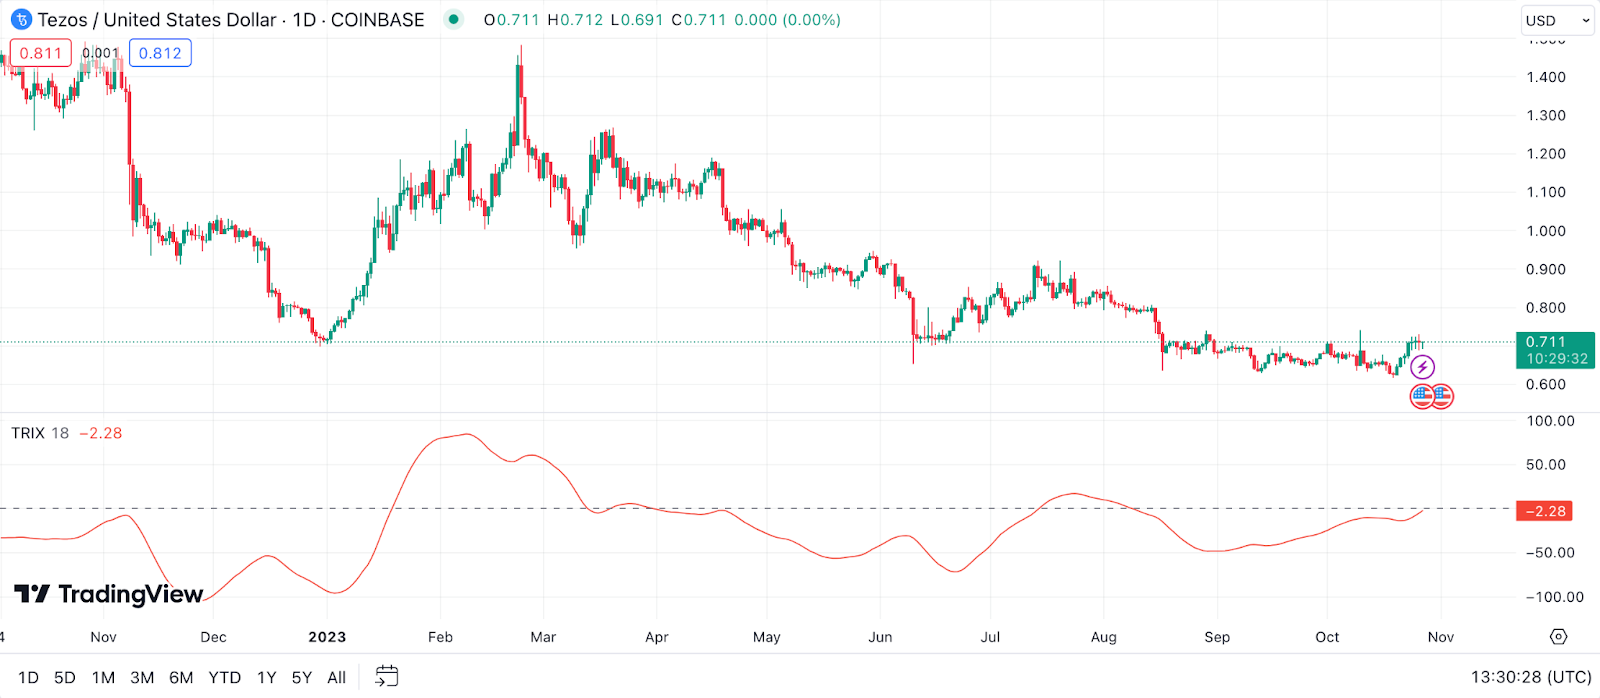
Example: If XTZ’s TRIX line crosses above the signal line and remains positive, it might be a bullish sign. Conversely, a crossover below the signal line could suggest bearish momentum. For instance, after a period of sideways movement, if TRIX begins to trend upward while XTZ’s price follows suit, it could be an indication of a strengthening bullish trend.
The Zig Zag Indicator for Tezos Price Prediction
The Zig Zag indicator is instrumental in filtering out minor price movements, thereby emphasizing significant price changes. By doing this, it helps traders and analysts visualize and identify clear swing highs and lows. The Zig Zag doesn’t predict future movements but rather underscores existing trends.
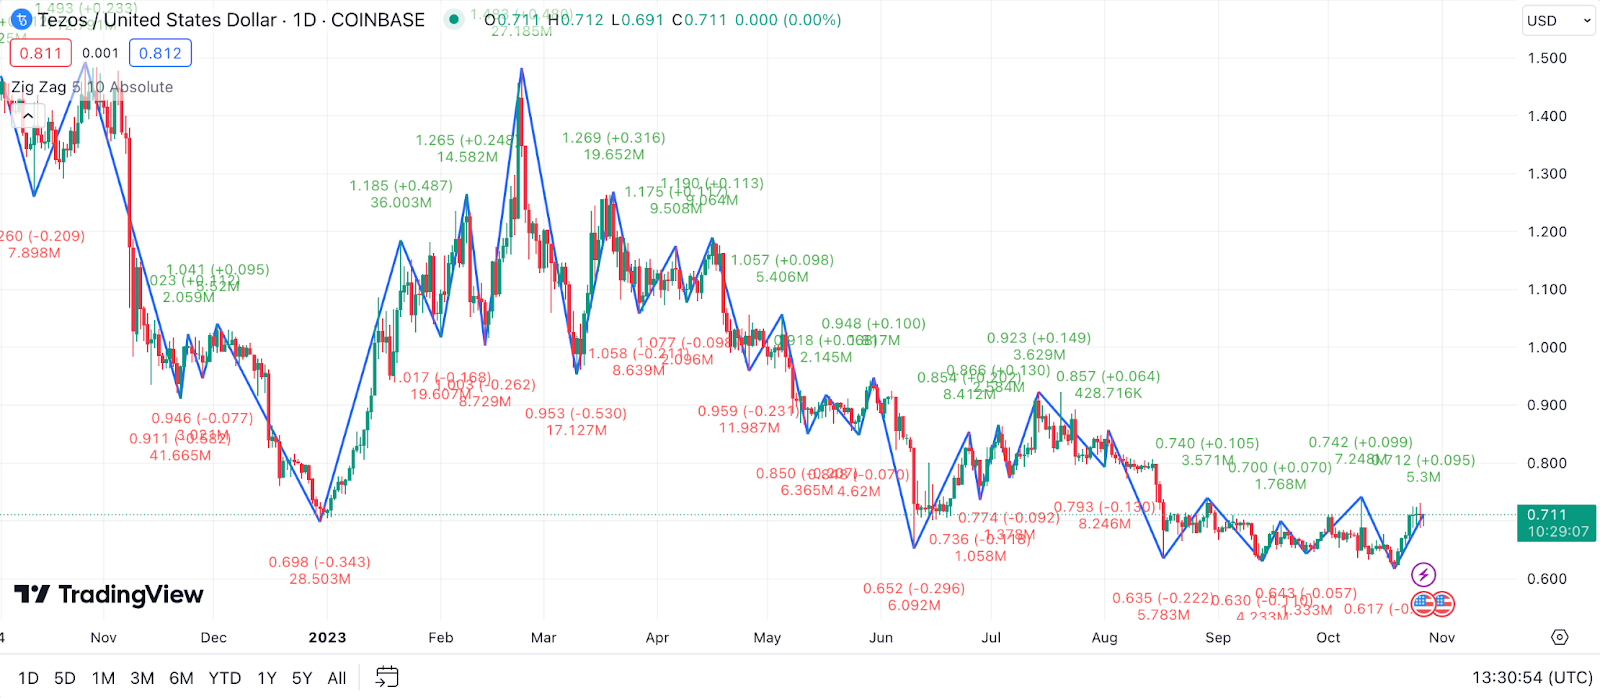
Example: Let’s say XTZ’s price has been fluctuating mildly with small ups and downs. The Zig Zag indicator would smooth out these minor fluctuations and display more significant price swings, making it easier to identify patterns. If the Zig Zag shows an upward pattern formation after a downtrend, it could be perceived as a possible trend reversal, indicating a bullish scenario for XTZ.
Detrended Price Oscillator (DPO) for Tezos Price Prediction
The Detrended Price Oscillator (DPO) helps traders identify cycles or periodic oscillations in the price of an asset, such as XTZ, by eliminating the long-term trend’s influence. This tool can aid in spotting peaks and troughs that occur at regular intervals. A positive DPO value can suggest that XTZ is above its intermediate trend, while a negative value might indicate the opposite.
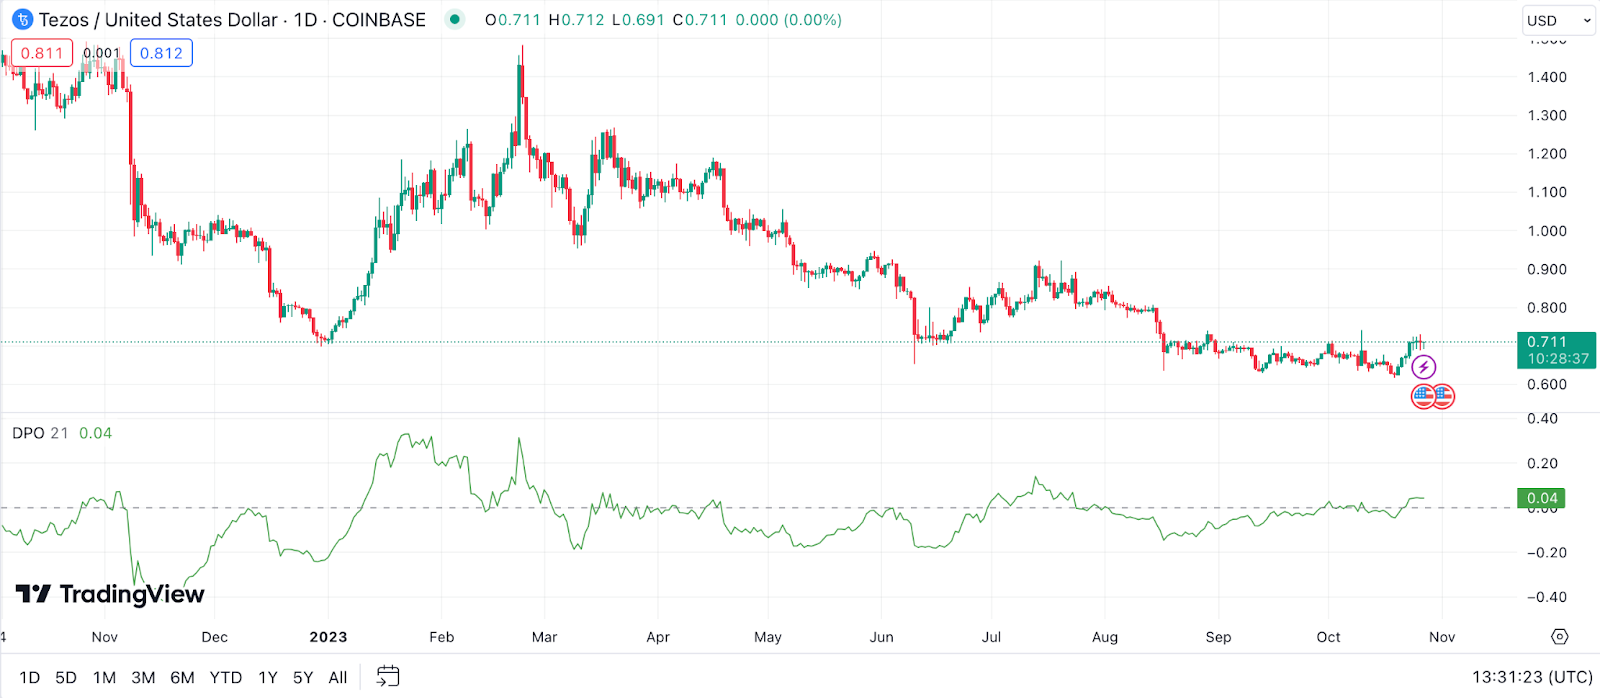
Example: Imagine XTZ has been on a steady upward trajectory, but you notice cyclical dips every few weeks. By applying the DPO, you could identify these patterns more clearly. If XTZ’s price is above its average trading price but the DPO dips below zero, it might hint at an impending short-term decline within the longer bullish trend.
Vortex Indicator (VI) for Tezos Price Prediction
The Vortex Indicator (VI) assesses the start and end of market trends by comparing an asset’s high and low prices over specific periods. A rising VI+ line (indicating upward movement) that crosses above the VI- line (indicating downward movement) can be a bullish signal, whereas the opposite is seen as bearish.
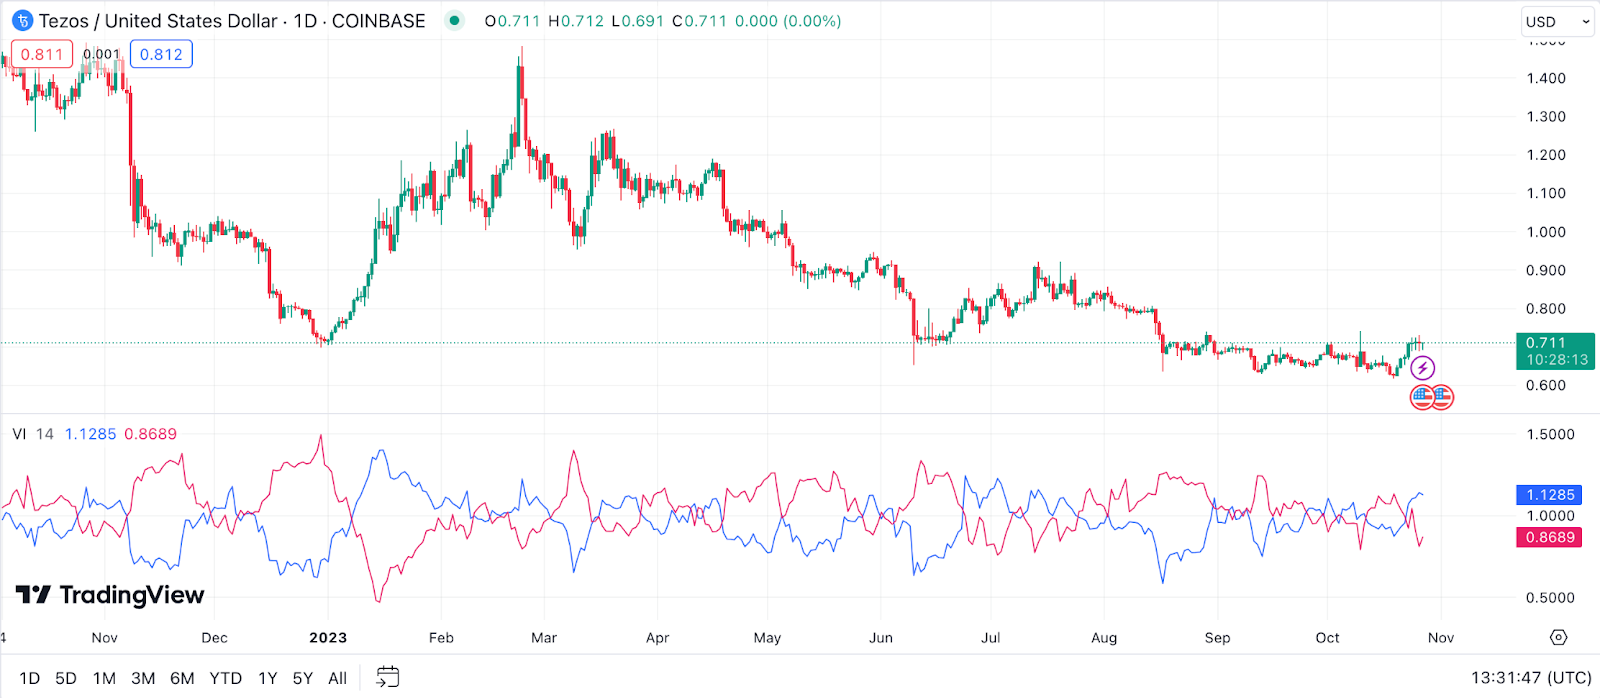
Example: Let’s assume that XTZ has seen some ambiguous price movement recently. However, by using the Vortex Indicator, you observe the VI+ line overtaking the VI- line. This crossover could be an indication of a budding upward trend, signaling a potential buying opportunity.
Elder’s Force Index (EFI) for Tezos Price Prediction
Elder’s Force Index (EFI) merges price and volume to gauge the force or power behind market movements. A positive EFI indicates a bullish momentum when accompanied by a rising price and vice versa. However, divergences between the EFI and the price can also spotlight potential trend reversals.
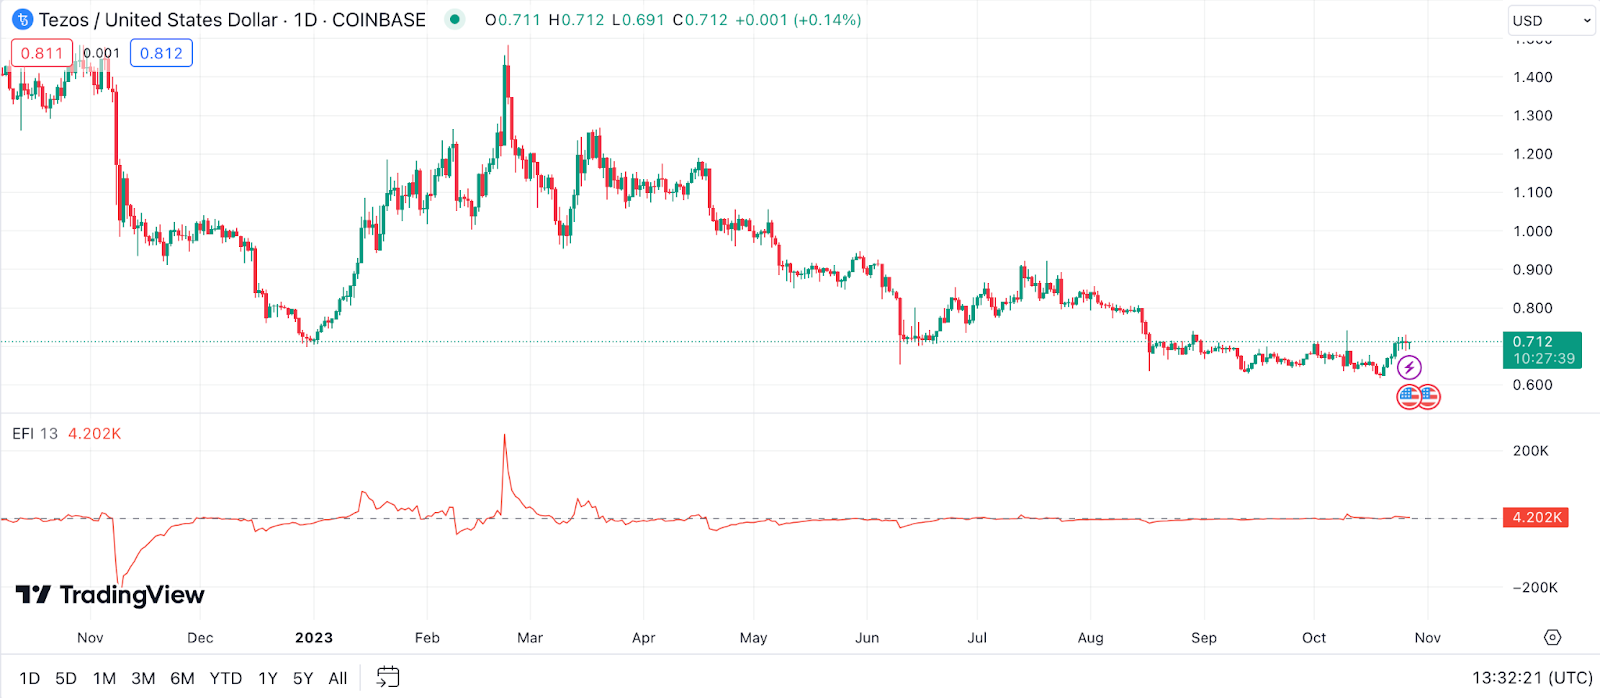
Example: Suppose XTZ’s price has been rising, but you detect a decrease in its trading volume. If the EFI starts trending downwards despite the price still climbing, it could be a warning of weakening bullish momentum, hinting at a potential reversal in the near future.
Williams %R for Tezos Price Prediction
Williams %R, often referred to as the Williams Percent Range, is a momentum indicator that provides insight into overbought or oversold conditions of an asset. It moves between 0 and -100, with values between 0 to -20 typically suggesting that an asset, like XTZ, is overbought, while values between -80 to -100 suggest it’s oversold. When the indicator moves out of these regions, it can signal potential reversals.
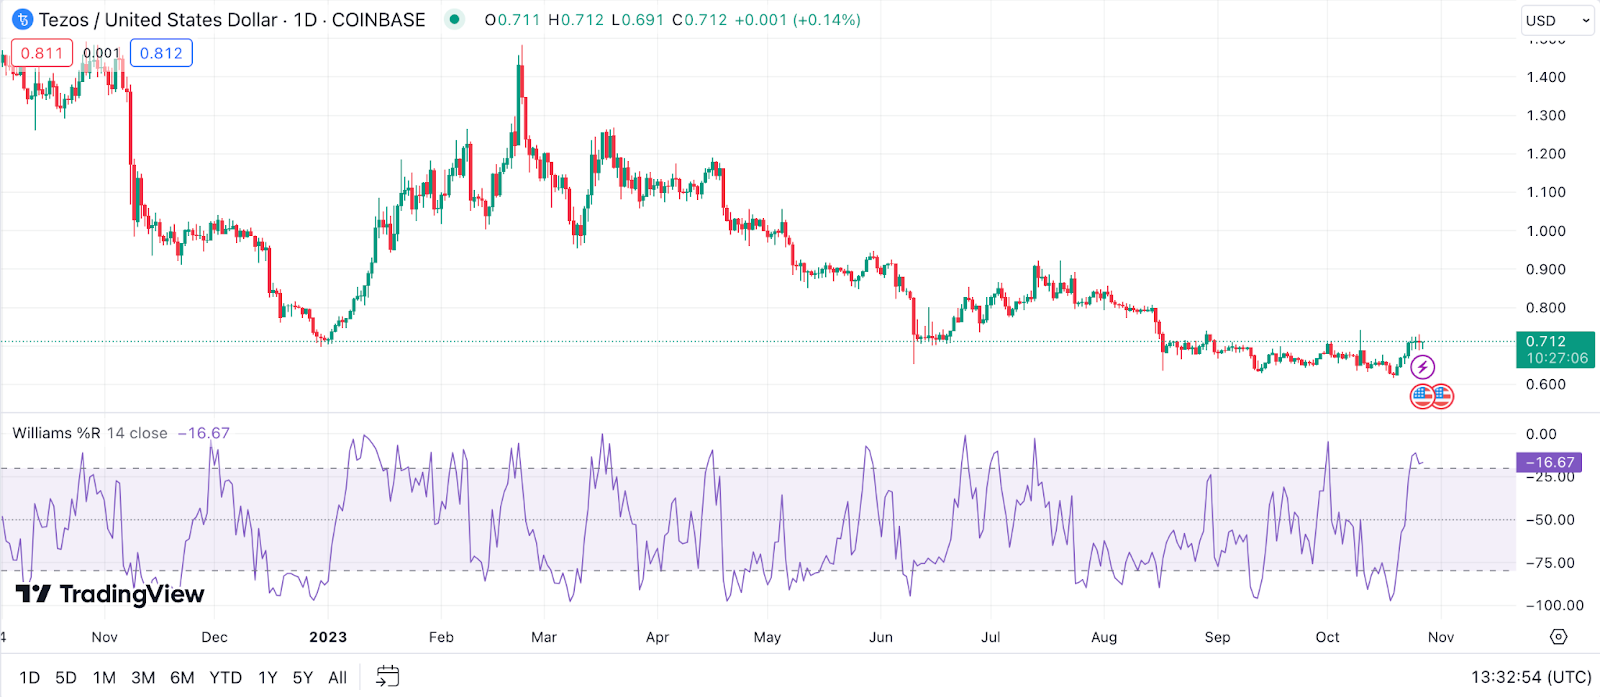
Example: If you’re observing XTZ’s recent price activity and notice that the Williams %R has dipped to -85, this might suggest that Tezos is currently oversold. However, a subsequent upward move of the indicator crossing the -80 threshold could be interpreted as a bullish sign, indicating a potential turnaround in price. Conversely, if XTZ had a strong upward momentum and the Williams %R surged to -15, it might imply overbought conditions. A downward cross of the -20 level shortly after could hint at an impending price correction.
Combining Technical Indicators for Accurate Tezos Price Prediction
Trading and investing in cryptocurrencies like Tezos (XTZ) can feel like navigating through a vast, unpredictable ocean. Waves of volatility and uncertainty make it paramount for traders to employ every navigational tool in their arsenal. One way to achieve greater accuracy in forecasting Tezos price movements is by combining multiple technical indicators. Let’s delve deeper into this approach.
The Importance of Using Multiple Technical Indicators
Ever heard the saying, “Don’t put all your eggs in one basket?” Well, it rings especially true in the world of crypto trading. Relying solely on one technical indicator can be likened to navigating blindfolded. While each technical tool offers valuable insights, they also come with their limitations. By using a combination of indicators, traders can cross-verify bullish signals, reduce false alarms, and achieve a more holistic view of the market. This multidimensional analysis ensures that if one indicator misses a crucial price movement or sends a false signal, another might catch it.
How to Combine Various Indicators for a Comprehensive Analysis
Now that we’ve underscored the importance, let’s discuss the ‘how’. Combining indicators can feel overwhelming, given the vast array available. Here are some tips to streamline the process and effectively gauge XTZ price:
- Balance Momentum and Trend Indicators: While momentum indicators like RSI or Stochastic Oscillator highlight overbought or oversold conditions, trend indicators like Moving Averages help in identifying the asset’s direction. Utilizing both can provide a clearer picture of potential reversals or trend continuations.
- Factor in Volatility: Indicators like Bollinger Bands or Keltner Channel can give insights into market volatility. When paired with other tools, they can highlight price breakouts or potential trend strength.
- Use Different Timeframes: Some indicators may work better on longer timeframes, while others shine in shorter ones. Analyzing XTZ across multiple timeframes can offer varied perspectives and more comprehensive insights.
- Limit the Number: While it’s tempting to use numerous indicators, it can lead to analysis paralysis. Choose a few complementary ones that resonate with your trading style and strategy.
- Always Backtest: Before applying a combination of indicators to your live trading, backtest your strategy using historical data. This step can help you understand the efficacy of your chosen indicators when combined.
Remember, the essence of combining technical indicators lies in diversification, minimizing risks, and enhancing prediction accuracy. However, always pair your technical insights with fundamental analysis and stay updated on the broader crypto landscape to make well-informed decisions.
The Pillars of Tezos Prediction: Fundamental Factors
Cryptocurrencies are more than just lines on a chart or numbers on a screen. They’re an embodiment of innovative technology, evolving regulations, and societal shifts. For Tezos (XTZ), several fundamental factors play a pivotal role in its price dynamics. Let’s unpack these pillars and understand how they influence Tezos’ market position.
Adoption Rate
The adoption rate of any cryptocurrency serves as a compass pointing towards its overall health in the marketplace. It reflects not just the coin’s present vitality but also provides glimpses into its future potential. For Tezos, several indicators can help discern its rate of adoption. Here’s a deep dive into these metrics:
- Network Activity: Active addresses and transactions give a firsthand look into the coin’s usage. A consistent increase in these figures suggests that more people are using Tezos, either for transactions or as a store of value. For instance, if Tezos sees a spike in its daily transactions, it might imply a growing interest in its capabilities or an ongoing event prompting the activity.
- Developer Activity: Behind every robust cryptocurrency is a bustling community of developers. Regular updates, bug fixes, and the rollout of new features indicate a vibrant and committed developer ecosystem. If, say, there’s an uptick in contributions to Tezos’ GitHub repositories, it suggests heightened developer interest and activity.
- Partnerships and Integrations: Strategic alliances can catapult a cryptocurrency into new arenas. Tezos forging a partnership with a significant player in the finance or tech sector, for instance, could be a testament to its growing industry relevance.
- Staking and Delegation: Given Tezos’ unique proof-of-stake consensus mechanism, observing the staking and delegation trends becomes crucial. An increasing number of XTZ being staked or higher delegation rates can point to rising confidence within the Tezos community.
- Educational Outreach: The establishment and growth of Tezos-centric educational initiatives reflect on its community’s intent to foster understanding and garner wider adoption. Suppose there’s a surge in online courses, workshops, or seminars dedicated to Tezos. In that case, it’s a sign of the community’s commitment to expanding its user base.
- Exchange Listings: Being listed on prominent exchanges not only enhances liquidity but also broadens accessibility. If Tezos gets listed on more significant exchanges or if existing exchanges enhance XTZ trading options, it could indicate a wider market acknowledgment and increased demand.
To wrap it up, a coin’s adoption rate is like its pulse. By keeping a finger on it and monitoring these metrics, one can get a nuanced understanding of Tezos’ position in the crypto world and where it might be heading.
Regulatory Developments
Regulatory landscapes are like shifting sands beneath the feet of every cryptocurrency. They have the power to either propel a crypto to new heights or stymie its progress. For Tezos, as with other digital assets, being attuned to regulatory changes is paramount. Here’s a dive into potential regulatory developments and their implications for XTZ:
- Global Regulatory Stance: The crypto landscape isn’t regulated uniformly worldwide. If major economies, say, the U.S. or European Union, adopt a favorable stance towards cryptocurrencies, it could pave the way for broader institutional investments in Tezos.
- Security Designations: If a significant jurisdiction deems Tezos, or cryptocurrencies in general, as securities rather than currencies, it could complicate their trading and use. This would necessitate exchanges and users to adhere to stricter financial regulations, potentially impacting XTZ’s liquidity and adoption.
- Tax Implications: Tax treatments of crypto profits play a pivotal role in investment decisions. Should a major country announce favorable tax treatments for staking rewards, for instance, it might spur increased interest in proof-of-stake coins like Tezos.
- Decentralized Application (DApp) Regulations: As Tezos’ ecosystem grows, the regulation surrounding DApps built on it becomes critical. Stricter rules might hinder innovation, while a supportive framework could catalyze the growth of applications on the Tezos platform.
- Cross-Border Transactions: If regulations ease up around international cryptocurrency transactions, Tezos could see an uptick in adoption as a medium of exchange, especially in areas where traditional banking infrastructures are lacking.
- Smart Contract Legislation: Given that Tezos is a platform supporting smart contracts, any regulatory movement around the legitimacy and enforceability of smart contracts could have direct repercussions. If a jurisdiction were to fully recognize and support smart contracts legally, it could be a boon for Tezos-based contract development.
In essence, the crypto space, including Tezos, treads a fine line when it comes to regulations. It’s a blend of uncertainty, potential, and adaptability. For any Tezos enthusiast, investor, or developer, staying updated on regulatory developments is more than just a choice—it’s a necessity for navigating the future.
Utility
Understanding the utility of Tezos goes beyond just knowing its technical specifications or market cap. It’s about grasping the real-world applications and the problems it aims to solve. Tezos, with its self-amending blockchain and on-chain governance, seeks to address some of the challenges faced by traditional cryptocurrencies. Let’s delve deeper into the utility aspects of Tezos:
- Smart Contracts and DApps: One of the foremost utilities of Tezos is its ability to facilitate decentralized applications (DApps) and smart contracts. These self-executing contracts, governed by the explicit terms of agreement between parties, offer a vast potential for automation in numerous sectors. From creating decentralized finance (DeFi) platforms to streamlining administrative processes in various industries, the possibilities seem endless.
- Staking and Baking: Unlike traditional proof-of-work systems that rely on energy-intensive mining, Tezos uses a proof-of-stake mechanism. This allows individuals to ‘bake’ or validate blocks, essentially earning rewards for holding and staking their XTZ. This mechanism promotes both network security and eco-friendliness.
- Decentralized Governance: A significant pain point with many blockchains is the challenge of making upgrades or changes. Tezos stands out with its on-chain governance model, where protocol upgrades are proposed, voted on, and implemented without needing to fork the chain. This dynamic reduces the risks of community splits and ensures smoother evolutionary paths.
- Tokenized Assets: Tezos allows for the creation of tokenized assets, essentially providing a platform for assets like real estate, art, or even stocks to be represented and traded on the blockchain. Such a system could revolutionize asset management, liquidity, and global trade.
- Interoperability: With the crypto world evolving rapidly, the ability for different blockchains and systems to communicate becomes crucial. Tezos, given its flexible design and commitment to innovation, is well poised to adapt and ensure its blockchain remains interoperable with others, enhancing its utility and relevance.
- Scalability Solutions: As demand for blockchain solutions grows, so does the need for these systems to handle higher transaction volumes. Tezos is actively researching and working on layer 2 solutions and other scalability techniques to ensure it remains efficient and competitive.
When we talk about utility, it’s easy to get lost in technical jargon. But at its heart, utility is about answering a simple question: “How does this improve our lives?” For Tezos, the answer lies in its robust platform that promises flexibility, security, and adaptability for a decentralized future.
Market Sentiment: How XTZ News Prediction Works
Market sentiment, sometimes referred to as the ‘mood’ of the market, plays a pivotal role in influencing price direction. For Tezos, as with many other cryptocurrencies, news events, social media buzz, and even global economic scenarios can lead to volatile price swings. Here’s a closer look into understanding how XTZ news prediction functions and the tools and factors that come into play:
- Crypto News Outlets: Websites, blogs, and news platforms dedicated to cryptocurrency often break the latest stories and developments. A significant partnership or an unexpected obstacle can result in immediate price movements. For Tezos enthusiasts, keeping tabs on reliable news sources can offer a heads-up on potential market shifts.
- Social Media Analysis: Twitter, Reddit, and crypto-specific forums are hotbeds of discussions, rumors, and speculations. Tools that monitor social media sentiment, through keyword tracking or sentiment analysis, can provide valuable insights into the current public perception of Tezos.
- Influencer Opinions: In the crypto world, certain figures hold significant sway. Their opinions, whether shared through blog posts, interviews, or tweets, can influence large sections of their followers. A positive nod from a crypto influencer might spur interest and investment in XTZ.
- Technical Analysis: While not strictly ‘news’, chart patterns, and technical indicators can impact sentiment. For instance, if Tezos breaks past a crucial resistance level, it might be seen as bullish, inviting more positive news and encouraging optimistic sentiment.
- Global Economic Events: The broader economic landscape affects cryptocurrencies too. A recession or a significant geopolitical event might lead to a surge in decentralized assets like XTZ, as investors seek alternative safe havens.
- Adoption and Partnerships: Announcements related to Tezos adoption in various industries or notable partnerships can create positive sentiment. Such developments usually signify growth, scalability, and mainstream acceptance.
- Regulatory Announcements: As we discussed earlier, regulatory developments can either spur growth or dampen spirits. Positive regulatory news, like a country officially adopting or favoring XTZ, can significantly uplift sentiment, while stricter regulations can lead to cautiousness among investors.
Unraveling the enigma of market sentiment isn’t an exact science. It’s a blend of staying informed, understanding the psychology of the masses, and sometimes, trusting your gut. As Tezos continues its journey, understanding sentiment will always be a tool in the arsenal of the well-prepared investor.
The Bottom Line: Making Your Own Tezos Price Predictions
In wrapping up our deep dive into Tezos price prediction, it’s vital to reiterate the multifaceted nature of the crypto landscape. We’ve sifted through the insights of seasoned experts, unraveled the cryptic tapestries of technical analysis, and dug deep into the fundamental pillars that underpin XTZ’s value.
While predictions provide a roadmap, remember that the crypto journey is often filled with unexpected detours. It’s always a dance of numbers, sentiment, and global occurrences. As you venture forth, arm yourself with knowledge, stay adaptable, and never underestimate the power of informed decision-making. Happy investing!
FAQ
When Will XTZ Go Up?
Ah, the age-old question many have pondered upon while sipping their morning coffee. Predicting exact timings in the crypto world is like catching a butterfly in a gusty wind – challenging! However, looking at current trends and market factors can give some indication. Stay updated with expert forecasts and, importantly, trust your research.
Should I Buy XTZ?
Well, here’s a golden nugget of good investment advice: never buy into any investment blindly! XTZ has shown promise, but like all investments, it comes with its risks. Dive deep, educate yourself about its pros and cons, and assess whether it aligns with your financial goals. Remember, always consult with financial professionals if you’re on the fence.
How High Can XTZ Go?
If I had a dime for every time someone asked me this! The potential heights of XTZ, or any cryptocurrency for that matter, are influenced by numerous factors – adoption rates, technological advancements, market sentiment, and more. Some experts envision a bright future, but always remember: the sky’s not the limit, your belief is!
Will XTZ Crash Again in 2024?
Gazing into the crystal ball, huh? Predicting crashes is as tricky as predicting bull runs. While XTZ has had its ups and downs, it’s essential to remember that the crypto space is volatile. External factors, regulatory changes, or global events could sway the scales. Keep a keen eye on market dynamics and always have a game plan.