Hello dear readers and fellow crypto enthusiasts! Welcome to another riveting piece on the bustling world of cryptocurrencies. Today, we’re turning our spotlight to the intriguing topic of Gala price prediction. We understand that venturing a guess into GALA’s future price can be like trying to pin the tail on a digital donkey; it’s tough! This is precisely why we’re about to embark on a journey through Gala’s storied history, diving deep into its origin and purpose. Along the way, we’ll unravel the intricate techniques and tools that sharp-minded traders wield in their quest to forecast the GALA crypto rate, and let you in on the musings of some of the industry’s top experts.
Now, you might wonder, “Why all this fuss about predicting the GALA coin’s value?” Well, for both investors and enthusiasts alike, having a clear sense of where GALA might head in the coming years is pivotal. It aids in decision-making, risk management, and in charting a strategic path forward in this ever-volatile crypto realm.
So, are you ready to dive in and discover what the future might hold for GALA? Buckle up, dear reader, and let’s venture into this fascinating exploration together. Continue reading and let’s unravel the mysteries of the crypto cosmos!
Gala (GALA) Overview
| GALA Price | $0.01758 |
| GALA Price Change 24h | 11.61% |
| GALA Price Change 7d | 28.06% |
| GALA Market Capitalization (Market Cap) | $795,232,131.25 |
| GALA Circulating Supply | 45,224,160,928.26 |
| GALA Trading Volume | $181,833,897.87 |
| GALA All-Time High (ATH) | $0.8367 |
| GALA All-Time Low (ATL) | $0.000151 |
A Brief History: Gala and Its Purpose
Gala Games burst onto the scene, introducing the cryptocurrency world to a fresh wave of potential and innovation. Primarily, the Gala project was created as the driving force behind a decentralized gaming ecosystem. The idea was tantalizingly simple, yet revolutionary: empower players with true ownership of their in-game assets. For years, gamers had poured money and countless hours into their virtual items, only to realize they had no real ‘ownership.’ Gala sought to change that, putting control back into the players’ hands, allowing them to buy, sell, and trade assets as they pleased.
This player-first philosophy caught the attention of many. The platform began attracting gamers, developers, and investors alike. As with any crypto project, the journey wasn’t without its hiccups. Yet, it’s the vision and tenacity behind Gala that has seen it remain a pertinent player in the crypto space.
But let’s talk numbers, shall we? When discussing Gala price prediction, it’s essential to appreciate its historical trajectory. And, boy, what a roller-coaster it’s been!
Notable Price Changes of GALA Coin:
- Early Days: The humble beginnings, with prices barely scratching the surface.
- First Spike: A notable surge as the gaming community caught wind of Gala’s potential.
- Subsequent Dips: As with most cryptos, volatility meant sharp declines after highs.
- Recent Highs: With increased adoption and recognition, GALA cryptocurrency saw impressive peaks.
- Current State: While the market is ever-fluid, recent trends indicate a stabilizing pattern (though, always be prepared for surprises!).
Gala – GALA Price Prediction For Today, Tomorrow, This Week, and Next 30 Days
| Date | Price | Change |
|---|---|---|
| July 12, 2025 | 0.01765 | 0.42% |
| July 13, 2025 | 0.01773 | 0.42% |
| July 14, 2025 | 0.01785 | 0.70% |
| July 15, 2025 | 0.01788 | 0.15% |
| July 16, 2025 | 0.01802 | 0.80% |
| July 17, 2025 | 0.01816 | 0.76% |
| July 18, 2025 | 0.01810 | -0.33% |
| July 19, 2025 | 0.01806 | -0.19% |
| July 20, 2025 | 0.01801 | -0.30% |
| July 21, 2025 | 0.01814 | 0.73% |
| July 22, 2025 | 0.01807 | -0.42% |
| July 23, 2025 | 0.01814 | 0.41% |
| July 24, 2025 | 0.01826 | 0.66% |
| July 25, 2025 | 0.01829 | 0.18% |
| July 26, 2025 | 0.01817 | -0.66% |
| July 27, 2025 | 0.01825 | 0.45% |
| July 28, 2025 | 0.01822 | -0.16% |
| July 29, 2025 | 0.01830 | 0.39% |
| July 30, 2025 | 0.01824 | -0.30% |
| July 31, 2025 | 0.01807 | -0.91% |
| August 01, 2025 | 0.01807 | -0.05% |
| August 02, 2025 | 0.01822 | 0.87% |
| August 03, 2025 | 0.01832 | 0.52% |
| August 04, 2025 | 0.01814 | -0.97% |
| August 05, 2025 | 0.01828 | 0.78% |
| August 06, 2025 | 0.01811 | -0.94% |
| August 07, 2025 | 0.01805 | -0.33% |
| August 08, 2025 | 0.01817 | 0.65% |
| August 09, 2025 | 0.01812 | -0.24% |
| August 10, 2025 | 0.01801 | -0.62% |
Gala Price Prediction 2024
After carefully reviewing the projected price data for Gala tokens in 2024, we’ve come to some interesting conclusions. Our analysis points to a potential minimum price of $0.01583. On the other hand, the average price is expected to hover around $0.01846. And if things take a bullish turn, we could see highs of up to $0.02110.
From where we stand, the Gala coin price prediction 2024 seems promising and stable, showcasing a decent growth trajectory. This relatively steady price prediction suggests that we might be spared from extreme market roller-coasters. Yet, for the more adventurous among you, this could spell a golden chance for impressive gains, especially given Gala’s innate market volatility.
A little nugget of wisdom for our crypto enthusiasts: navigate with caution. Always prioritize in-depth research and comprehensive due diligence before taking the investment plunge, particularly in the unpredictable world of cryptocurrencies.
| Month | Minimum Price | Average Price | Maximum Price |
|---|---|---|---|
| February 2024 | 0.02784 | 0.02891 | 0.03010 |
| March 2024 | 0.02859 | 0.02969 | 0.03091 |
| April 2024 | 0.02936 | 0.03049 | 0.03174 |
| May 2024 | 0.03016 | 0.03132 | 0.03260 |
| June 2024 | 0.03097 | 0.03216 | 0.03348 |
| July 2024 | 0.03181 | 0.03303 | 0.03438 |
| August 2024 | 0.03267 | 0.03392 | 0.03531 |
| September 2024 | 0.03355 | 0.03484 | 0.03627 |
| October 2024 | 0.03445 | 0.03578 | 0.03724 |
| November 2024 | 0.03538 | 0.03674 | 0.03825 |
| December 2024 | 0.03634 | 0.03774 | 0.03928 |
| January 2025 | 0.03732 | 0.03875 | 0.04034 |
January 2024: Gala Price Forecast
As the new year begins, the GALA price seems to be showing an upward trajectory. Based on our research, we predict the minimum price to hover around $0.02635, while the average price could settle at $0.02758. For those looking to make trades, be aware that the maximum price might touch $0.02971. These numbers indicate a bullish start to the year, aligning with our optimistic outlook for Gala’s performance.
GALA Price Forecast for February 2024
Crypto analysts have scrutinized the price fluctuations of GALA for February 2024 and project a promising outlook. The minimum price is anticipated to be $0.02784, with a more likely average trading price around $0.02891. Optimistic trends might push the maximum price to reach $0.03010. This month could be seen as a consolidation phase, signaling a good entry point for long-term investors.
March 2024: Gala Price Forecast
According to the latest data gathered, March 2024 shows a steady increase in GALA prices. The minimum price is expected to hover around $0.02859, while the average price could achieve $0.02969. The maximum price might stretch up to $0.03091, reflecting a growing confidence among investors as the market matures.
GALA Price Forecast for April 2024
As we delve into April, the technical analysis of GALA prices indicates a continuation of the upward trend. April’s minimum price is forecasted to be $0.02936, with an average price potentially reaching $0.03049. The maximum price could escalate to $0.03174, suggesting that traders might witness increased volatility, offering opportunities for both short and long positions.
May 2024: Gala Price Forecast
In the heart of spring, May 2024, crypto experts have analyzed GALA prices to forecast a minimum price of $0.03016. The average price is expected to flourish at $0.03132, while the maximum price could bloom up to $0.03260. These figures suggest that the market’s health is robust, with increasing participation from investors eyeing the mid-year growth.
GALA Price Forecast for June 2024
Looking towards June 2024, the market’s sentiment appears bullish as GALA’s price is predicted to climb further. Experts anticipate a minimum price of $0.03097, an average trading zone at $0.03216, and a potential surge towards a maximum price of $0.03348. This upward trend could be a response to broader market recovery or specific positive developments within the GALA ecosystem.
July 2024: Gala Price Forecast
Crypto experts expect the average price of GALA to maintain its momentum in July 2024. The data indicates a minimum price of $0.03181 and an average price likely to be around $0.03303. Moreover, the maximum price might hit $0.03438, potentially setting new monthly highs and reflecting investor optimism.
GALA Price Forecast for August 2024
The forecast for GALA in August 2024 suggests a slight deceleration in growth with a minimum price of $0.03267. Nevertheless, the average price is expected to remain solid at $0.03392, and the maximum price could peak at $0.03531. This stabilization might indicate a period of accumulation before any significant market moves.
September 2024: Gala Price Forecast
As autumn sets in, September 2024 shows potential for steady growth in GALA’s market value. Analysts expect a minimum price of $0.03355, an average price to settle at $0.03484, and there’s potential for a maximum price of $0.03627. The consistency in the market’s expansion could be a sign of a maturing asset garnering sustained interest.
GALA Price Forecast for October 2024
October 2024’s predictions for GALA are quite optimistic, with a minimum price of $0.03445 indicating strong support levels. The average price is expected to rise to $0.03578, and the maximum price could reach a notable $0.03724. This month may reflect a bullish sentiment, possibly driven by strategic partnerships or platform updates within the GALA ecosystem.
November 2024: Gala Price Forecast
Entering the penultimate month of the year, November 2024’s GALA price forecast shows no signs of slowing down. The minimum price is projected at $0.03538, while the average price is expected to consolidate at $0.03674. The maximum price is predicted to ascend to $0.03825, hinting at continued investor confidence as the year draws to a close.
GALA Price Forecast for December 2024
Rounding out the year, December 2024’s analysis for GALA suggests a bullish trend might persist. The minimum price is forecasted to be $0.03634 with the average price potentially reaching $0.03774. Furthermore, the maximum price could soar to $0.03928, possibly ending the year on a high note and laying a positive foundation for the following year.
Gala Price Prediction 2025
Crypto experts have crunched the numbers and anticipate 2025 to carry forward a trend of steady growth for GALA. We’re looking at a minimal price of $0.03691. As the year progresses, the average price is expected to inch towards $0.04379. For the more bullish amongst us, a maximum price of $0.05208 might be on the horizon.
| Month | Minimum Price | Average Price | Maximum Price |
|---|---|---|---|
| February 2025 | 0.03691 | 0.03833 | 0.03990 |
| March 2025 | 0.03791 | 0.03936 | 0.04098 |
| April 2025 | 0.03893 | 0.04043 | 0.04208 |
| May 2025 | 0.03998 | 0.04152 | 0.04322 |
| June 2025 | 0.04106 | 0.04264 | 0.04439 |
| July 2025 | 0.04217 | 0.04379 | 0.04558 |
| August 2025 | 0.04331 | 0.04497 | 0.04682 |
| September 2025 | 0.04448 | 0.04619 | 0.04808 |
| October 2025 | 0.04568 | 0.04743 | 0.04938 |
| November 2025 | 0.04691 | 0.04871 | 0.05071 |
| December 2025 | 0.04818 | 0.05003 | 0.05208 |
| January 2026 | 0.04948 | 0.05138 | 0.05349 |
Gala Price Prediction 2026
According to the latest data gathered, 2026 might witness a familiar trajectory for GALA. Our predictions start with a minimal price of $0.04894. The average trading price seems promising at $0.05806, while the optimistic end of our spectrum suggests a peak maximum price of $0.06905. Always remember to factor in market variables!
| Month | Minimum Price | Average Price | Maximum Price |
|---|---|---|---|
| February 2026 | 0.04894 | 0.05082 | 0.05290 |
| March 2026 | 0.05026 | 0.05219 | 0.05433 |
| April 2026 | 0.05161 | 0.05360 | 0.05579 |
| May 2026 | 0.05301 | 0.05504 | 0.05730 |
| June 2026 | 0.05444 | 0.05653 | 0.05885 |
| July 2026 | 0.05591 | 0.05806 | 0.06044 |
| August 2026 | 0.05742 | 0.05962 | 0.06207 |
| September 2026 | 0.05897 | 0.06123 | 0.06374 |
| October 2026 | 0.06056 | 0.06289 | 0.06547 |
| November 2026 | 0.06220 | 0.06459 | 0.06723 |
| December 2026 | 0.06387 | 0.06633 | 0.06905 |
| January 2027 | 0.06560 | 0.06812 | 0.07091 |
Gala Price Prediction 2027
Having analyzed GALA prices for 2027, it’s clear that this could be a year of subtle progressions. We’re projecting a minimal price of $0.06488. Maintaining a consistent rise, the average price might settle around $0.07697. And in a best-case scenario, we could be looking at a maximum price of $0.09154.
| Month | Minimum Price | Average Price | Maximum Price |
|---|---|---|---|
| February 2027 | 0.06488 | 0.06737 | 0.07013 |
| March 2027 | 0.06663 | 0.06919 | 0.07203 |
| April 2027 | 0.06843 | 0.07106 | 0.07397 |
| May 2027 | 0.07028 | 0.07298 | 0.07597 |
| June 2027 | 0.07217 | 0.07495 | 0.07802 |
| July 2027 | 0.07412 | 0.07697 | 0.08013 |
| August 2027 | 0.07612 | 0.07905 | 0.08229 |
| September 2027 | 0.07818 | 0.08118 | 0.08451 |
| October 2027 | 0.08029 | 0.08338 | 0.08679 |
| November 2027 | 0.08246 | 0.08563 | 0.08914 |
| December 2027 | 0.08468 | 0.08794 | 0.09154 |
| January 2028 | 0.08697 | 0.09031 | 0.09402 |
Gala Price Prediction 2028
Cryptocurrency experts are leaning into 2028 with a continued positive outlook for GALA. Our data points to a minimal price of $0.08601, and as market dynamics play out, an average price of $0.10205 seems probable. For those looking at the year’s zenith, a potential maximum price of $0.12137 awaits.
| Month | Minimum Price | Average Price | Maximum Price |
|---|---|---|---|
| February 2028 | 0.08601 | 0.08932 | 0.09298 |
| March 2028 | 0.08834 | 0.09173 | 0.09549 |
| April 2028 | 0.09072 | 0.09421 | 0.09807 |
| May 2028 | 0.09317 | 0.09675 | 0.10072 |
| June 2028 | 0.09569 | 0.09936 | 0.10344 |
| July 2028 | 0.09827 | 0.10205 | 0.10623 |
| August 2028 | 0.10092 | 0.10480 | 0.10910 |
| September 2028 | 0.10365 | 0.10763 | 0.11204 |
| October 2028 | 0.10645 | 0.11054 | 0.11507 |
| November 2028 | 0.10932 | 0.11352 | 0.11817 |
| December 2028 | 0.11227 | 0.11659 | 0.12137 |
| January 2029 | 0.11530 | 0.11973 | 0.12464 |
Gala Price Prediction 2029
Diving deep into the financial waves of 2029, GALA’s performance seems poised for some interesting moves. With a starting minimal price of $0.11403, our projections suggest an average price of $0.13529 for the year. For the optimists, the maximum price could very well reach a significant $0.16090.
| Month | Minimum Price | Average Price | Maximum Price |
|---|---|---|---|
| February 2029 | 0.11403 | 0.11841 | 0.12327 |
| March 2029 | 0.11711 | 0.12161 | 0.12660 |
| April 2029 | 0.12027 | 0.12489 | 0.13001 |
| May 2029 | 0.12352 | 0.12827 | 0.13352 |
| June 2029 | 0.12686 | 0.13173 | 0.13713 |
| July 2029 | 0.13028 | 0.13529 | 0.14083 |
| August 2029 | 0.13380 | 0.13894 | 0.14463 |
| September 2029 | 0.13741 | 0.14269 | 0.14854 |
| October 2029 | 0.14112 | 0.14654 | 0.15255 |
| November 2029 | 0.14493 | 0.15050 | 0.15667 |
| December 2029 | 0.14884 | 0.15456 | 0.16090 |
| January 2030 | 0.15286 | 0.15874 | 0.16524 |
Gala Price Prediction 2030
Crypto analysts see 2030 as another step in GALA’s journey upwards. A minimum value of $0.15118 sets the foundation. The average price, keeping in pace with previous years, is likely to revolve around $0.17936. For those keeping an eye on the pinnacle, the year might peak with a maximum price of $0.21331.
| Month | Minimum Price | Average Price | Maximum Price |
|---|---|---|---|
| February 2030 | 0.15118 | 0.15699 | 0.16342 |
| March 2030 | 0.15526 | 0.16123 | 0.16784 |
| April 2030 | 0.15945 | 0.16558 | 0.17237 |
| May 2030 | 0.16376 | 0.17005 | 0.17702 |
| June 2030 | 0.16818 | 0.17464 | 0.18180 |
| July 2030 | 0.17272 | 0.17936 | 0.18671 |
| August 2030 | 0.17738 | 0.18420 | 0.19175 |
| September 2030 | 0.18217 | 0.18917 | 0.19693 |
| October 2030 | 0.18709 | 0.19428 | 0.20225 |
| November 2030 | 0.19214 | 0.19953 | 0.20771 |
| December 2030 | 0.19733 | 0.20491 | 0.21331 |
| January 2031 | 0.20266 | 0.21045 | 0.21907 |
Gala Price Prediction 2031
According to the technical analysis of GALA prices expected for 2031, the year could bring a touch more optimism. Starting with a minimal price of $0.20043, the year’s average price may escalate to $0.23779. And if market dynamics align favorably, a maximum price of $0.28281 is within reach.
| Month | Minimum Price | Average Price | Maximum Price |
|---|---|---|---|
| February 2031 | 0.20043 | 0.20813 | 0.21667 |
| March 2031 | 0.20584 | 0.21375 | 0.22252 |
| April 2031 | 0.21140 | 0.21952 | 0.22852 |
| May 2031 | 0.21711 | 0.22545 | 0.23469 |
| June 2031 | 0.22297 | 0.23154 | 0.24103 |
| July 2031 | 0.22899 | 0.23779 | 0.24754 |
| August 2031 | 0.23517 | 0.24421 | 0.25422 |
| September 2031 | 0.24152 | 0.25080 | 0.26109 |
| October 2031 | 0.24804 | 0.25757 | 0.26813 |
| November 2031 | 0.25474 | 0.26453 | 0.27537 |
| December 2031 | 0.26162 | 0.27167 | 0.28281 |
| January 2032 | 0.26868 | 0.27901 | 0.29045 |
Gala Price Prediction 2032
As we gaze further into the future, 2032 brings a sense of continuity for GALA. A projected minimal price of $0.26572 sets the tone. The average price, based on current trends and insights, should hover around $0.31525. And in an optimistic view, GALA could cap off the year with a maximum price of $0.37494. Always approach with both optimism and caution!
| Month | Minimum Price | Average Price | Maximum Price |
|---|---|---|---|
| February 2032 | 0.26572 | 0.27593 | 0.28725 |
| March 2032 | 0.27290 | 0.28338 | 0.29500 |
| April 2032 | 0.28027 | 0.29104 | 0.30297 |
| May 2032 | 0.28783 | 0.29889 | 0.31115 |
| June 2032 | 0.29561 | 0.30696 | 0.31955 |
| July 2032 | 0.30359 | 0.31525 | 0.32818 |
| August 2032 | 0.31178 | 0.32376 | 0.33704 |
| September 2032 | 0.32020 | 0.33251 | 0.34614 |
| October 2032 | 0.32885 | 0.34148 | 0.35548 |
| November 2032 | 0.33773 | 0.35070 | 0.36508 |
| December 2032 | 0.34685 | 0.36017 | 0.37494 |
| January 2033 | 0.35621 | 0.36990 | 0.38506 |
The Main Questions Of Critical Thinking When We Talk About Gala Price Forecast
Predicting the future of any financial asset is not straightforward, and with the volatile nature of cryptocurrencies, it becomes even more complex. Critical thinking allows us to dissect information, weigh its relevance, and make informed decisions or hypotheses. In this section, we’ve collated a set of essential questions that should guide anyone trying to understand or forecast the price of Gala.
- What fundamental factors are driving the current and predicted price of Gala?
- How does Gala’s historical price data correlate with its projected future?
- What are the major market events that might impact Gala’s price in the coming years?
- Are there any technological advancements or updates expected for Gala, and how might they influence its value?
- How do external market pressures, like the overall health of the crypto market, impact Gala’s price forecast?
- What is the level of adoption of Gala in real-world applications, and how might that affect its demand and price?
- How does the competitive landscape, with other similar cryptocurrencies, impact Gala’s price potential?
- Are there regulatory concerns or changes that could influence Gala’s market position and price?
- How does the sentiment analysis of social media and news sources reflect on Gala’s price trajectory?
- What are the potential risks and rewards associated with investing in Gala based on its price forecast?
- How do global economic conditions and crises impact the crypto market and, specifically, Gala’s price?
- What are the assumptions behind the price prediction models for Gala, and how reliable are they?
- How might the supply and demand factors of Gala shift in the future, and what would be the implications on its price?
- Are there any imminent partnerships, collaborations, or projects associated with Gala that could influence its market value?
- How do the trading volumes of Gala correlate with its price movements?
- Are there any known vulnerabilities or challenges that Gala faces, which could impact its long-term value?
- How does the level of market maturity for Gala compare with other established cryptocurrencies?
- What are the potential market disruptors that could drastically shift Gala’s forecasted price?
- How might changes in blockchain technology or advancements in the broader tech industry influence Gala’s position and value?
- Given the projected price, what is the worst-case scenario for Gala, and what events could lead to this outcome?
These questions serve as a starting point, a roadmap for anyone keen to dissect the future of Gala with a critical eye. Always remember, in the world of cryptocurrencies, being informed and critical in your approach can be the difference between making a good investment decision and an ill-informed gamble.
Gala (GALA) Future Price Predictions by Experts
Delving into insights from industry experts and analysts offers a peek into GALA’s potential future price. Although these perspectives come from seasoned professionals, it’s crucial to remember that they should not be construed as investment advice.
- CaptainAltCoin: According to CaptainAltCoin’s price prediction, the GALA coin might experience a drop to $0.031 by the end of 2024. The platform further predicts a potential rise to $0.0507 by January 2025. CaptainAltCoin estimates that by 2026, GALA could be valued at approximately $0.1364. However, they also anticipate a significant decline by 2028, with the price potentially falling to $0.0775.
- Wallet Investor: According to Wallet Investor’s forecast for GALA, they strike a more bearish tone. The platform suggests that the token could have a challenging year ahead, potentially plummeting to $0.00156 by the end of 2024.
- DigitalCoinPrice: DigitalCoinPrice presents a long-term optimistic stance on Gala. According to their analysis, the GALA token is predicted to surpass the $0.0531 mark in the near future. Following that, they expect the token to continue its upward trajectory, possibly reaching a maximum value of $0.10.
Decoding the Charts: GALA Technical Price Analysis
When diving into the world of cryptocurrency, one often stumbles across intricately plotted graphs and convoluted charts. But worry not, dear reader, for these are simply the maps to the potential treasure of insights they hold. Let’s unpack the art and science of technical analysis and see how it relates to GALA.
One essential tool in this analysis is the use of technical indicators. But what are they, and how do they function? Let’s take a closer look.
- Price Charts: Essential for technical analysts, price charts come in various formats, ranging from line and bar charts to the more detailed candlestick versions. These charts provide a visual representation of historical price data, highlighting potential patterns or trends.
- Trend Analysis: Identifying the dominant trend is paramount in technical analysis. Traders pay close attention to uptrends, marked by consistent higher highs and higher lows, and downtrends, defined by successive lower highs and lower lows. Recognizing these trends offers traders an insight into the cryptocurrency market mood.
- Support and Resistance Levels: Imagine support levels as safety nets where a cryptocurrency’s price rarely falls below. Conversely, resistance levels act as invisible barriers, capping an asset’s upward trajectory. Understanding these boundaries is crucial, as they can pinpoint the ideal times to either enter or exit a trade.
- Technical Indicators: To delve further, technical analysts use a variety of mathematical tools to evaluate market trends and momentum. Well-known indicators encompass moving averages, the Relative Strength Index (RSI), the Moving Average Convergence Divergence (MACD), and the versatile Bollinger Bands.
- Chart Patterns: Much like seasoned detectives, technical analysts continuously search for distinctive chart patterns that predict potential price shifts. Key patterns to track involve formations such as the head and shoulders, double tops and bottoms, triangles, and the rare flags.
- Volume Analysis: Analyzing trade volume can offer a deeper insight into the strength of specific price movements. For example, an increase in volume during a price ascent signals a bullish trend. Conversely, a decline in volume during a price descent might indicate a waning selling drive.
- Timeframes: One of the notable attributes of technical analysis is its adaptability. Analysts can modify their techniques to accommodate various timeframes, from the rapid movements of intraday charts to the more expansive views of weekly or monthly charts. This adaptability often reflects the analyst’s individual strategy and objectives.
Technical Indicators: Origin and Purpose
Technical indicators have been around for a while, emerging as essential tools for traders in the stock, forex, and now, the crypto market. Originally, they were developed to quantify and represent market trends, volume, and other factors in a format that’s easy to interpret. They serve as the compass and binoculars for traders, guiding them through the stormy seas of market volatility.
The Role of Technical Indicators in Financial Markets
In the realm of financial markets, technical indicators play the role of the trusty sidekick. They’re there to back up or challenge your gut feelings with cold, hard data. Whether it’s determining the strength of a current trend or predicting a potential market reversal, these indicators have got you covered. Think of them as the weather forecast of the trading world – while they can’t guarantee that it’ll rain tomorrow, they can certainly give you a heads up if you should bring an umbrella.
How Technical Indicators Can Help Predict Gala Price
Now, applying these tools to GALA, or any cryptocurrency for that matter, can be a game-changer. Given the notorious volatility of crypto markets, having a set of reliable indicators can be akin to having a secret weapon. For instance, by observing momentum indicators, one can gauge the strength behind a price movement of GALA. Is it just a temporary gust of wind, or is a storm brewing? On the other hand, oscillators might hint at whether GALA is currently undervalued or overvalued, giving traders insights on potential entry or exit points.
Gaining a solid understanding of the primary technical indicators is vital, particularly when delving into crypto price analysis and forecasting GALA’s potential value. In this section, I will outline the fundamental indicators that have profoundly impacted my trading journey. Moreover, I will offer practical examples to showcase their effective application in GALA price predictions.
Moving Averages (MAs) for Gala Price Prediction
One of the most widely used technical indicators, Moving Averages (MAs), help smoothen out price data to form a single flowing line, which makes it easier to identify the direction of the trend. The basic principle behind MAs is to analyze if the price of an asset, in this case, GALA, is above or below its average over a specified period.
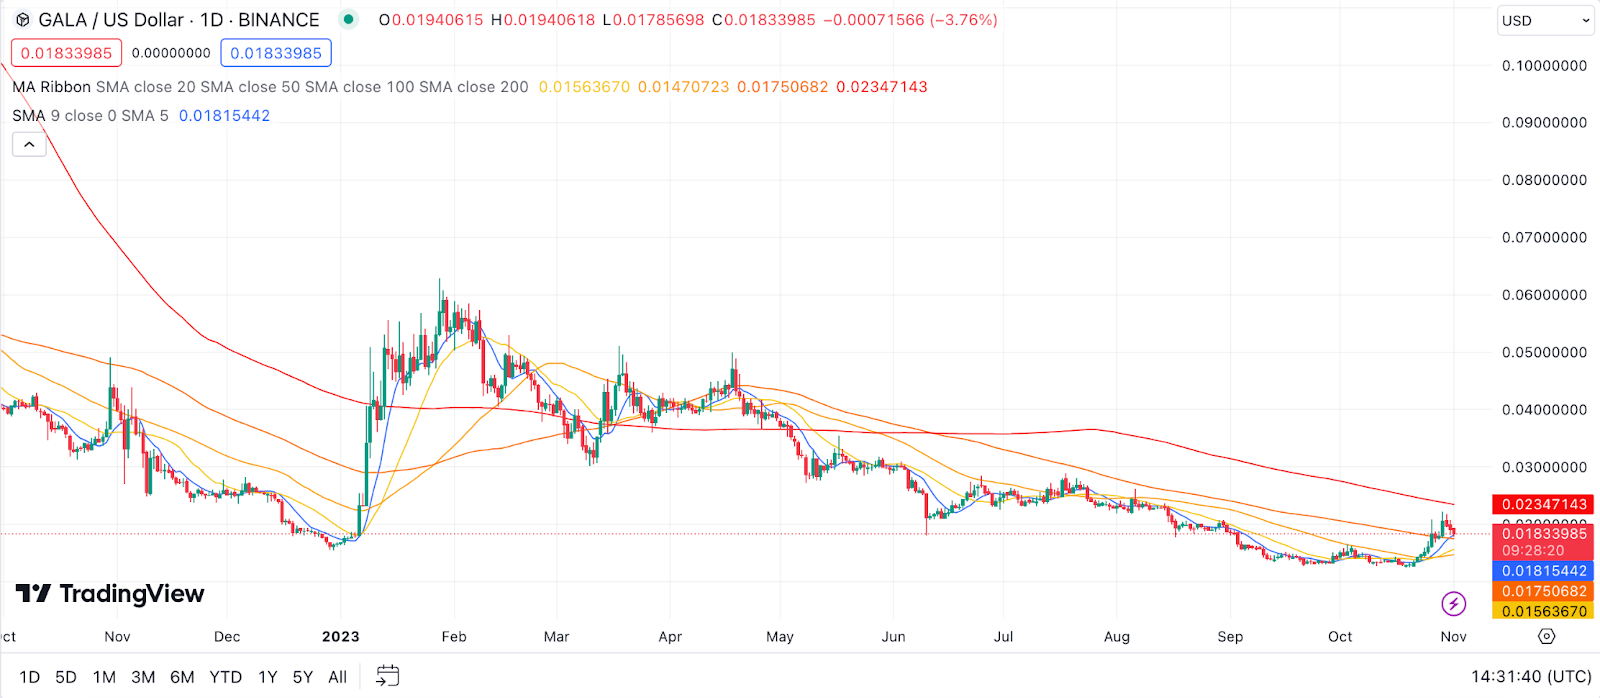
Example: Suppose the 50-day MA of GALA is trending upwards and its price is above this line. This can be seen as a bullish signal, indicating that the asset might continue its upward trajectory in the short term. Conversely, if GALA’s price falls below the 50-day MA and the MA line starts to decline, this might suggest a potential bearish turn.
Relative Strength Index (RSI) for Gala Price Prediction
RSI, or the Relative Strength Index, measures the speed and change of price movements. It ranges from 0 to 100 and is typically used to identify overbought or oversold conditions in a traded security. When RSI is above 70, it suggests that GALA might be overbought (and hence might be due for a price correction). If it’s below 30, GALA could be oversold and might soon witness a price bounce.
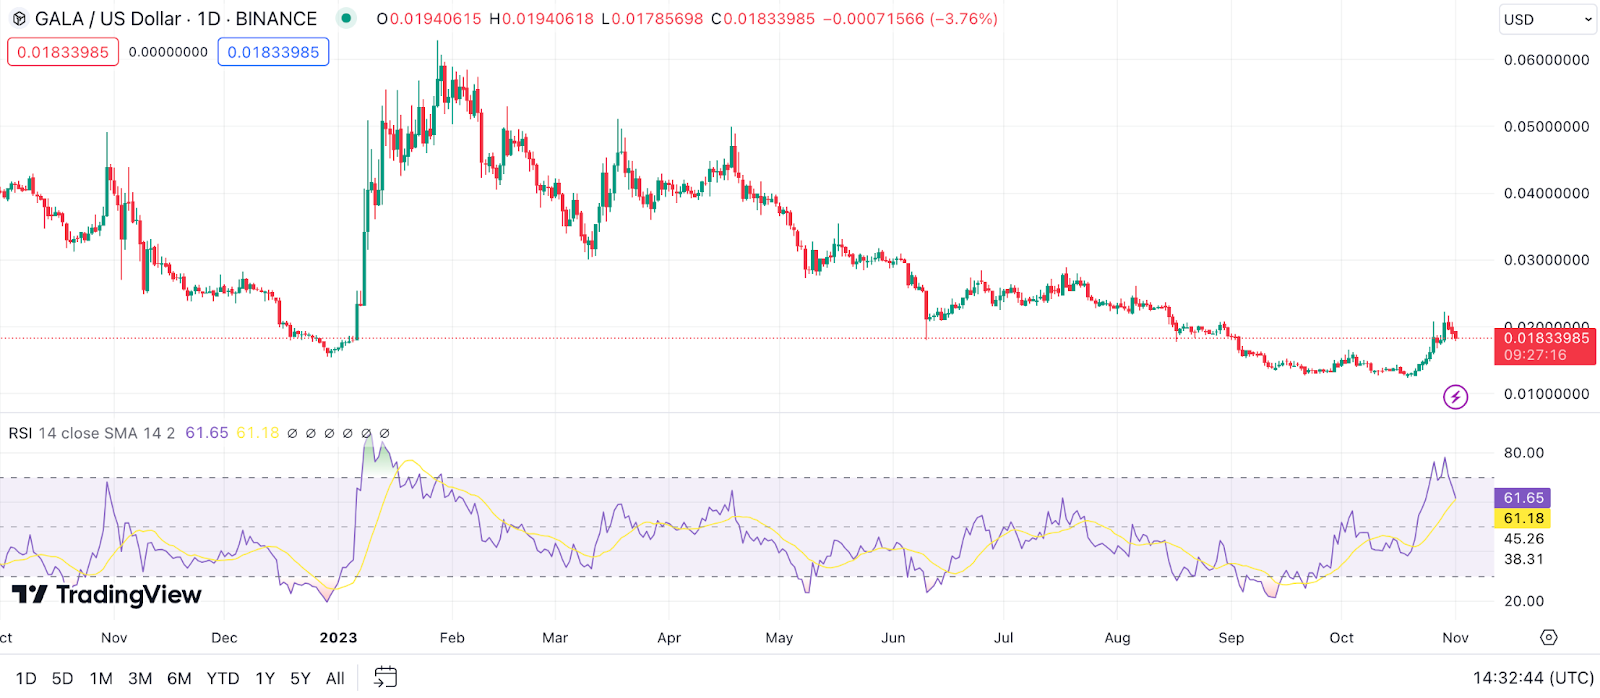
Example: If GALA’s RSI value hits 75, it suggests that there has been a lot of buying action recently. This could indicate that the asset is overbought, and a trader might consider this a sign to sell. On the other hand, if the RSI drops to 20, showing that GALA has been sold excessively, this could be an opportune moment to buy, expecting a price rebound.
Moving Average Convergence Divergence (MACD) for Gala Price Prediction
MACD is a trend-following momentum indicator that shows the relationship between two moving averages of a security’s price – typically the 12-day and 26-day moving averages. When the MACD line crosses above the signal line, it’s a bullish sign, suggesting that the price of the asset (GALA, in this context) is likely to experience upward momentum. Conversely, when the MACD falls below the signal line, it can be a bearish indicator.
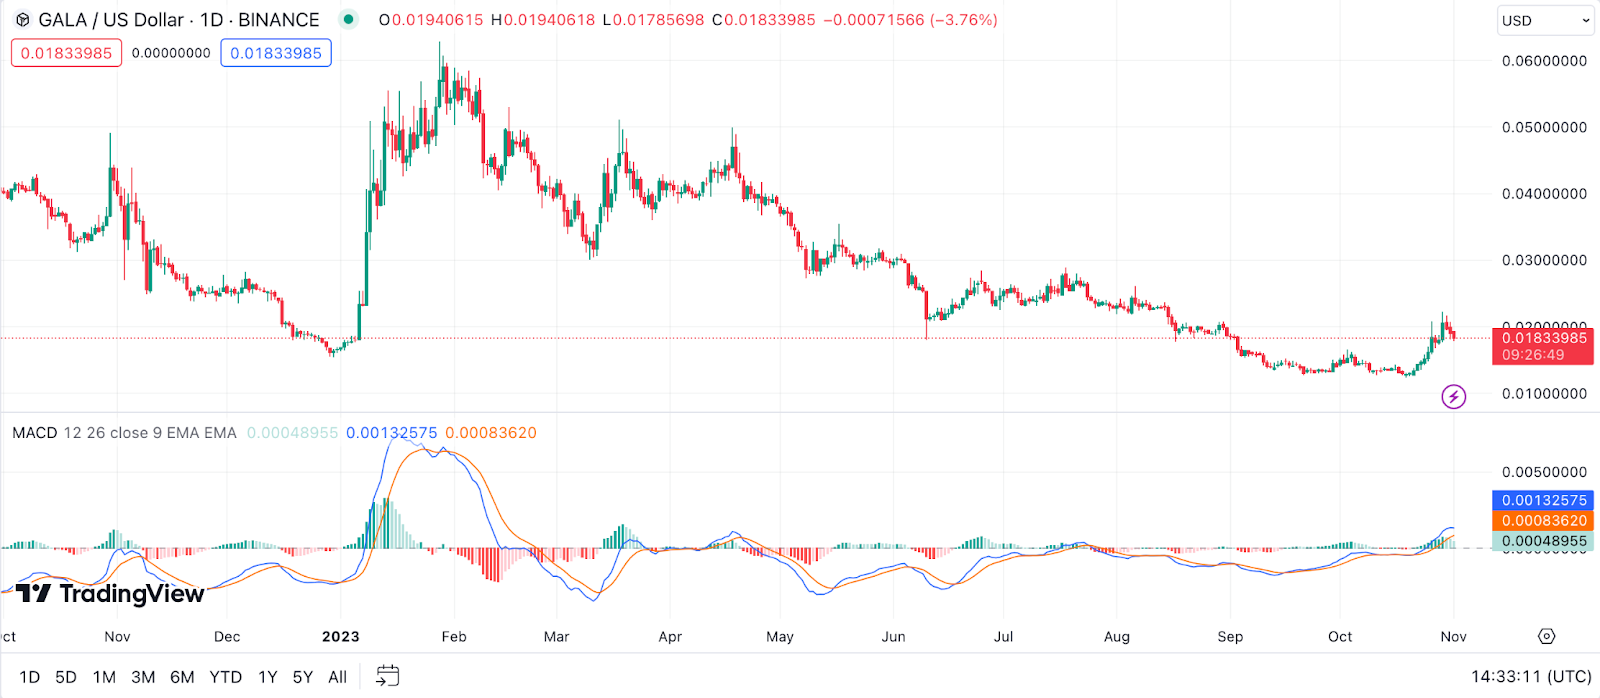
Example: Let’s say the MACD line for GALA crosses above the signal line while both lines are below the zero mark. This is a bullish signal, indicating that it might be a good time to consider buying GALA. If the opposite happens and the MACD line crosses below the signal line, especially if both are above the zero mark, it suggests potential selling momentum.
Bollinger Bands for Gala Price Prediction
Bollinger Bands consist of three lines: the middle band being a simple moving average, and the upper and lower bands set at a specified number of standard deviations away from this middle band. This tool is particularly effective in determining volatility and potential buy and sell signals. When the price of an asset like GALA touches the upper band, it might be seen as overbought, while touching the lower band can indicate an oversold condition.
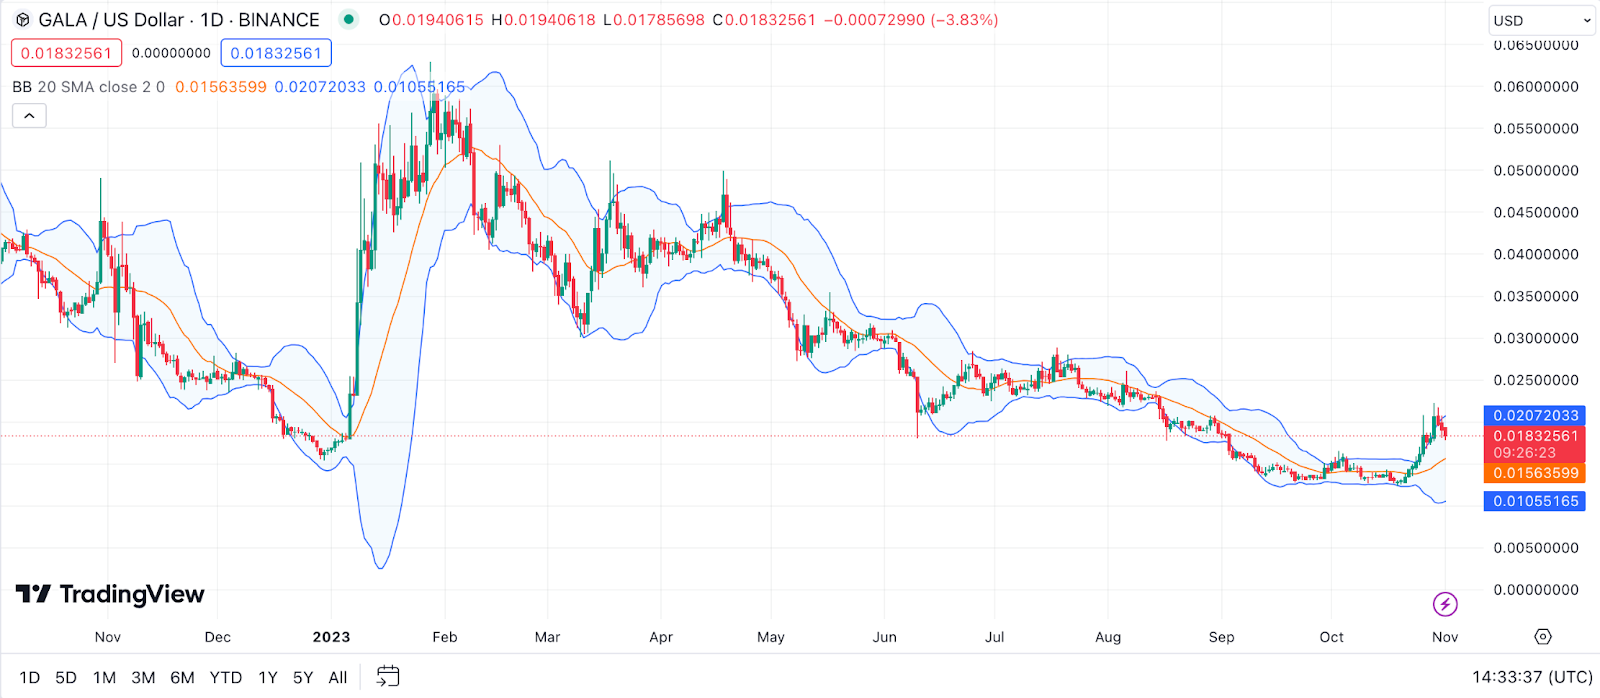
Example: Imagine GALA’s price continually touching or crossing the upper Bollinger Band while the bands are expanding. This indicates strong upward momentum, but caution is advised as it could also suggest that GALA is becoming overbought and may be due for a pullback. If the price moves near or below the lower band, it might be a buying signal for some, especially if the asset appears undervalued on other metrics.
Stochastic Oscillator for Gala Price Prediction
The Stochastic Oscillator compares an asset’s closing price to its price range over a specific time frame. Values above 80 are generally considered overbought, while values below 20 are viewed as oversold. This oscillator can be instrumental in predicting price turnarounds by indicating momentum shifts.
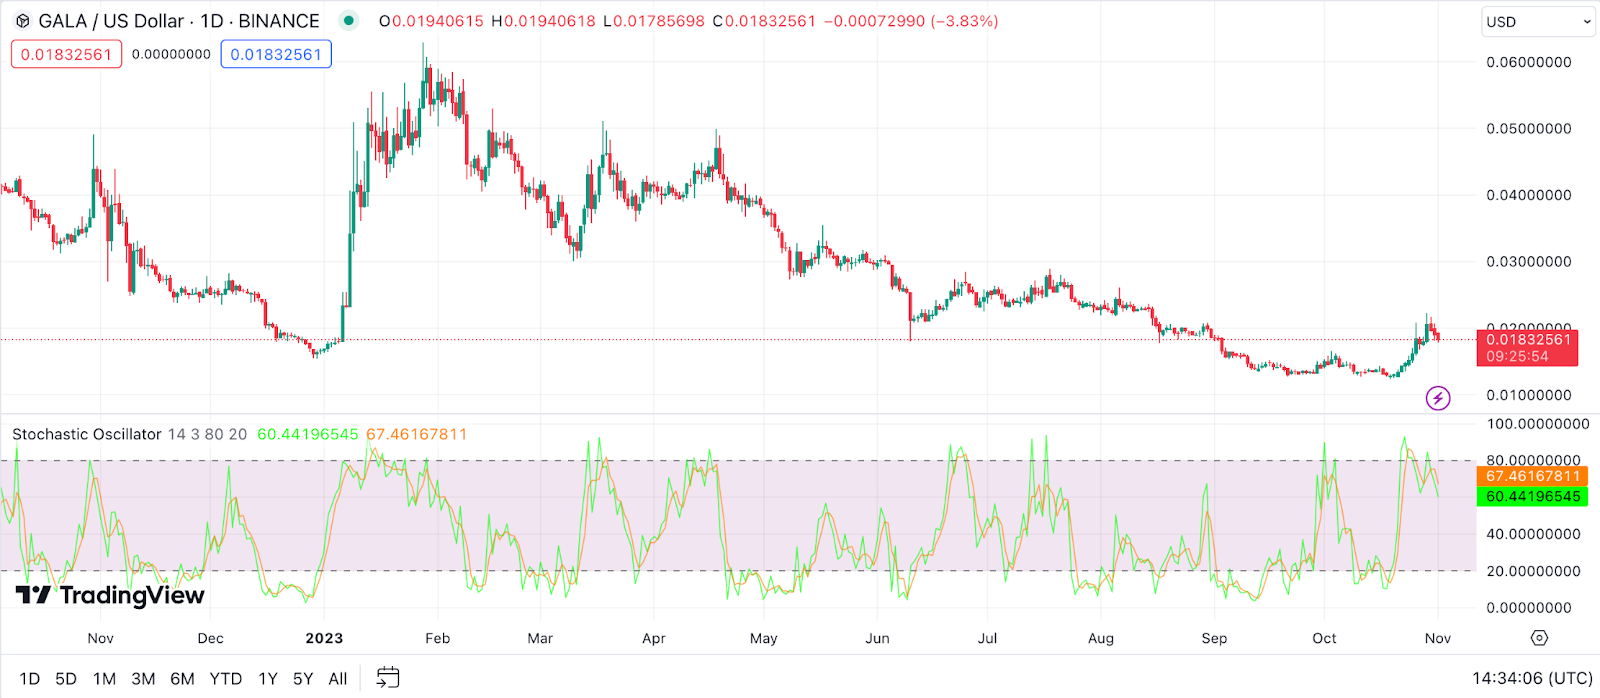
Example: If GALA’s Stochastic Oscillator value surges above 80, it means that the cryptocurrency is potentially overbought, and there could be a sell-off soon. Conversely, if the value drops below 20, it might indicate that GALA is oversold, suggesting a potential price bounce or reversal in the near future.
Parabolic SAR (Stop and Reverse) for Gala Price Prediction
The Parabolic SAR provides entry and exit points based on the price chart’s direction. When the dots are below the asset’s price, it indicates an uptrend, making it an ideal time to buy. When dots appear above the price, it signifies a potential downtrend, hinting at a sell signal.
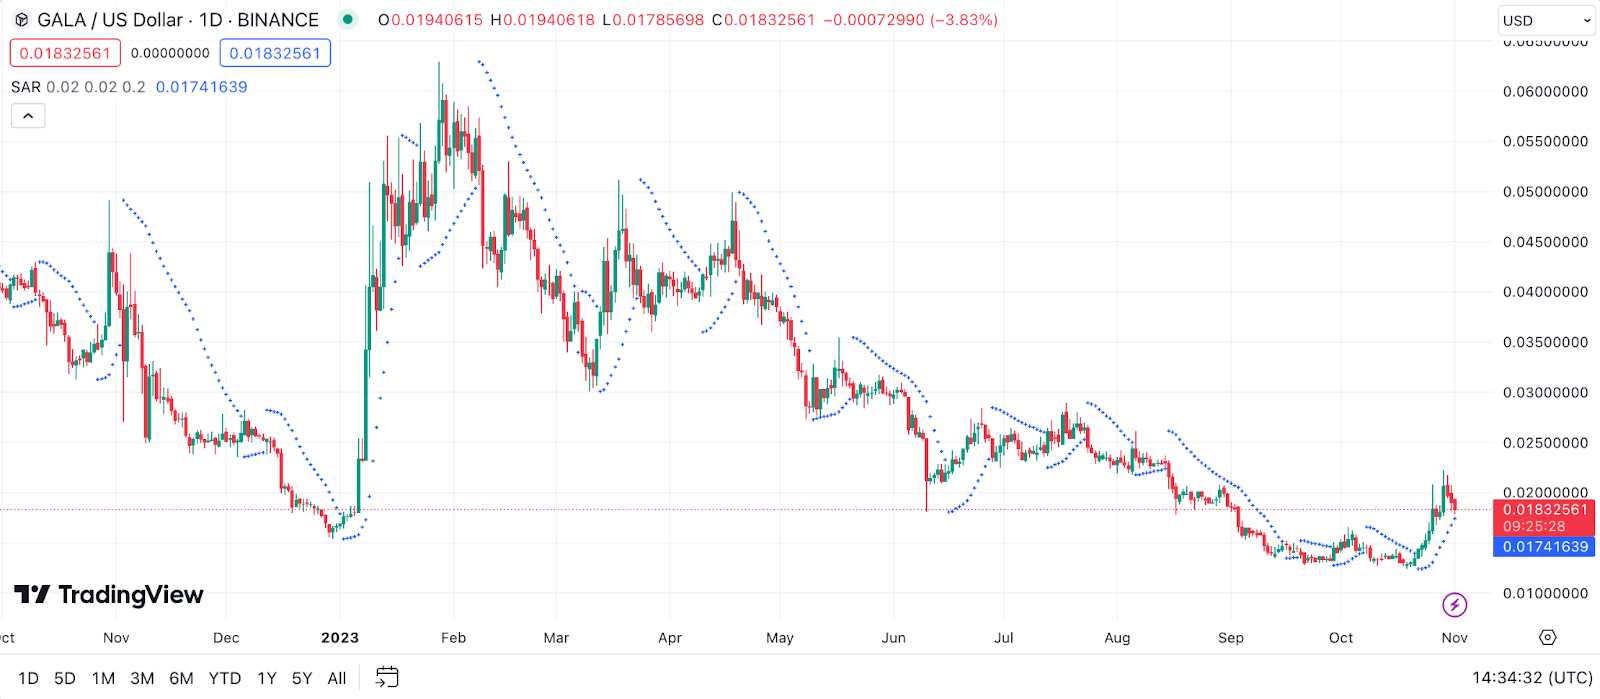
Example: Consider a situation where GALA’s price has been on a consistent uptrend, and the Parabolic SAR dots are beneath the price chart. This trend suggests that it might be a favorable time to hold or buy more of GALA. However, when the dots shift and start appearing above the price, it’s a warning of a possible trend reversal, indicating that traders might want to consider taking profits or setting stop-loss orders.
Ichimoku Cloud for Gala Price Prediction
The Ichimoku Cloud, or Ichimoku Kinko Hyo, is a comprehensive indicator offering insights into support and resistance, momentum, and the market’s direction. It consists of five lines: Tenkan-sen, Kijun-sen, Senkou Span A, Senkou Span B, and Chikou Span. When prices are above the cloud, it typically indicates bullish momentum, and when they’re below, it suggests bearish momentum. A crossover of the Tenkan-sen and Kijun-sen can also signal potential buy or sell points.
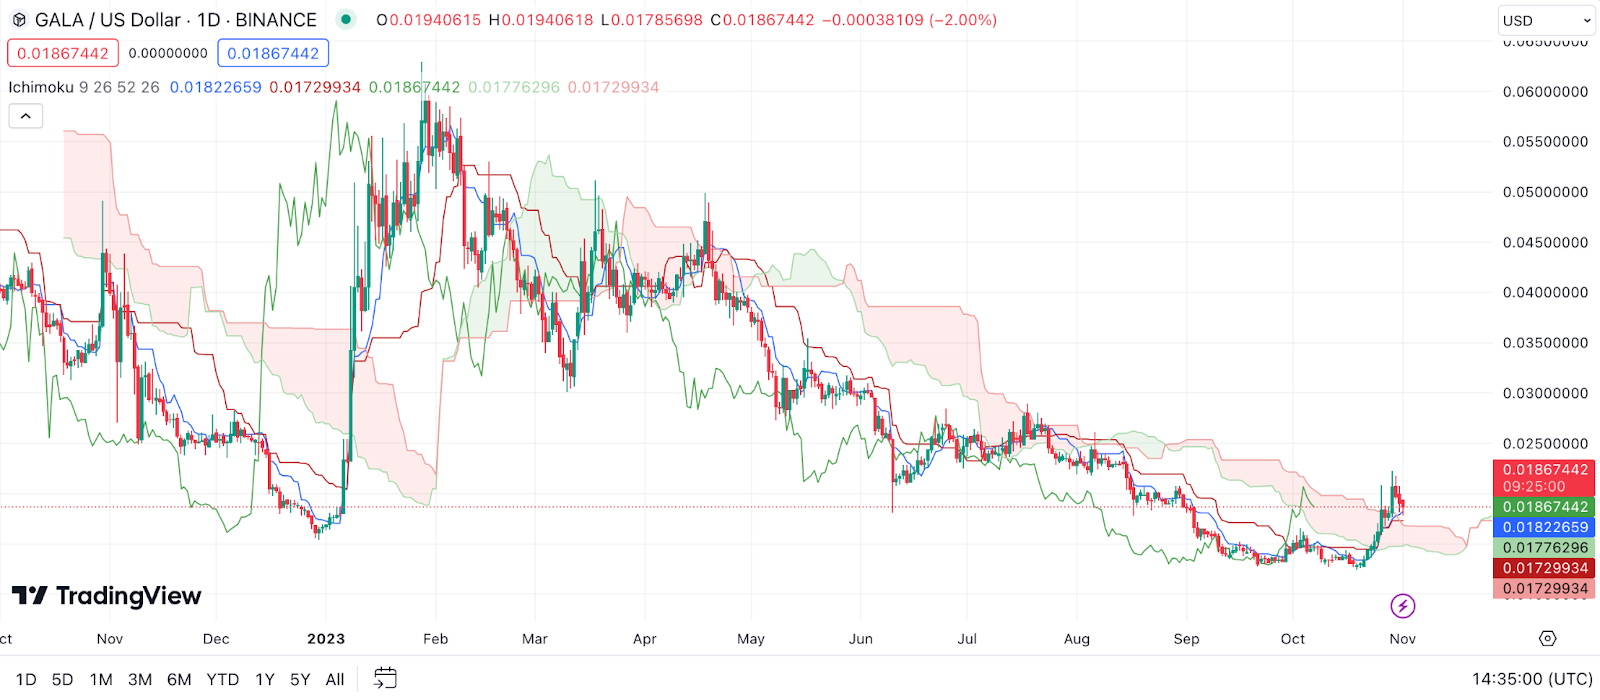
Example: If GALA’s price moves above the Ichimoku Cloud while the Tenkan-sen crosses above the Kijun-sen, this is a bullish signal. Traders might consider entering a long position. On the flip side, if GALA’s price drops below the cloud and the Tenkan-sen crosses below the Kijun-sen, it suggests bearish momentum, hinting at a potential sell-off.
Fibonacci Retracement for Gala Price Prediction
Fibonacci Retracement is a key tool to identify potential support and resistance levels based on historical price data. By drawing horizontal lines at specific intervals (based on Fibonacci numbers), traders can pinpoint where the price may potentially reverse its direction. Common retracement levels include 23.6%, 38.2%, 50%, 61.8%, and 78.6%.
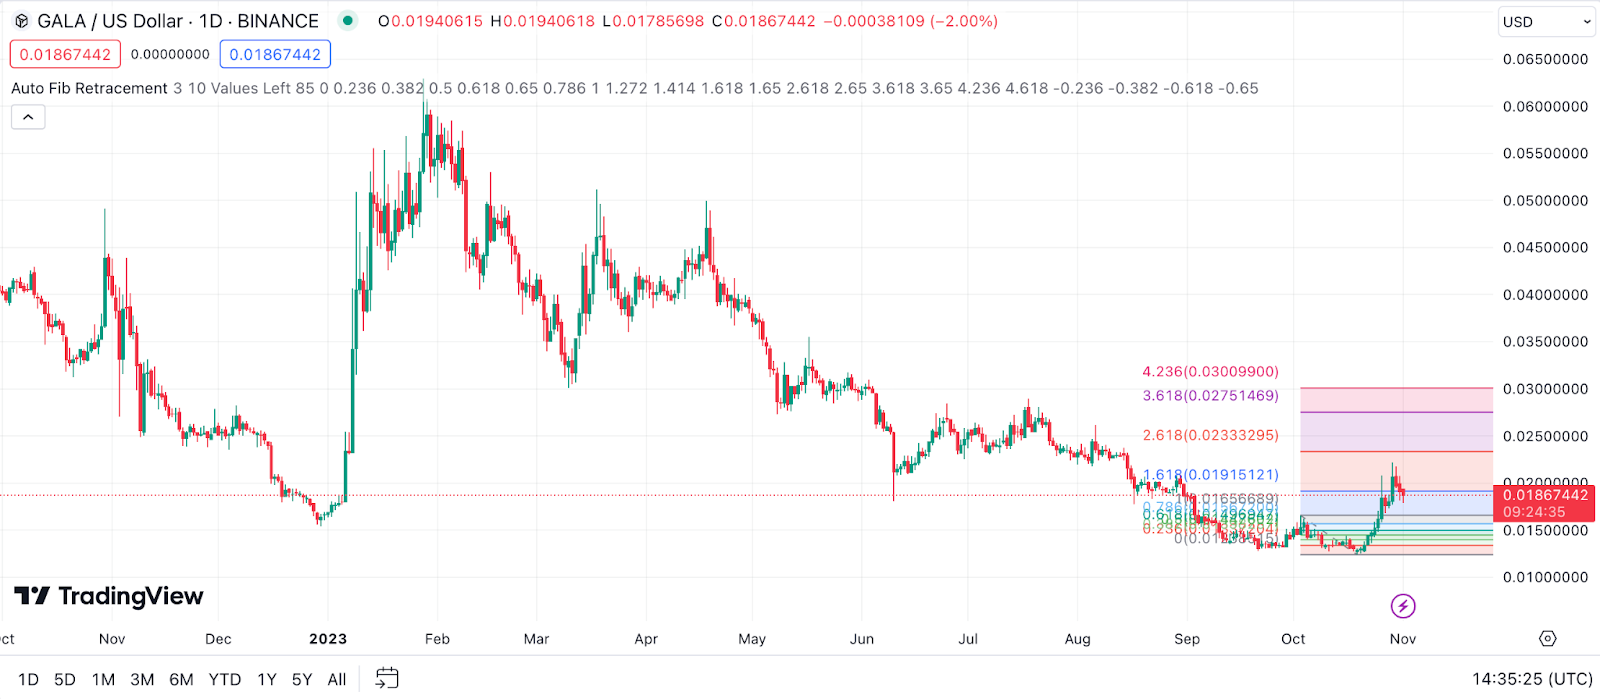
Example: Imagine GALA experiences a robust upward move from $0.05 to $0.10, followed by a pullback. By applying the Fibonacci retracement tool, if GALA’s price halts its decline around the $0.082 level (38.2% retracement), it might be viewed as a potential support area. Should the price bounce from this level, traders might consider it a good entry point for a long position, anticipating further upward movement.
Average Directional Index (ADX) for Gala Price Prediction
The ADX measures the strength of a trend irrespective of its direction. Typically scaled from 0 to 100, values above 25 are considered indicative of a strong trend, while values below 20 suggest a weak trend or a ranging market. The ADX is often accompanied by two other lines, +DI and -DI, which represent upward and downward movements, respectively.
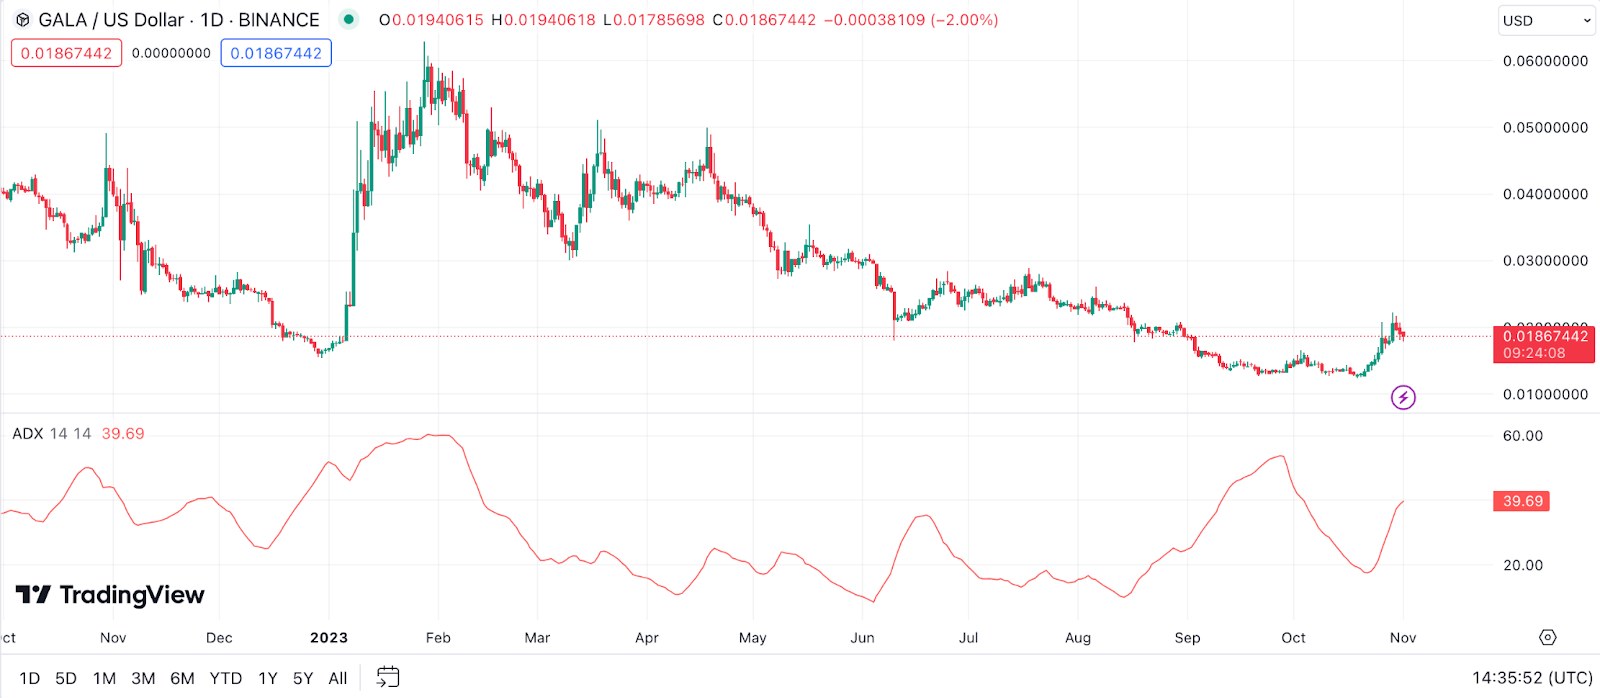
Example: If the ADX for GALA is reading 30 and the +DI line is above the -DI line, this suggests that GALA is in a strong upward trend. In such scenarios, traders might look for opportunities to buy. However, if the -DI line overtakes the +DI while the ADX remains high, it indicates a strong downward trend, prompting caution or potential sell orders.
On Balance Volume (OBV) for Gala Price Prediction
The On Balance Volume (OBV) is a momentum indicator that relates volume to price change. It accumulates volume on up days and subtracts volume on down days, giving a cumulative total. In essence, OBV helps to track the flow of volume in and out of an asset. When OBV rises, it indicates that buyers are willing to step in, suggesting potential price upticks. Conversely, a falling OBV signals that sellers are in control, leading to possible price declines.
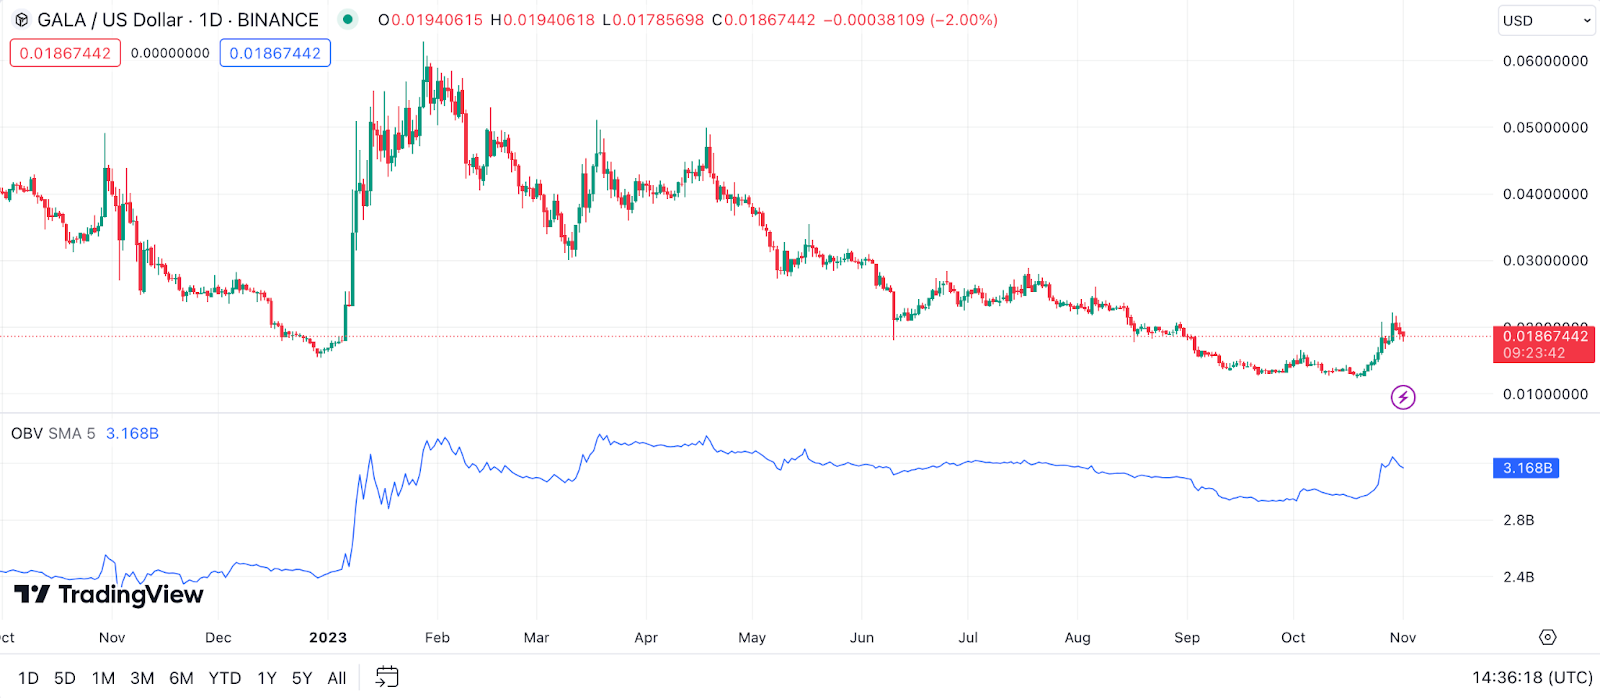
Example: If GALA’s price is steadily rising alongside an upward-trending OBV, it strengthens the argument that the price surge is backed by strong volume. This could be an indicator of a genuine bullish momentum. Conversely, if GALA’s price is rising but OBV is declining, it might suggest a divergence and that the upward trend lacks volume support, hinting at potential price reversals.
Rate of Change (ROC) for Gala Price Prediction
The Rate of Change (ROC) is a momentum oscillator that measures the percentage change in price from one period to another. ROC can be used to detect overbought or oversold conditions, or even to confirm the strength of a trend. A rising ROC indicates increasing momentum, while a declining ROC might signal weakening momentum.
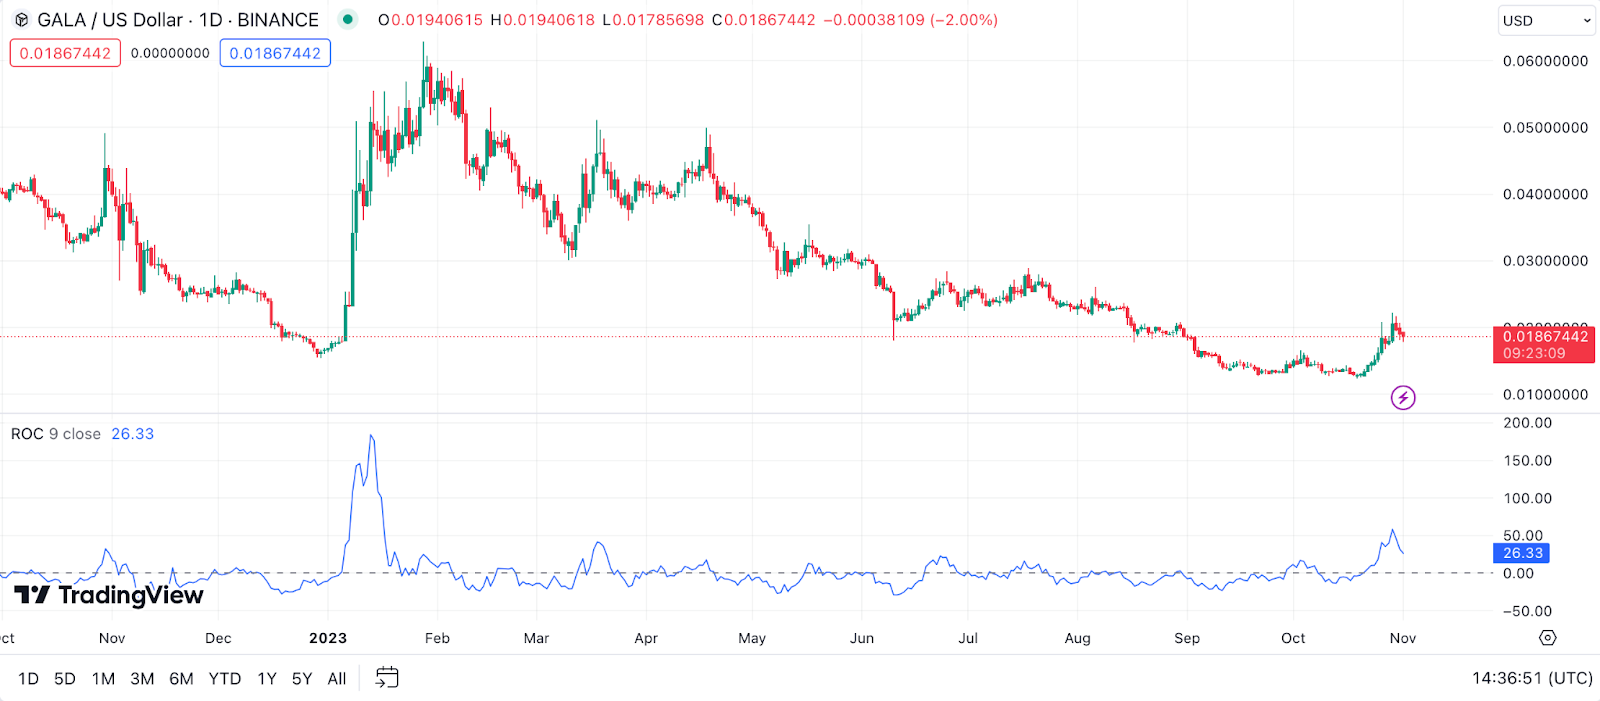
Example: If GALA has recently seen a 10% price surge over the past week and the ROC mirrors this with a move above its baseline into positive territory, it suggests strong bullish momentum. However, if the ROC were to suddenly dip while prices remain high, it might indicate a potential slowdown or reversal.
Commodity Channel Index (CCI) for Gala Price Prediction
The Commodity Channel Index (CCI) measures an asset’s price relative to its average price and divides by the mean deviation. Originally designed for commodities, CCI is now widely used for various assets, including cryptocurrencies. Generally, values above +100 indicate that the asset may be overbought and could be ripe for a price pullback, while values below -100 suggest that the asset might be oversold and poised for a bounce.
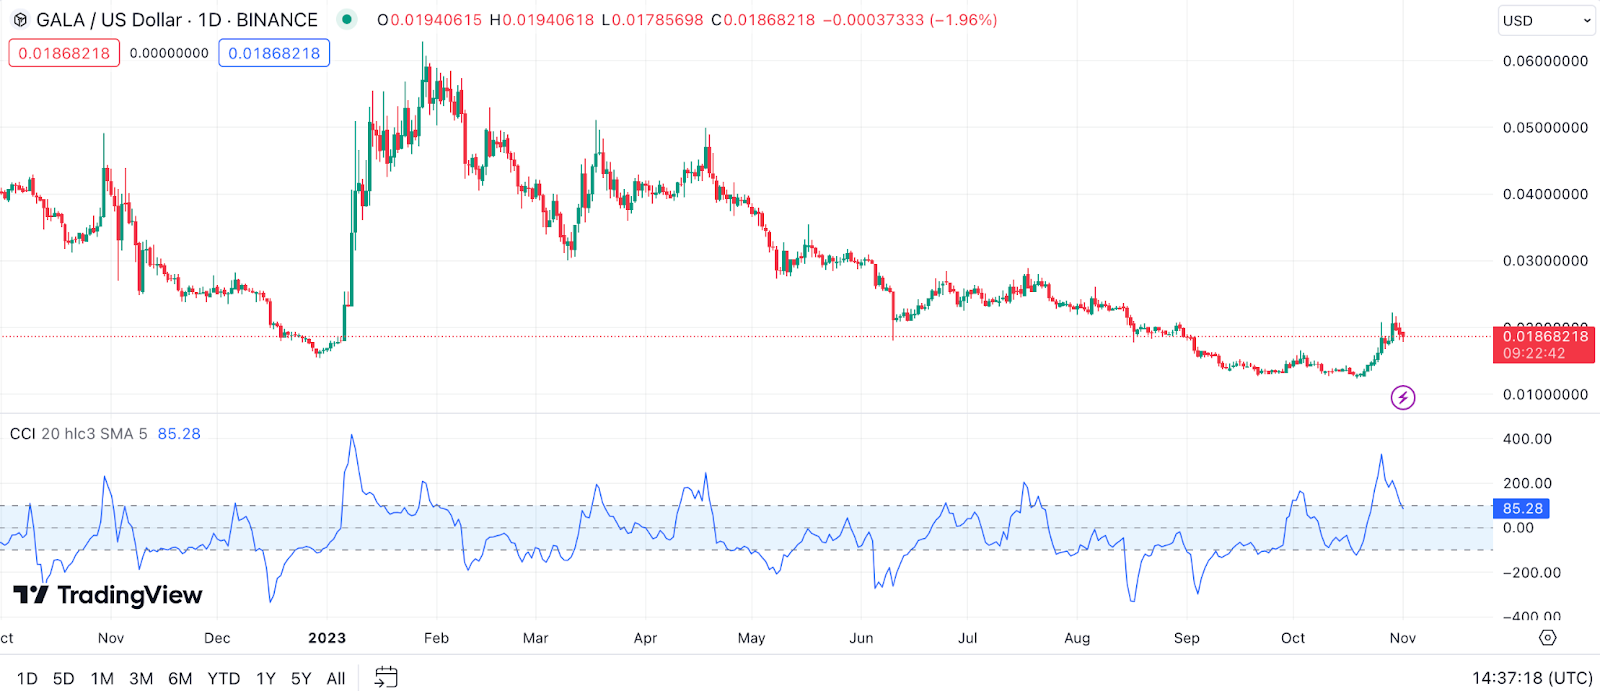
Example: Suppose the CCI for GALA moves above +100 following a sharp upward rally. This could suggest that GALA is potentially overbought and might see a price correction. Conversely, if GALA’s CCI dives below -100 after a prolonged downtrend, it could hint at a potential buying opportunity, anticipating a price bounce.
Accumulation/Distribution Line (A/D Line) for Gala Price Prediction
The Accumulation/Distribution Line (A/D Line) is a volume-based indicator designed to measure the cumulative flow of money into and out of an asset. It takes into account both the volume and price action to provide insights into buying and selling pressure. A rising A/D Line suggests that the asset is being accumulated, as most of the trade volume is associated with upward price movement. Conversely, a falling A/D Line can indicate distribution where the majority of the volume is related to a downward price trend.
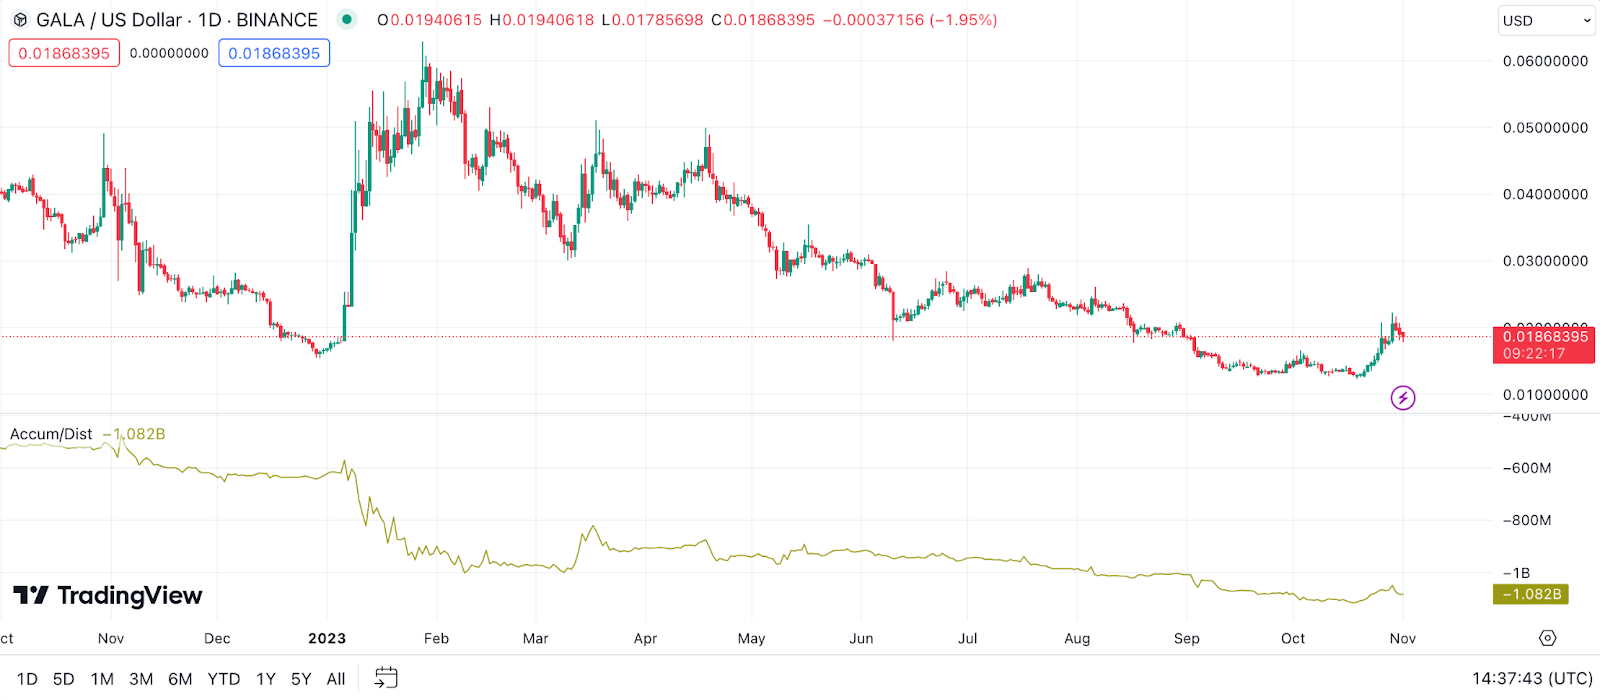
Example: If GALA’s price is advancing and the A/D Line is trending upward too, this can be viewed as a confirmation of the bullish trend, suggesting that buying pressure dominates. On the other hand, if GALA’s price is moving upward but the A/D Line is descending, this divergence may hint at underlying selling pressure and potential future price declines.
Pivot Points for Gala Price Prediction
Pivot Points are technical analysis tools used to identify potential support and resistance levels. These points are calculated using the high, low, and closing prices of an asset from the previous trading period. Apart from the pivot point itself, derived levels include potential support and resistance points. Pivot Points can offer insights into potential price direction and reversals.
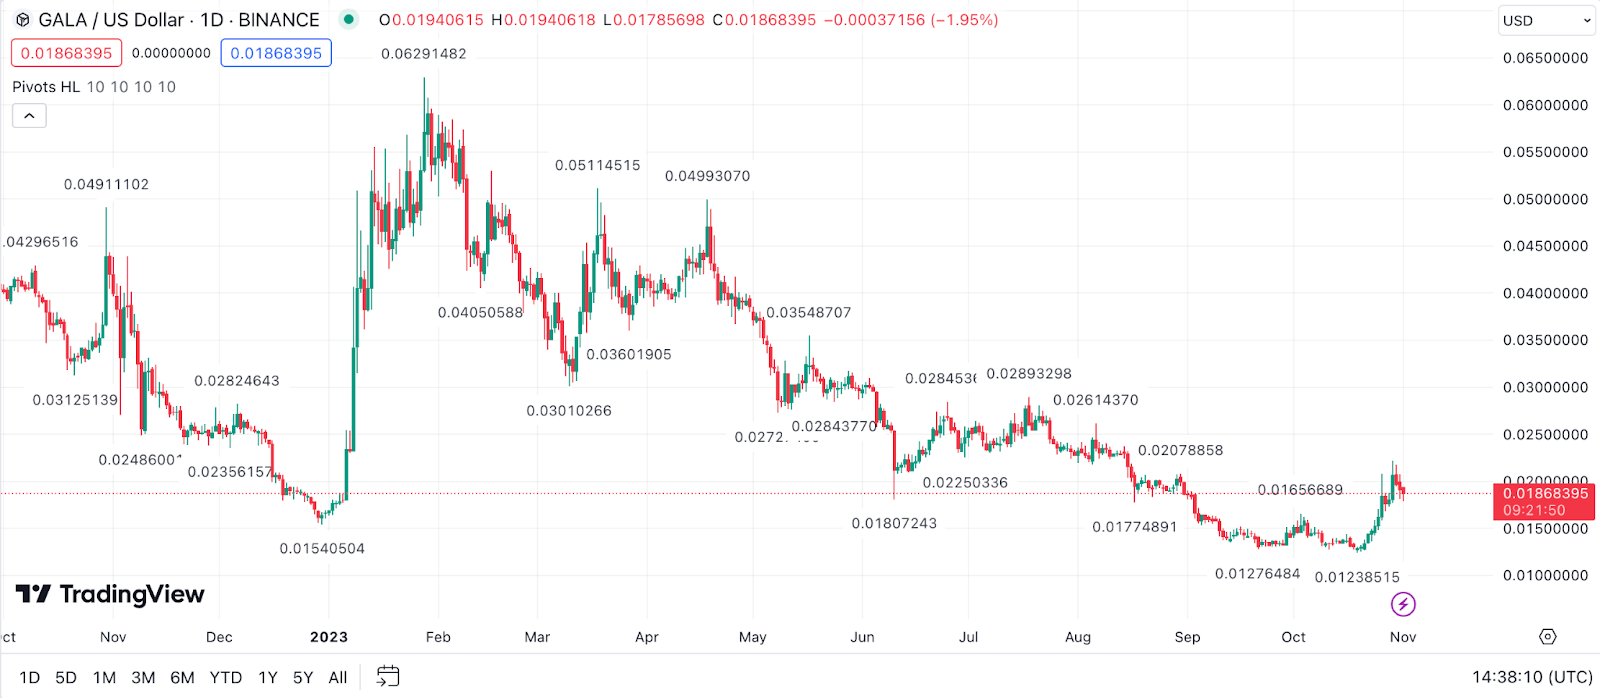
Example: Suppose the GALA price is approaching a calculated pivot point resistance level after a significant uptrend. If the price fails to breach this level multiple times, it might indicate a potential ceiling for GALA’s current rally. Traders might consider this as a signal to secure profits, anticipating a pullback. Conversely, if GALA approaches a support pivot point after a downtrend and bounces off, it could signify a potential upward reversal.
Chaikin Money Flow (CMF) for Gala Price Prediction
Chaikin Money Flow (CMF) is a volume-weighted average of accumulation and distribution over a set period. The CMF provides insight into the market’s sentiment by gauging the amount of money flowing into or out of an asset. A positive CMF suggests that the asset is being accumulated, as closing prices are frequently near the day’s high. A negative CMF indicates distribution, showing closing prices often closer to the day’s low.
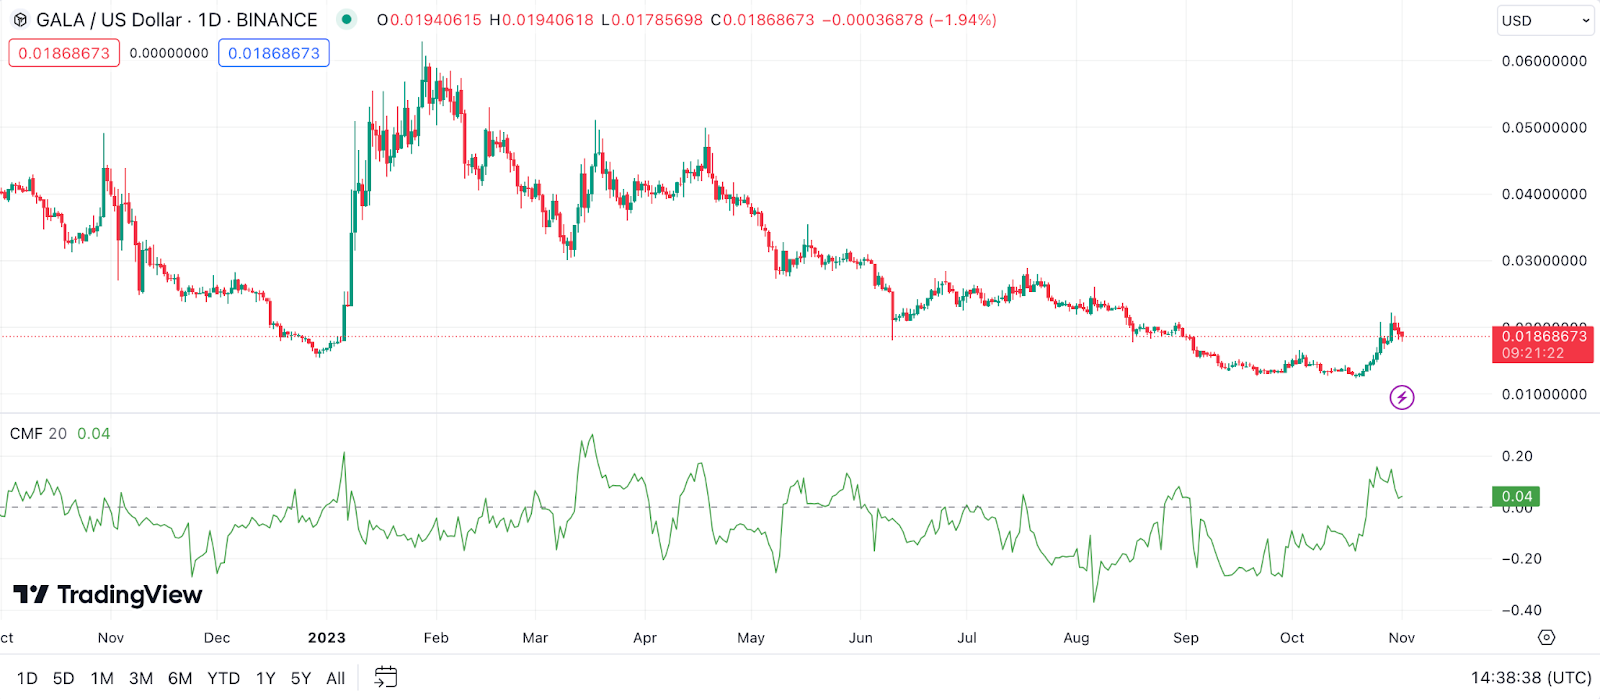
Example: If GALA’s price is on an upward trajectory and the CMF is consistently positive, it implies that the majority of trading is happening near the day’s highs, reflecting strong buying pressure. If GALA’s price is ascending, but the CMF starts shifting to negative values, it could signal decreasing buying enthusiasm and potential bearish divergence, warning of a possible trend reversal.
Aroon Indicator for Gala Price Prediction
The Aroon Indicator, comprised of the “Aroon Up” and “Aroon Down” lines, is designed to identify when trends are likely to emerge and how robust they are. This tool can effectively detect trend changes by gauging the time since the highest and lowest prices over a predetermined time frame.
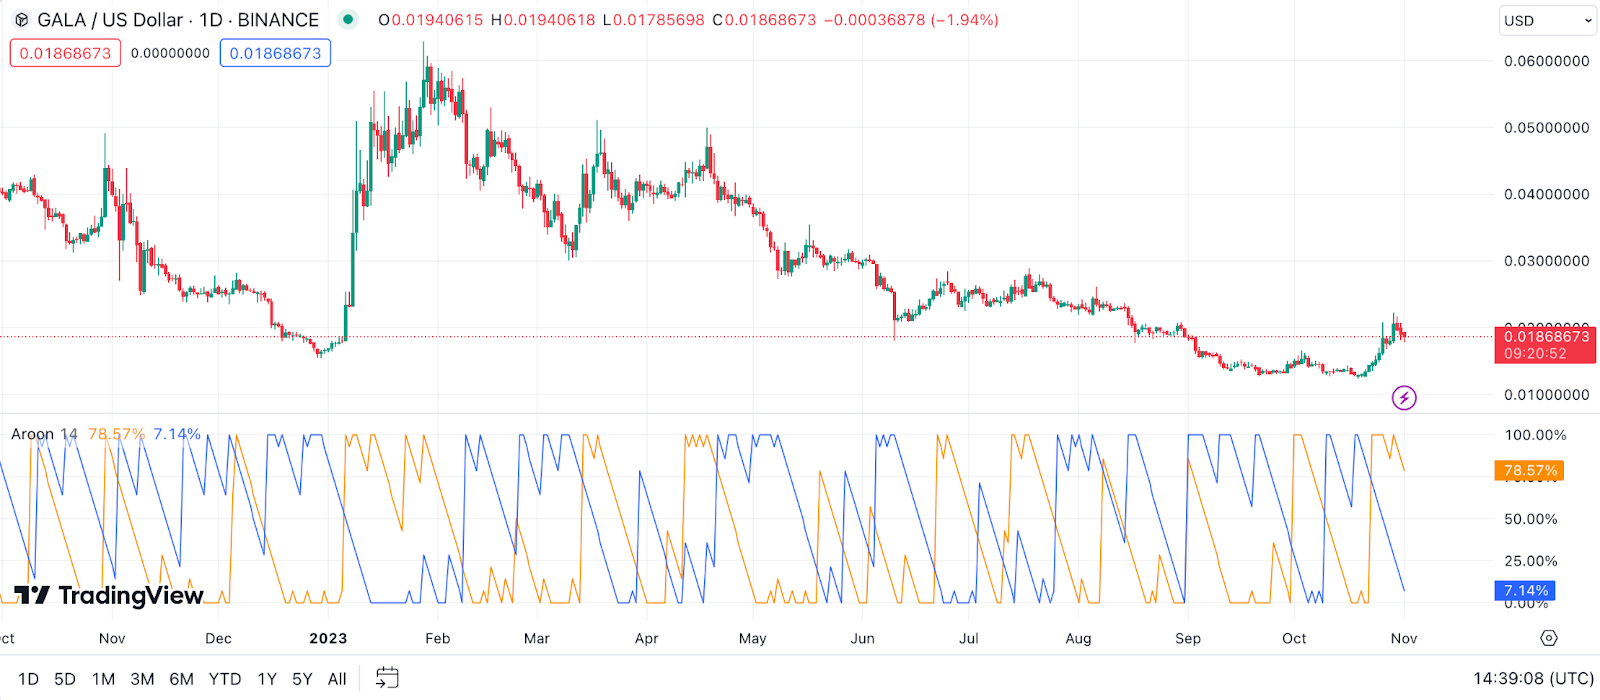
Example: In the context of GALA, if the “Aroon Up” line crosses above the “Aroon Down” line and approaches the 100 level, it signifies a potential emerging bullish trend. Conversely, if the “Aroon Down” line rises while the “Aroon Up” line descends, it could suggest a potential bearish trend. If both lines are declining, it can signal a weakening trend and potential consolidation.
Gann Fan for Gala Price Prediction
Gann Fan is a tool based on W.D. Gann’s studies of price movements. It consists of a series of diagonal lines which, when plotted on a chart, aim to display a security’s strengths and weaknesses. Each line represents a potential support or resistance level. The Gann angles represent predictable patterns in price changes and time intervals, according to Gann’s theories.
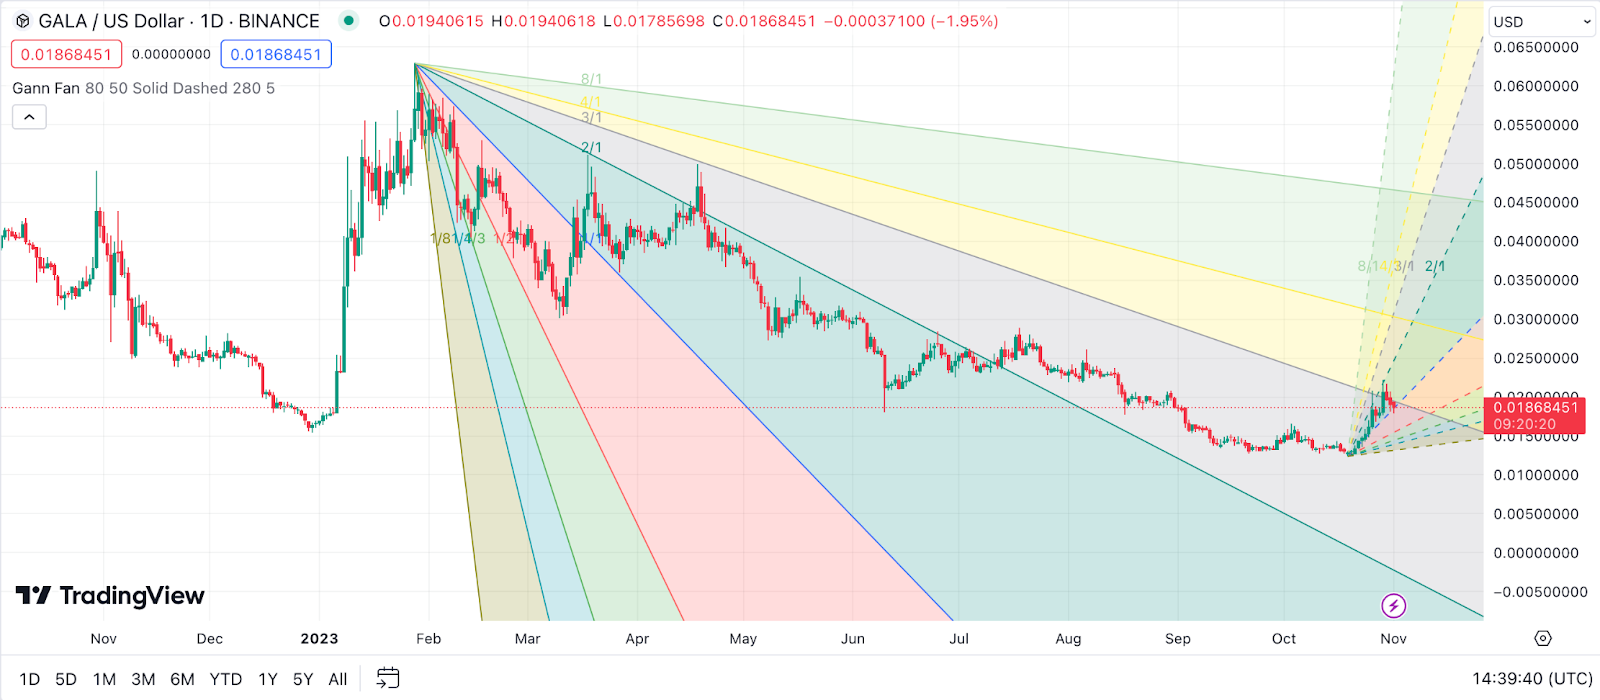
Example: If GALA’s price follows a 1×1 angle (meaning the asset moves one price unit for each time unit), it indicates a balanced market. When GALA breaks above this angle, it can signal increased bullish sentiment, and if it breaks below, it suggests increased bearish sentiment. The steeper angles can represent stronger trends.
Keltner Channel for Gala Price Prediction
Keltner Channel is a volatility-based indicator that forms envelopes around an asset’s price, using an exponential moving average and the asset’s average true range. These channels can help traders identify potential overbought and oversold conditions, price breakouts, and trend directions.
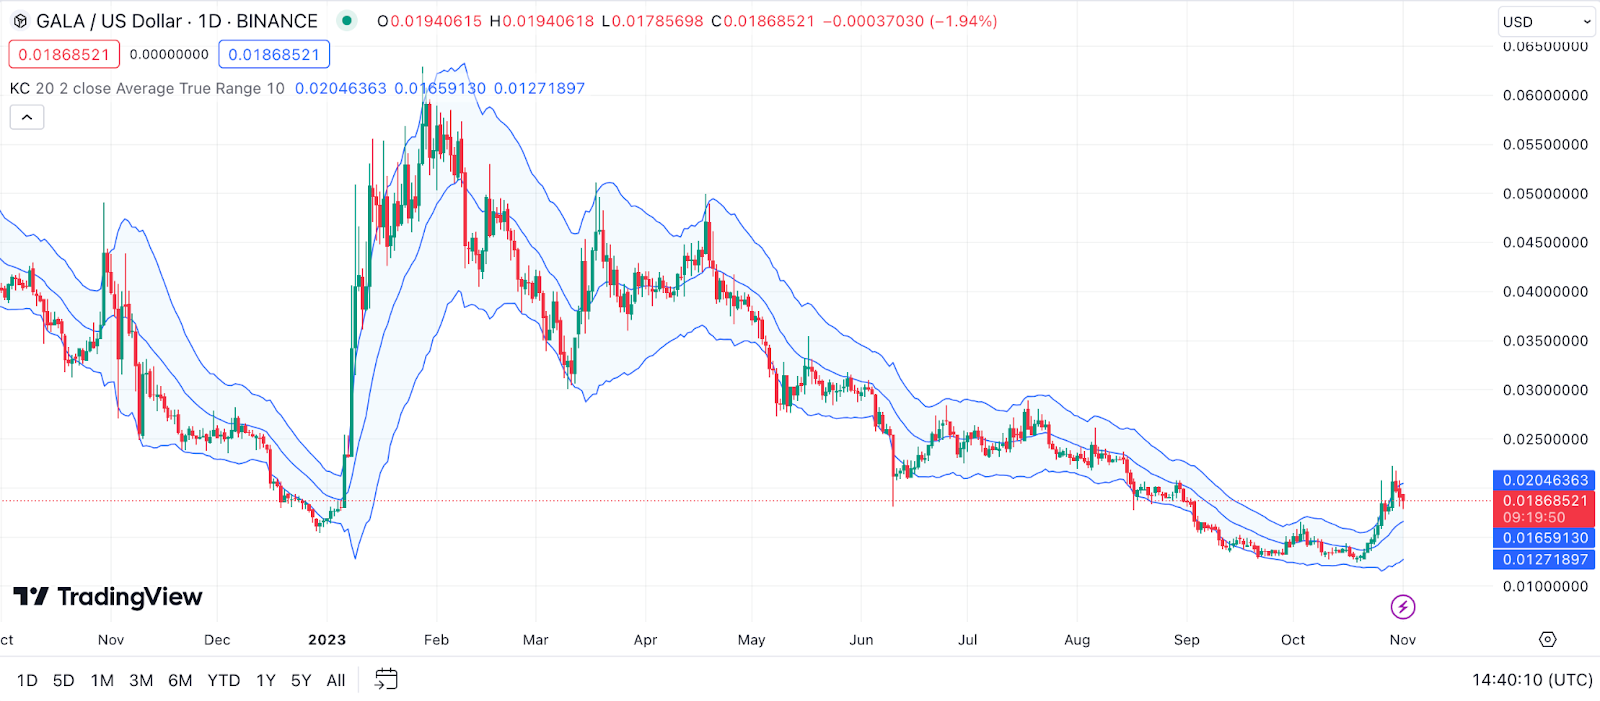
Example: If GALA’s price touches or breaks above the upper channel, it might be viewed as a sign that GALA is overbought, and there could be potential for a pullback. Conversely, when the price touches or breaches the lower channel, it suggests that GALA may be oversold and could experience a rebound. If the price remains within the channel boundaries, it typically suggests a continuation of the existing trend.
Money Flow Index (MFI) for Gala Price Prediction
The Money Flow Index (MFI) is an oscillator that measures the inflow and outflow of money into an asset over a specific period. It operates similarly to the Relative Strength Index but integrates volume to its calculations, giving a more comprehensive view of buying and selling pressure.
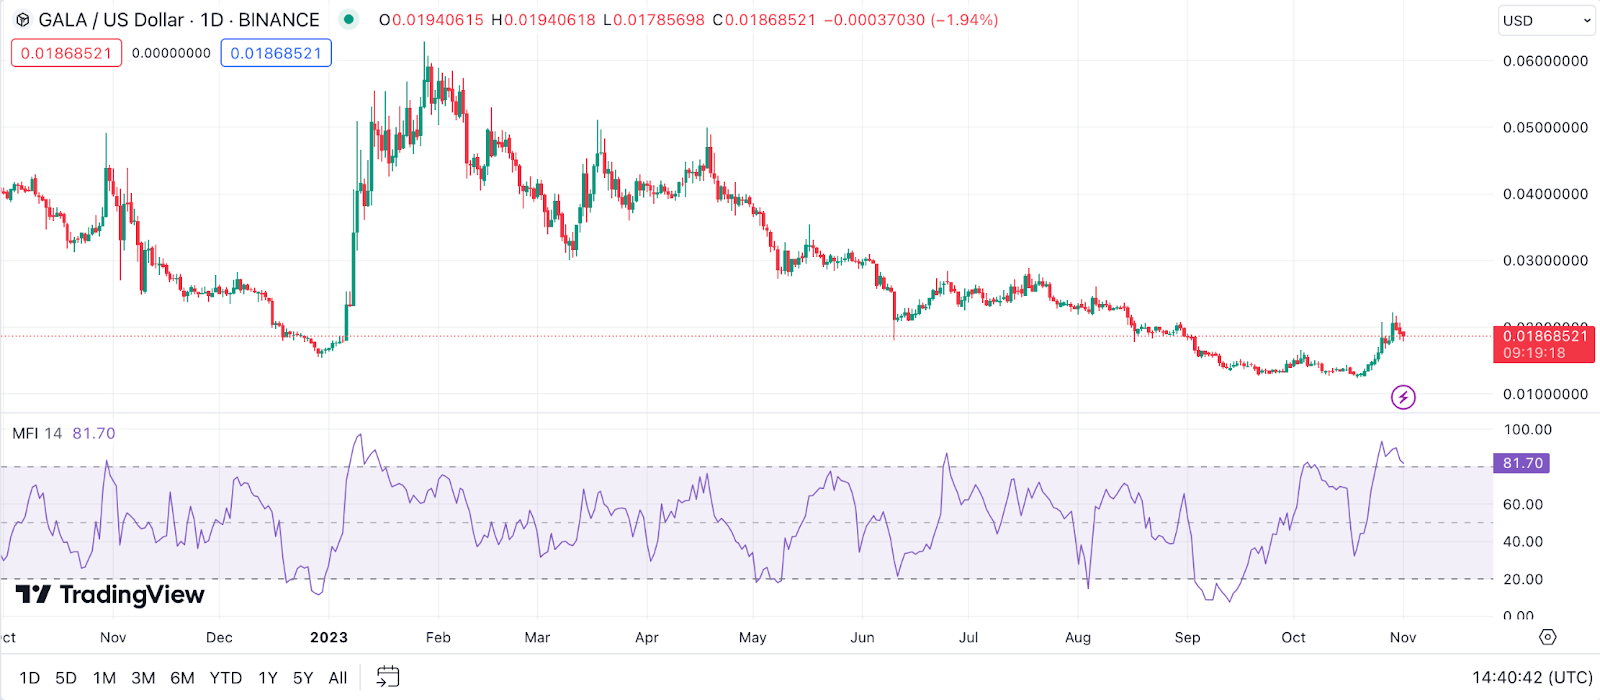
Example: If the MFI for GALA trends upwards and surpasses 80, it might indicate that GALA is overbought, implying potential selling pressure in the near future. Conversely, if the MFI drops below 20, GALA could be considered oversold, suggesting a possible buying opportunity. If there’s a divergence between the MFI and GALA’s price movement, it could be a sign of an impending price reversal.
TRIX for Gala Price Prediction
TRIX is a momentum oscillator that highlights the percentage change in a triple exponentially smoothed moving average of an asset’s closing price. The main function of TRIX is to filter out minor price fluctuations and focus on significant trends.
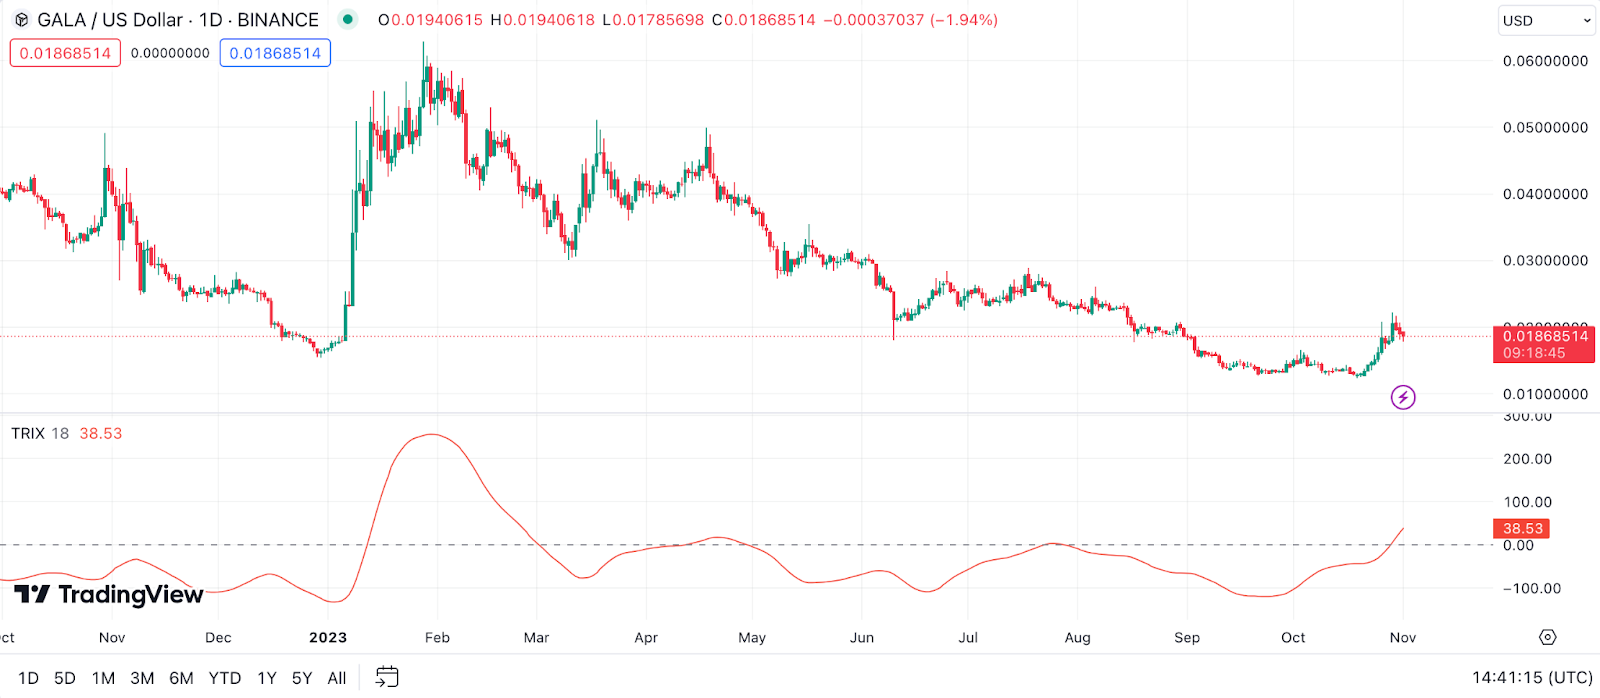
Example: When it comes to GALA, a bullish signal is identified if the TRIX line crosses above the signal line and remains there, especially if it’s done so after being in a negative zone. Conversely, a potential bearish scenario unfolds if the TRIX line descends below the signal line after being positive. Crossovers can be early indicators of potential price swings.
The Zig Zag Indicator for Gala Price Prediction
The Zig Zag indicator simplifies price graphs by eliminating smaller movements and focusing on more substantial price changes. It’s primarily used to identify price trends, support and resistance areas, and classic chart patterns like head and shoulders, double bottoms, and more.
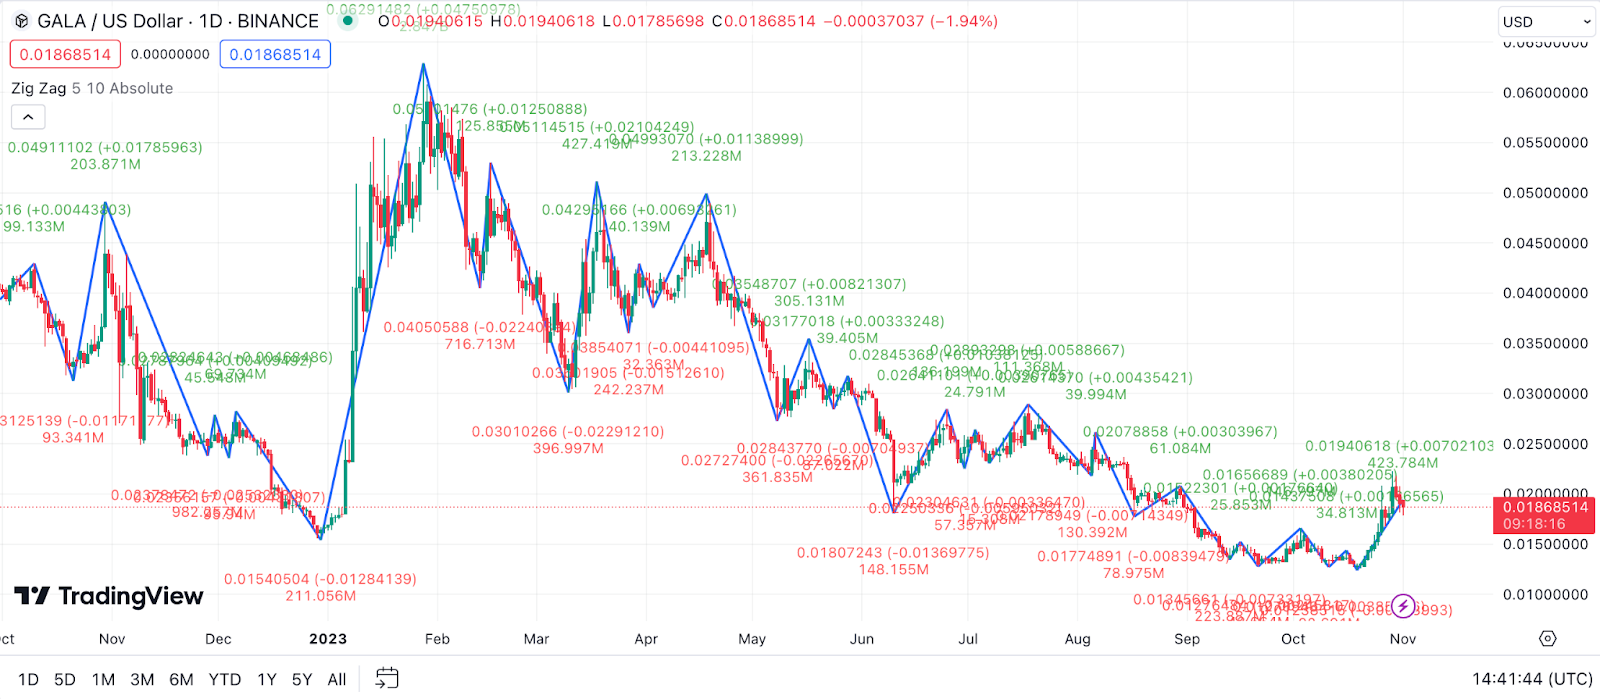
Example: When analyzing GALA with the Zig Zag indicator, if the price is on an upward trajectory and then forms a “peak” followed by a “valley” (a downward movement), it might indicate the end of the bullish trend and the start of a bearish one. Conversely, a “valley” followed by a “peak” can signify a potential bullish turnaround. It’s crucial to note that the Zig Zag indicator is best used in conjunction with other tools since it doesn’t predict future price movements but rather highlights past ones.
Detrended Price Oscillator (DPO) for Gala Price Prediction
The Detrended Price Oscillator (DPO) is a tool that aims to highlight the cyclical patterns within an asset’s price by eliminating the overarching trend. By doing this, the DPO allows traders to identify peaks and troughs in price cycles, making it easier to anticipate potential short-term price reversals.
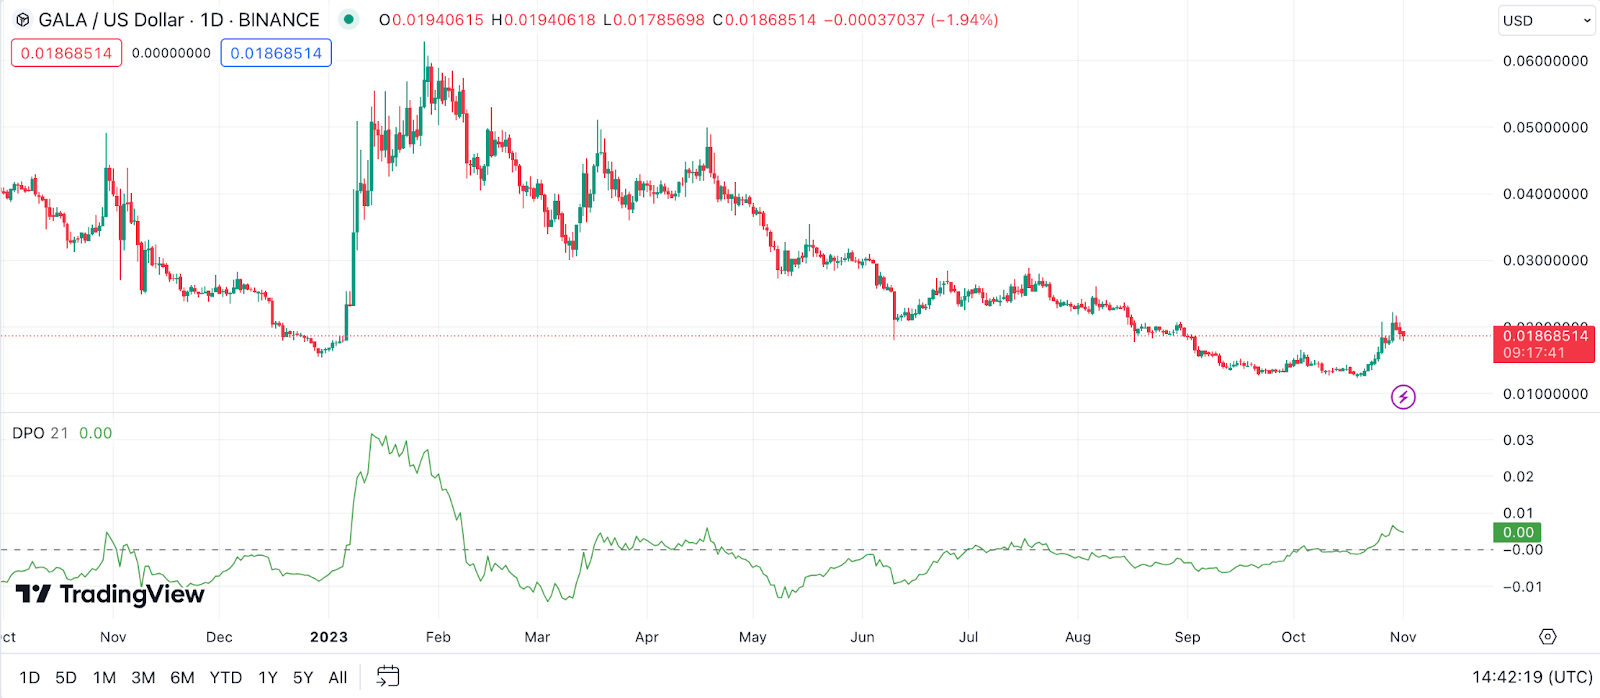
Example: Suppose the DPO for GALA shows a downward movement crossing below the zero line. This could indicate a potential bearish phase for GALA in its price cycle. Conversely, if the DPO starts rising and crosses above the zero line, it may suggest an upcoming bullish phase. Remember, the DPO focuses on short-term cyclical patterns, so it’s essential to use it alongside other indicators for a more comprehensive analysis.
Vortex Indicator (VI) for Gala Price Prediction
The Vortex Indicator (VI) is designed to identify the start of a new trend and determine its strength. It does this by comparing the higher highs and lower lows of two consecutive periods. The VI consists of two oscillating lines: VI+ and VI-.
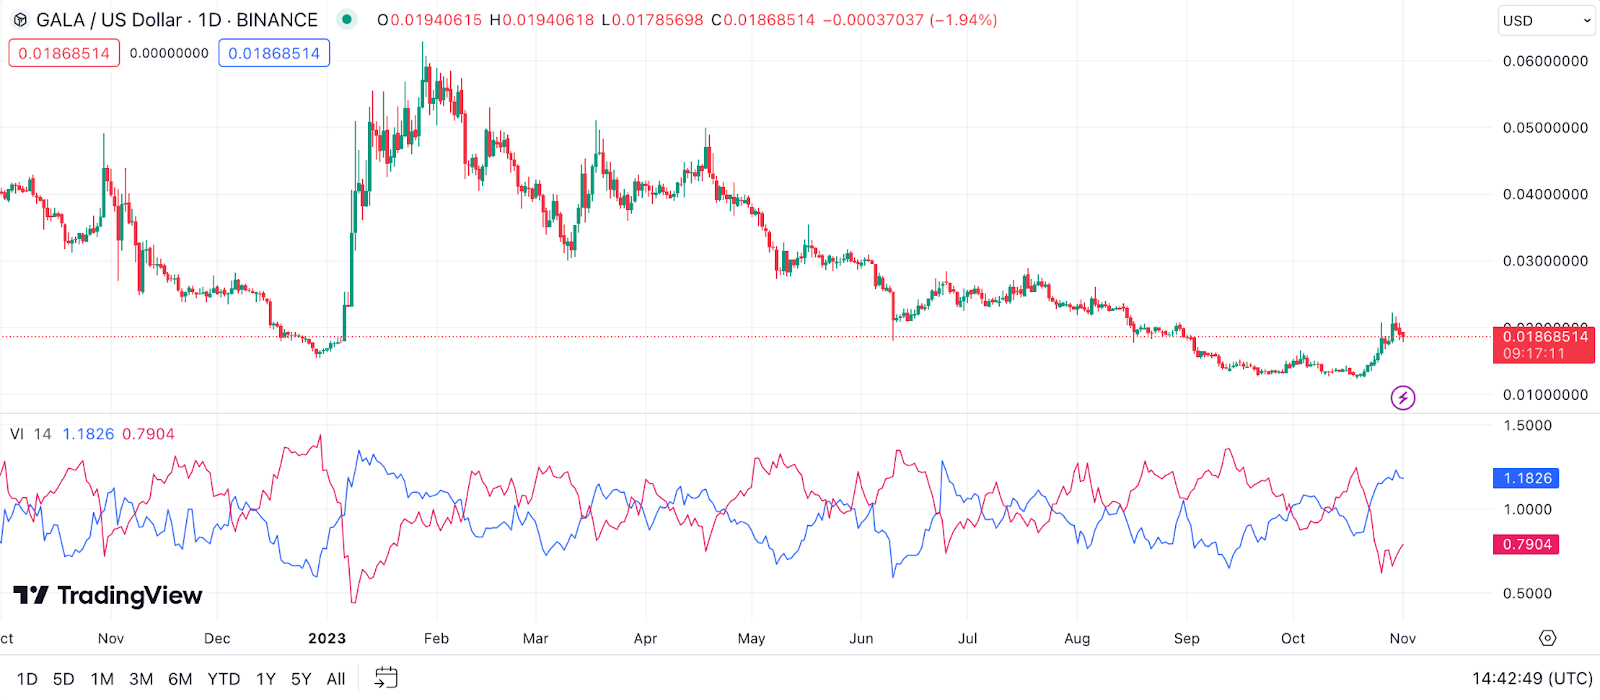
Example: In the context of GALA, if the VI+ line crosses above the VI- line, it might suggest a potential bullish trend. On the other hand, if the VI- surpasses the VI+, it could signal the onset of a bearish trend. When the two lines move further apart, it indicates increasing trend strength. Always be cautious of false signals and ensure you corroborate with other technical tools.
Elder’s Force Index (EFI) for Gala Price Prediction
Developed by Dr. Alexander Elder, the Elder’s Force Index (EFI) measures the power behind a price movement using price and volume. It can be used to identify potential trend reversals and the strength of a current trend.
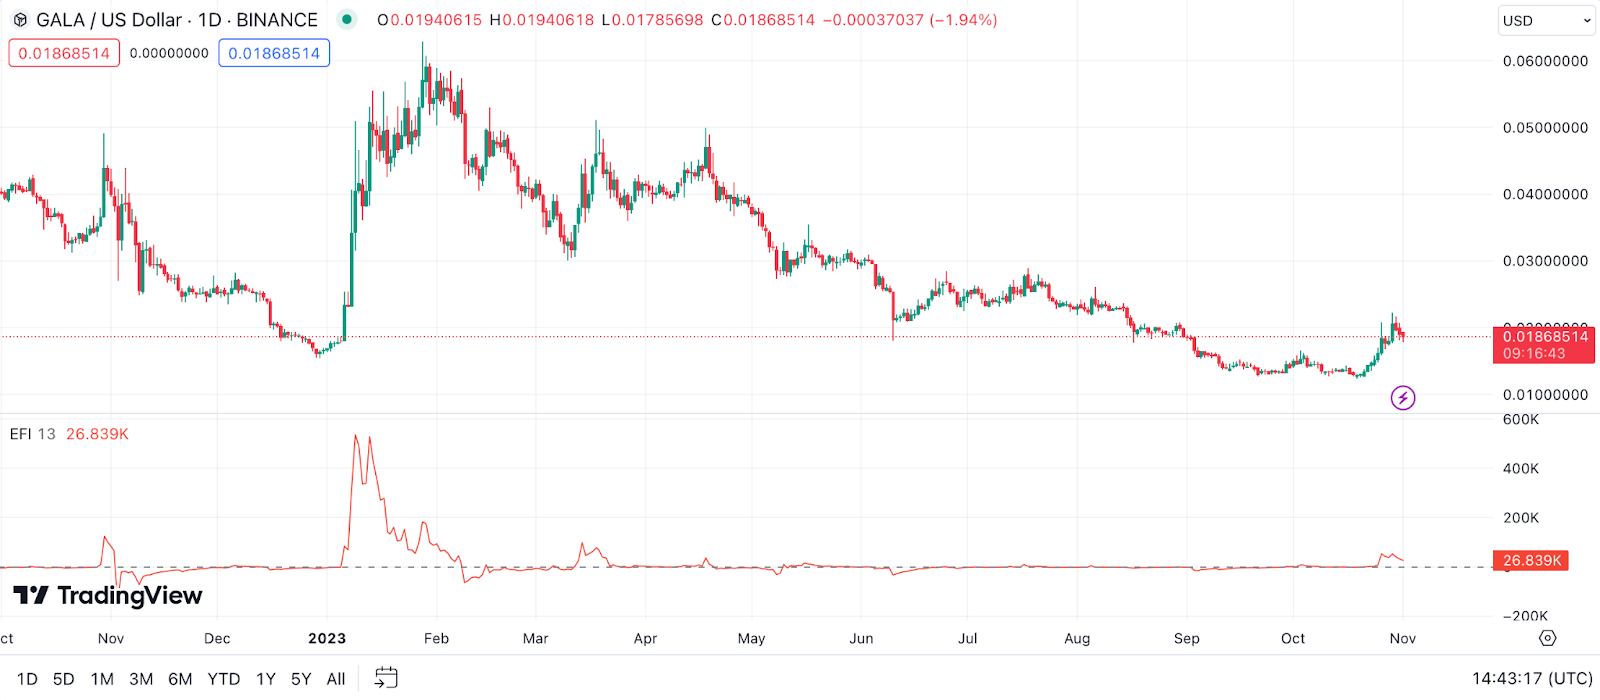
Example: Looking at GALA’s price chart, if the EFI shows a sharp rise, it indicates strong buying power, suggesting a potential bullish turn. Conversely, a sharp drop in the EFI may point to increased selling pressure and a possible bearish trend. Divergences between GALA’s price and the EFI can also serve as vital clues. For instance, if GALA’s price hits a new high but the EFI doesn’t, it could indicate weakening momentum, hinting at a potential price reversal.
Williams %R for Gala Price Prediction
The Williams %R, often termed as Williams Percent Range, is a momentum indicator that identifies overbought or oversold conditions of an asset. It oscillates between 0 to -100 and typically uses a 14-day period as its default setting. This indicator is similar to the Stochastic Oscillator but is plotted upside-down. The primary purpose of the Williams %R is to help traders identify potential reversal points in the market.
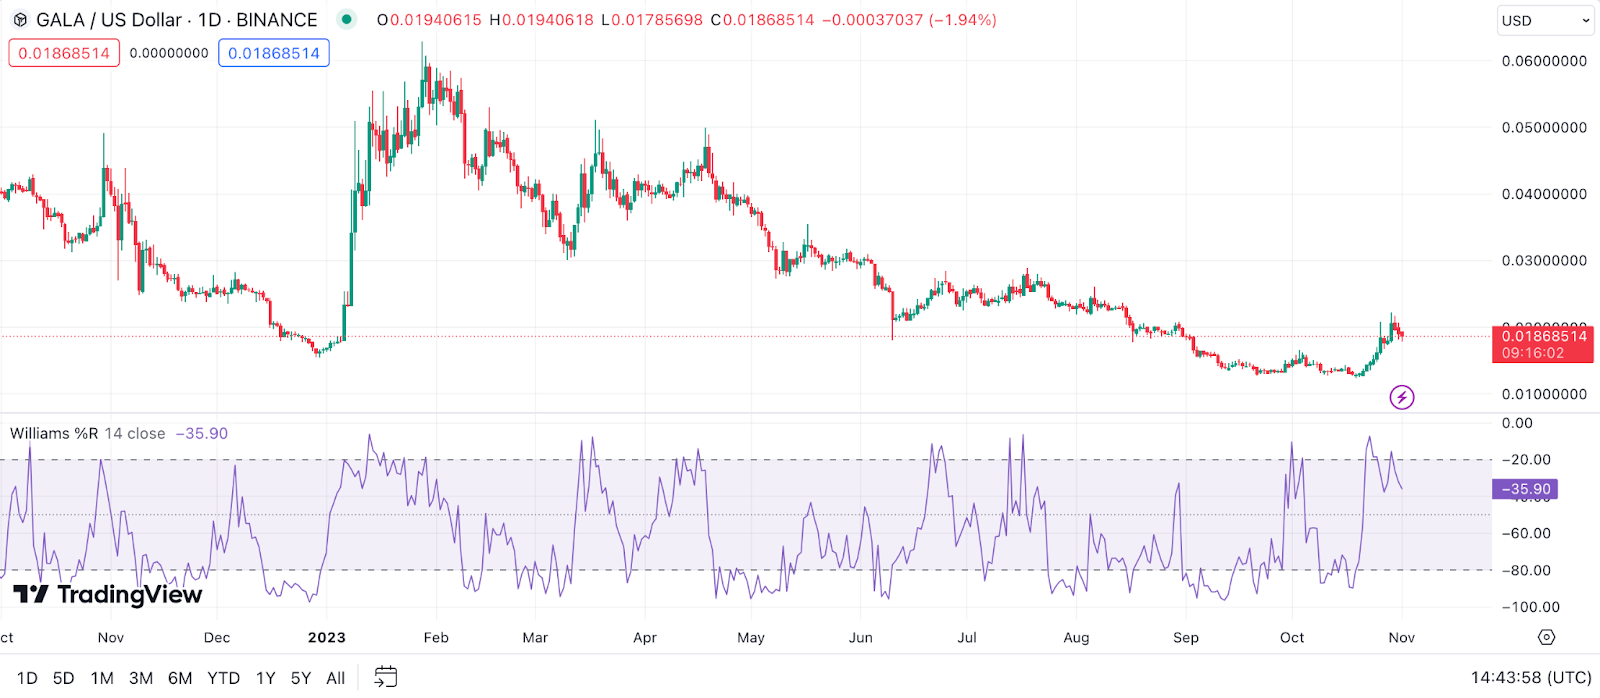
Example: Let’s take a hypothetical situation with GALA. If the Williams %R value drops to -80 or below, this might suggest that GALA is oversold and could be due for a price rebound. Conversely, if the Williams %R value rises to -20 or above, it could indicate that GALA is overbought, hinting at a potential price pullback. For instance, if after a prolonged downtrend, GALA’s Williams %R crosses back above the -80 level, this might be seen as a bullish sign, signaling a potential change in trend or a price rebound.
Combining Technical Indicators for Accurate Gala Price Prediction
In the ever-fluctuating world of cryptocurrency, predicting the future price of a digital asset like GALA is no small feat. Using individual technical indicators can offer valuable insights. However, when these indicators are combined, they create a more holistic and nuanced picture of potential price movements. Let’s delve into why combining multiple technical indicators is crucial and how to do so effectively.
The Importance of Using Multiple Technical Indicators
Relying on a single technical indicator can be likened to viewing a vast landscape through a tiny window. Sure, you’ll see a part of the picture, but there’s so much more outside that limited view. Each indicator provides a unique perspective, considering various market factors. By using several of them together, you’re essentially stitching together these fragmented views to form a comprehensive understanding of the market’s potential direction.
For instance, while one indicator might signal a buy opportunity due to perceived oversold conditions, another might suggest the opposite due to weakening momentum. By examining these indicators in tandem, you can navigate the complex maze of market signals with enhanced precision.
How to Combine Various Indicators for a Comprehensive Analysis
Combining indicators is both an art and a science. Here are some tips on how to integrate various technical indicators for a well-rounded analysis of GALA’s price:
- Diversify Your Indicators: Avoid using indicators that measure the same thing. For instance, if you’re using the RSI to gauge momentum, consider pairing it with the MACD to gain insights into potential trend reversals.
- Limit the Number: Overloading your charts with too many indicators can result in analysis paralysis. Choose a few that complement each other well.
- Understand Their Strengths and Limitations: No indicator is flawless. Knowing the strengths and weaknesses of each can help you interpret their signals more effectively.
- Look for Confirmation: Before making a decision, wait for multiple indicators to align in their signals. If the Stochastic Oscillator and RSI both indicate oversold conditions, there’s a stronger case for a potential upward movement.
- Adjust Parameters as Needed: Depending on your trading strategy (short-term vs. long-term), you might need to adjust the default settings of some indicators to better suit your needs.
- Always Stay Updated: The crypto market is dynamic. Regularly review and update your set of indicators to ensure they’re still relevant and effective.
Remember, while combining technical indicators can enhance your GALA price analysis, it’s essential to incorporate fundamental analysis and stay updated with news events that could influence the current price of GALA.
The Pillars of Gala Prediction: Fundamental Factors
Beyond the realm of technical indicators lies the vast landscape of fundamental factors. These elements deeply impact the underlying value and potential growth of any cryptocurrency, including GALA. While charts and patterns provide a snapshot of the market’s mood, fundamental factors lay the groundwork for the coin’s inherent value. Let me guide you through these pillars that are instrumental in predicting GALA’s future trajectory.
Adoption Rate
When evaluating the success of any cryptocurrency, the rate of its adoption is a pivotal metric. How widely and quickly a coin like GALA is embraced can provide insights into its long-term viability. When assessing GALA’s adoption rate, consider the following key metrics:
- Active Wallets: Monitoring the number of active wallets can provide a clearer picture of GALA’s user engagement. An increasing number suggests not just sporadic users but possibly individuals and entities who trust and utilize GALA regularly.
- Transaction Volume: A consistent increase in transaction volume is a sign of a thriving currency. For GALA, it would indicate that more people are using it, either for transfers, purchases, or other financial operations.
- Merchant Acceptance: If more online and physical stores start accepting GALA as a legitimate form of payment, it’ll be a testament to its growing reputation and trustworthiness in the commercial domain.
- Partnerships and Collaborations: These are the gateways to new user bases. Strategic alliances, especially with influential names in the crypto or tech world, can exponentially boost GALA’s visibility and credibility. Keep an eye out for announcements on this front.
- Community Growth: A cryptocurrency isn’t just code; it’s also the community that supports and believes in it. A thriving, active community can be GALA’s biggest advocate, driving new users and fostering a sense of trust. Online forums, social media groups, and even offline meetups are good indicators of a coin’s community strength.
- DApp Integration: The integration of decentralized applications (DApps) on the GALA network can also reflect its growth. The more DApps associated with GALA, the more versatile its use cases, potentially drawing a broader audience.
- Mainstream Media Coverage: When major news outlets begin covering a cryptocurrency, it often means it has gained enough traction to catch the mainstream eye. Positive coverage can lead to significant adoption spurts.
Understanding the dynamics of adoption is not just about numbers but about grasping the narrative around a cryptocurrency. It’s about observing its transition from niche corners of the internet to possibly being discussed at dinner tables. As you delve deeper into GALA, always remember, adoption is about stories as much as it is about statistics.
Regulatory Developments
As the cryptocurrency space matures, so does the regulatory landscape surrounding it. Understanding how regulations evolve and how they impact specific tokens like GALA is paramount. While crypto, in general, promotes decentralization and autonomy, it can’t entirely escape the grasp of regulatory bodies. For GALA, as with other tokens, regulatory decisions can be a double-edged sword, often dictating its legitimacy and acceptance on a global scale.
Here’s a more comprehensive look at how regulatory changes can influence the current GALA price and perception:
- Country-Specific Bans or Acceptance: It’s not unheard of for countries to either fully embrace or outright ban certain cryptocurrencies. If a significant market like the U.S. or the European Union were to make definitive regulatory decisions about GALA, it could drastically affect its global standing.
- Tax Implications: How governments decide to tax cryptocurrency profits can heavily influence investor behavior. If the tax structure is favorable, more investors might flock to GALA. Conversely, a punitive tax regime could deter potential adopters.
- Security Classifications: Should GALA be classified as a security? Such classifications can impose a myriad of compliance requirements, and not meeting them can lead to legal battles or fines, potentially affecting GALA’s price.
- Anti-Money Laundering (AML) & Know Your Customer (KYC) Protocols: The imposition or relaxation of these protocols can impact GALA’s ease of use. Stricter AML and KYC norms might ensure more transparency but could also deter users looking for quick, anonymous transactions.
- Licensing and Exchange Regulations: The ease with which GALA can be listed, traded, or delisted from popular exchanges often rests on regulatory directives. A friendly regulatory stance can lead to wider accessibility for GALA, while a stricter one can limit its reach.
- Integration in Traditional Banking Systems: Should regulators pave the way for GALA’s integration into traditional banks or financial systems, it could legitimize the token further, increasing trust and adoption rates.
- ICO & Crowdfunding Norms: Since many tokens, including ones like GALA, often raise funds through Initial Coin Offerings (ICOs) or other crowdfunding methods, regulations surrounding these mechanisms can influence the token’s launch, distribution, and overall success.
When navigating the labyrinth of cryptocurrency investments, always remember that the regulatory environment isn’t static. It shifts, evolves, and sometimes even takes a U-turn. As GALA continues its journey, it will be crucial for investors to keep a finger on the pulse of global regulations, understanding that today’s regulatory friendliness could be tomorrow’s regulatory challenge, and vice versa.
Utility
GALA, like many other cryptocurrencies, isn’t just a speculative asset. It’s a token that derives its value from tangible utility within its ecosystem. The extent to which a cryptocurrency offers practical, real-world benefits often dictates its long-term viability and growth potential. Without genuine utility, even the most hyped tokens can fizzle out.
But when a token like GALA can be integrated into daily processes or solve existing problems, its future looks much brighter. Let’s dive into the various real-world utilities of GALA:
- Gaming Integration: GALA is central to the Gala Games ecosystem, a platform that is ambitiously reinventing the way we perceive online gaming. By allowing players to truly own in-game assets and ensure their interoperability across different games, GALA is carving a niche for itself in the booming gaming industry.
- Decentralized Governance: One of GALA’s standout features is its nod to decentralization, giving its community a say in the platform’s direction. This active involvement not only ensures that the platform stays relevant and user-centric but also fosters a strong sense of community and loyalty among its users.
- Tokenized Asset Ownership: In the Gala Games universe, GALA can be used to purchase in-game assets, which are tokenized and can be traded or sold in various marketplaces. This shifts the power dynamics in online gaming, enabling gamers to reap tangible benefits from their skills and time.
- Staking Opportunities: GALA offers staking opportunities, allowing its holders to earn rewards by supporting the network. This not only incentivizes holding onto the token but also helps secure the network and validate transactions.
- Platform Development and Expansion: The GALA token plays a vital role in the ongoing development and expansion of the Gala Games platform. Through the sale of assets and other fundraising methods, the token ensures the platform continues to innovate and offer fresh content to its users.
- Partnership Potentials: As the gaming industry recognizes the potential of blockchain integration, GALA can serve as a bridge, fostering partnerships and collaborations with other platforms, developers, and gaming communities. These alliances can open up new avenues of utility for the token.
- Scalability and Integration: With a focus on scalability, the GALA token is poised to handle a surge in transactions as the platform grows. Moreover, its design facilitates easy integration into other platforms and services, expanding its utility beyond just the Gala Games ecosystem.
In summary, a token’s real value isn’t just in its price or market cap, but in the problems it solves and the solutions it offers. GALA is more than just a token; it’s a vision of a more equitable gaming ecosystem where players are stakeholders, not just participants. And it’s this utility that could very well be the wind beneath its wings in the long run.
Market Sentiment: How GALA News Prediction Works
Market sentiment, often known as the “mood” of the market, is a crucial aspect to consider when making any crypto investment decisions, including in the realm of cryptocurrencies like GALA. Sentiment gives us a glimpse into the collective emotions and attitudes of market participants, which can drive price fluctuations.
When it comes to GALA or any other cryptocurrency, the sentiment is particularly volatile, given the nascent and rapidly evolving nature of the crypto space. Let’s delve deeper into the intricacies of gauging market sentiment for GALA:
- Crypto News Outlets: Major announcements or news related to GALA can heavily influence market sentiment. Positive news, such as new game releases or partnerships, can lead to bullish sentiment, while regulatory clampdowns or technical issues might drive bearish sentiment. Always ensure you’re plugged into trustworthy crypto news outlets that provide timely and accurate updates.
- Social Media Analysis: Platforms like Twitter, Reddit, and crypto-specific forums are rife with discussions, speculations, and debates about GALA’s future. Tools that analyze the frequency and tone of these discussions can provide insights into the prevailing market sentiment. A sudden surge in positive mentions, for instance, could indicate growing interest or a potential price hike.
- Influencer Opinions: The crypto world isn’t devoid of influencers whose opinions can sway market sentiment. While it’s essential to conduct your own research, keeping tabs on what notable figures in the crypto space are saying about GALA can give you a broader perspective.
- Volume and Price Analysis: A sudden spike in trading volume, accompanied by price changes, can be indicative of shifting market sentiment. For example, increased buying volumes might suggest that traders are bullish about GALA’s prospects.
- Sentiment Analysis Tools: There are specific tools designed to gauge the sentiment of the crypto market by analyzing vast amounts of web content, from news articles to blog posts. These tools can be handy in offering a more structured sentiment analysis specific to GALA.
- External Events: Global events, be it economic downturns, geopolitical tensions, or technological breakthroughs, can influence the broader market sentiment, which trickles down to individual assets like GALA. Staying informed about significant global happenings can help you anticipate sentiment-driven price movements.
- Historical Data Analysis: Past market reactions to similar news or events can sometimes provide insights into potential future reactions. By studying how GALA’s price reacted to past news or developments, you might discern patterns or trends in sentiment-driven price movements.
In essence, understanding market sentiment is akin to having your finger on the pulse of the collective psyche of GALA investors. While sentiment can be a powerful indicator, it’s also fleeting and can change rapidly. Hence, it’s vital to combine sentiment analysis with other forms of analysis to make well-informed decisions.
The Bottom Line: Making Your Own GALA Price Predictions
In wrapping up our deep dive into GALA price prediction, we’ve journeyed through the myriad facets that shape its potential trajectory. We’ve weighed expert opinions, dissected the nuances of technical indicators, and probed the underpinnings of fundamental analysis. Remember, the crypto realm is ever-changing, and while these tools offer invaluable insights, there’s no definitive crystal ball.
It’s essential to approach GALA, or any high-risk investment, with an informed and open mind, continuously seeking knowledge and staying adaptable. Here’s to charting your path in the dynamic world of cryptocurrency, and may your GALA journey be both enlightening and prosperous!
FAQ
When Will GALA Go Up?
Oh, if only I had a crystal ball! Like any other cryptocurrency, GALA’s movement is influenced by myriad factors – from market sentiment to major global events. But if history and current trends are any guide, there’ll certainly be peaks and troughs. Keep a close eye on the market, follow news, and maybe consult some charts before making any moves.
Should I Buy GALA?
I’m not a financial advisor, but I’d always suggest doing your own extensive research and maybe even seeking expert advice before diving in. Cryptocurrencies, including GALA, can be volatile. What’s vital is understanding your risk tolerance, investment horizon, and ensuring GALA aligns with your portfolio goals.
How High Can GALA Go?
The sky’s the limit, or is it? Crypto markets have shown us astonishing highs and some heart-stopping lows. Given GALA’s potential and the increasing adoption of its platform, it could reach impressive heights. However, always remember the golden rule: past performance isn’t a guarantee of future results.
Will GALA Crash Again in 2024?
Ah, the million-dollar question! Predicting exact market movements is a tricky endeavor. While some analysts have their predictions based on current data and patterns, unforeseen events or shifts in market sentiment can change the game overnight. Stay informed, stay adaptable, and never put all your eggs in one basket.