Hello dear readers! I’m genuinely thrilled you’ve stopped by to dive into this exciting piece on Wrapped Bitcoin price prediction. When it comes to cryptocurrency and predicting its ebb and flow, the task is never straightforward. Today, we’re about to embark on an enlightening journey into the annals of Wrapped Bitcoin’s past, understanding its genesis and mission. Moreover, we’ll demystify the tools and techniques traders often employ to gauge where WBTC might be headed and weigh in on expert insights.
Now, you might be wondering, “Why the fuss about predicting WBTC coin’s value?” Well, just like staying ahead of stock market shifts or real estate trends, anticipating the movement of a cryptocurrency can be a game-changer. It equips investors with information, aiding them in making informed decisions, thereby potentially maximizing returns or minimizing losses.
Intrigued already? I promise the depths we’ll cover are even more enthralling. So, dear crypto-enthusiast, without further ado, let’s plunge right in. Trust me, you won’t want to miss what’s coming next!
Wrapped Bitcoin (WBTC) Overview
| WBTC Price | $108,703.62 |
| WBTC Price Change 24h | 2.51% |
| WBTC Price Change 7d | 0.85% |
| WBTC Current Market Cap | $14,024,749,525.22 |
| WBTC Circulating Supply | 129,018.24 |
| WBTC Trading Volume | $280,088,847.39 |
| WBTC All-Time High (ATH) | $67,011.00 |
| WBTC All-Time Low (ATL) | $3,330.12 |
A Brief History: Wrapped Bitcoin and its Purpose
Ah, Wrapped Bitcoin (WBTC). If you’re into the crypto world, you’ve undoubtedly crossed paths with this token, haven’t you? Let me take you on a quick trip down memory lane. Wrapped Bitcoin was born out of the need to bridge Bitcoin and Ethereum, two of the giants of the crypto universe. Essentially, WBTC acts as a bridge, making Bitcoin compatible with Ethereum’s ERC-20 standard. This interoperability ensures that Bitcoin can be utilized in Ethereum’s decentralized apps (dApps) and smart contracts.
In simple words, it’s like making sure that someone driving a car on the right side of the road can easily switch to driving on the left, without causing any chaos. The underlying idea is to foster greater liquidity within the Ethereum ecosystem by leveraging Bitcoin’s vast market cap. It’s like giving our dear Bitcoin a fancy, tailor-made suit to attend Ethereum’s elite parties. Brilliant, right?
Now, as with most things crypto, the journey of Wrapped Bitcoin’s value has been anything but boring. Its value has danced, dipped, soared, and swirled in response to various market forces.
Notable Price Changes of WBTC Coin:
- January 2019: Wrapped Bitcoin was launched, and its initial price was closely pegged to Bitcoin, trading at approximately $3,500.
- December 2020: WBTC, in line with Bitcoin’s rally, surged to cryptocurrency prices near $30,000.
- April 2021: Mirroring BTC’s all-time high during this period, WBTC also reached the highest price of approximately $64,000.
- June 2021: WBTC, along with the wider crypto market, experienced a significant dip, bringing its price down to the $30,000-$40,000 range.
- End of 2021: Wrapped Bitcoin’s price hovered between $40,000 to $60,000, reflecting Bitcoin’s price movements.
Wrapped Bitcoin – WBTC Price Prediction For Today, Tomorrow, This Week, Next Week, and Next Month (30 Days)
| Date | Price | Change |
|---|---|---|
| July 04, 2025 | 108,388.38 | -0.29% |
| July 05, 2025 | 107,618.82 | -0.71% |
| July 06, 2025 | 107,565.01 | -0.05% |
| July 07, 2025 | 107,091.73 | -0.44% |
| July 08, 2025 | 106,952.51 | -0.13% |
| July 09, 2025 | 106,022.02 | -0.87% |
| July 10, 2025 | 106,149.25 | 0.12% |
| July 11, 2025 | 106,807.37 | 0.62% |
| July 12, 2025 | 106,369.46 | -0.41% |
| July 13, 2025 | 106,358.83 | -0.01% |
| July 14, 2025 | 106,124.84 | -0.22% |
| July 15, 2025 | 107,175.47 | 0.99% |
| July 16, 2025 | 108,118.62 | 0.88% |
| July 17, 2025 | 108,875.45 | 0.70% |
| July 18, 2025 | 109,855.32 | 0.90% |
| July 19, 2025 | 109,602.66 | -0.23% |
| July 20, 2025 | 109,558.82 | -0.04% |
| July 21, 2025 | 108,989.11 | -0.52% |
| July 22, 2025 | 109,861.02 | 0.80% |
| July 23, 2025 | 109,806.09 | -0.05% |
| July 24, 2025 | 109,355.89 | -0.41% |
| July 25, 2025 | 109,279.34 | -0.07% |
| July 26, 2025 | 110,284.71 | 0.92% |
| July 27, 2025 | 109,975.91 | -0.28% |
| July 28, 2025 | 109,689.97 | -0.26% |
| July 29, 2025 | 109,207.34 | -0.44% |
| July 30, 2025 | 109,185.50 | -0.02% |
| July 31, 2025 | 108,803.35 | -0.35% |
| August 01, 2025 | 109,826.10 | 0.94% |
| August 02, 2025 | 109,979.86 | 0.14% |
Wrapped Bitcoin Price Prediction 2024
After analyzing Wrapped Bitcoin future price data for 2024, we found that the projected minimum price is $97,833.26, while the average and maximum prices are $114,138.80 and $130,444.34, respectively.
Our assessment of future returns based on this data suggests that the Wrapped Bitcoin outlook for 2024 is relatively stable, with moderate growth expected.
The narrow price range implies that the market may not anticipate significant fluctuations in value, but there is still potential for substantial returns for those willing to take on high risks associated with investing in Wrapped Bitcoin.
Nonetheless, cryptocurrency investors must be cautious and carry out their own research before making any investment decisions in this space due to the historical volatility of cryptocurrencies and the continuously evolving market landscape.
| Month | Minimum Price | Average Price | Maximum Price |
|---|---|---|---|
| February 2024 | 45,276.53 | 47,016.12 | 48,943.78 |
| March 2024 | 46,498.99 | 48,285.56 | 50,265.26 |
| April 2024 | 47,754.46 | 49,589.27 | 51,622.43 |
| May 2024 | 49,043.83 | 50,928.18 | 53,016.23 |
| June 2024 | 50,368.02 | 52,303.24 | 54,447.67 |
| July 2024 | 51,727.95 | 53,715.43 | 55,917.76 |
| August 2024 | 53,124.61 | 55,165.74 | 57,427.54 |
| September 2024 | 54,558.97 | 56,655.22 | 58,978.08 |
| October 2024 | 56,032.07 | 58,184.91 | 60,570.49 |
| November 2024 | 57,544.93 | 59,755.90 | 62,205.89 |
| December 2024 | 59,098.65 | 61,369.31 | 63,885.45 |
| January 2025 | 60,694.31 | 63,026.28 | 65,610.36 |
January 2024: Wrapped Bitcoin Price Forecast
As we enter 2024, Bitcoin opens the year with a potential minimum price of $43,033.18. Our team’s analysis suggests an average trading range around $45,251.73, with the possibility of peaks reaching as high as $48,725.16. This upward trend indicates a robust start for Bitcoin, reflecting increased investor confidence and market stability.
WBTC Price Forecast for February 2024
February’s outlook for WBTC points towards a bullish trend. The minimal price is expected to hover around $45,276.53, with an average price that could reach $47,016.12. Seasoned traders might anticipate the maximum price to touch $48,943.78, suggesting an opportune moment for investors to strategize their positions.
March 2024: Wrapped Bitcoin Price Forecast
March could be a pivotal month for WBTC, as market forecasts predict a minimal price of $46,498.99. The average price might climb to $48,285.56, offering a steady mid-point for transactions. The maximum price could escalate to $50,265.26, potentially marking the month as a significant time for both buyers and sellers.
WBTC Price Forecast for April 2024
In April, the spring of crypto could see WBTC prices blossoming. With a minimal price projection at $47,754.46 and an average price aiming for $49,589.27, investors should keep a close watch. The maximum price could reach a robust $51,622.43, possibly triggering a wave of strategic trading.
May 2024: Wrapped Bitcoin Price Forecast
May’s forecast for WBTC seems to mirror the natural growth of the season. A minimal price of $49,043.83 sets the stage for a potentially lucrative month, with an average price at $50,928.18. Crypto enthusiasts might be thrilled to see a maximum price prediction of $53,016.23.
WBTC Price Forecast for June 2024
June stands as a beacon of optimism with WBTC’s minimal price predicted at $50,368.02. The average price is likely to ascend to $52,303.24, offering a promising outlook for ongoing investment. Moreover, the maximum price could peak at $54,447.67, hinting at a summer surge.
July 2024: Wrapped Bitcoin Price Forecast
As we hit the mid-year mark, WBTC’s trajectory seems to uphold its ascending pattern. July’s minimal price could be around $51,727.95, while the average price might sail to $53,715.43. The maximum price could reach up to $55,917.76, possibly presenting a midsummer’s dream scenario for crypto traders.
WBTC Price Forecast for August 2024
August forecasts for WBTC show no signs of the summer slowing down. The minimal price could stand at $53,124.61, with an average price potentially at $55,165.74. The maximum price could soar to $57,427.54, suggesting that the warmth of the summer months might extend to the crypto market.
September 2024: Wrapped Bitcoin Price Forecast
September could bring a gentle wind of change with a minimal price of $54,558.97 for WBTC. The average price may settle at $56,655.22, reflecting steady growth. A maximum price of $58,978.08 could imply that autumn might harvest fruitful gains for astute investors.
WBTC Price Forecast for October 2024
The crisp air of October brings a minimal price forecast of $56,032.07 for WBTC. An average price of $58,184.91 suggests a continued uptrend, while a maximum price of $60,570.49 could indicate the possibility of reaching new heights before the year’s end.
November 2024: Wrapped Bitcoin Price Forecast
As the year begins to wind down, November’s WBTC market looks promising. Analysts project a minimal price of $57,544.93, with an average price that might ascend to $59,755.90. The maximum price could potentially reach $62,205.89, offering a prelude to a possibly buoyant end-of-year market.
WBTC Price Forecast for December 2024
December’s festive spirit may well extend to the WBTC markets, with a minimal price anticipated at $59,098.65. The average price could climb to a celebratory $61,369.31, while the maximum price might cap off the year at a jubilant $63,885.45, potentially bringing good tidings to investors.
Wrapped Bitcoin Price Prediction 2025
Crypto analysts, after deep dives into the market trends, predict a steady ascent for WBTC in 2025. The year is anticipated to commence with a minimal price of $60,991.19. Mid-year analyses project an average price hovering near $72,359.08, and, if favorable winds persist, the maximum price might touch $86,058.93.
| Month | Minimum Price | Average Price | Maximum Price |
|---|---|---|---|
| February 2025 | 60,991.19 | 63,334.57 | 65,931.28 |
| March 2025 | 62,637.95 | 65,044.60 | 67,711.43 |
| April 2025 | 64,329.17 | 66,800.80 | 69,539.64 |
| May 2025 | 66,066.06 | 68,604.43 | 71,417.21 |
| June 2025 | 67,849.85 | 70,456.74 | 73,345.47 |
| July 2025 | 69,681.79 | 72,359.08 | 75,325.80 |
| August 2025 | 71,563.20 | 74,312.77 | 77,359.60 |
| September 2025 | 73,495.41 | 76,319.22 | 79,448.30 |
| October 2025 | 75,479.78 | 78,379.84 | 81,593.41 |
| November 2025 | 77,517.74 | 80,496.09 | 83,796.43 |
| December 2025 | 79,610.71 | 82,669.49 | 86,058.93 |
| January 2026 | 81,760.20 | 84,901.56 | 88,382.53 |
Wrapped Bitcoin Price Prediction 2026
Diving into the data for 2026, the Wrapped Bitcoin landscape appears promising. The forecast suggests a minimal price of $80,860.92 to begin the year. As the months roll on, the average price might gravitate around $95,932.24. On a bullish streak? The maximum price could hit a ceiling of $114,095.25.
| Month | Minimum Price | Average Price | Maximum Price |
|---|---|---|---|
| February 2026 | 80,860.92 | 83,967.73 | 87,410.40 |
| March 2026 | 83,044.16 | 86,234.85 | 89,770.48 |
| April 2026 | 85,286.36 | 88,563.20 | 92,194.29 |
| May 2026 | 87,589.09 | 90,954.40 | 94,683.53 |
| June 2026 | 89,953.99 | 93,410.17 | 97,239.99 |
| July 2026 | 92,382.75 | 95,932.24 | 99,865.47 |
| August 2026 | 94,877.09 | 98,522.42 | 102,561.83 |
| September 2026 | 97,438.77 | 101,182.52 | 105,331.00 |
| October 2026 | 100,069.61 | 103,914.45 | 108,174.94 |
| November 2026 | 102,771.49 | 106,720.14 | 111,095.66 |
| December 2026 | 105,546.32 | 109,601.58 | 114,095.25 |
| January 2027 | 108,396.07 | 112,560.83 | 117,175.82 |
Wrapped Bitcoin Price Prediction 2027
From our vantage point, 2027 is poised to continue the upward trajectory. The year might dawn with a minimal price of $107,203.82, while the average price looks set to revolve around $127,185.09. And for the optimistic lot? There’s potential for a maximum price crescendo at $151,265.24.
| Month | Minimum Price | Average Price | Maximum Price |
|---|---|---|---|
| February 2027 | 107,203.82 | 111,322.76 | 115,887.00 |
| March 2027 | 110,098.32 | 114,328.48 | 119,015.95 |
| April 2027 | 113,070.98 | 117,415.35 | 122,229.38 |
| May 2027 | 116,123.90 | 120,585.56 | 125,529.57 |
| June 2027 | 119,259.24 | 123,841.37 | 128,918.87 |
| July 2027 | 122,479.24 | 127,185.09 | 132,399.68 |
| August 2027 | 125,786.18 | 130,619.09 | 135,974.47 |
| September 2027 | 129,182.41 | 134,145.80 | 139,645.78 |
| October 2027 | 132,670.33 | 137,767.74 | 143,416.22 |
| November 2027 | 136,252.43 | 141,487.47 | 147,288.45 |
| December 2027 | 139,931.25 | 145,307.63 | 151,265.24 |
| January 2028 | 143,709.39 | 149,230.93 | 155,349.40 |
Wrapped Bitcoin Price Prediction 2028
Analysts anticipate 2028 to uphold the growth story for WBTC. Initiating its journey, the year might peg the minimal price at $142,128.73. Further along, we could see the average price find its stride at $168,619.50. And under ideal conditions? A maximum price of $200,544.50 beckons.
| Month | Minimum Price | Average Price | Maximum Price |
|---|---|---|---|
| February 2028 | 142,128.73 | 147,589.54 | 153,640.71 |
| March 2028 | 145,966.21 | 151,574.46 | 157,789.01 |
| April 2028 | 149,907.29 | 155,666.97 | 162,049.32 |
| May 2028 | 153,954.79 | 159,869.98 | 166,424.65 |
| June 2028 | 158,111.57 | 164,186.47 | 170,918.11 |
| July 2028 | 162,380.58 | 168,619.50 | 175,532.90 |
| August 2028 | 166,764.86 | 173,172.23 | 180,272.29 |
| September 2028 | 171,267.51 | 177,847.88 | 185,139.64 |
| October 2028 | 175,891.73 | 182,649.77 | 190,138.41 |
| November 2028 | 180,640.81 | 187,581.32 | 195,272.15 |
| December 2028 | 185,518.11 | 192,646.01 | 200,544.50 |
| January 2029 | 190,527.10 | 197,847.46 | 205,959.20 |
Wrapped Bitcoin Price Prediction 2029
Venturing into 2029, our team expects a consistent performance from WBTC. With a starting minimal price of $188,431.49, the year’s narrative could average out at $223,552.44. And should the market rally in favor? We might be celebrating a maximum price of $265,877.98.
| Month | Minimum Price | Average Price | Maximum Price |
|---|---|---|---|
| February 2029 | 188,431.49 | 195,671.33 | 203,693.86 |
| March 2029 | 193,519.14 | 200,954.46 | 209,193.59 |
| April 2029 | 198,744.16 | 206,380.23 | 214,841.82 |
| May 2029 | 204,110.25 | 211,952.49 | 220,642.55 |
| June 2029 | 209,621.23 | 217,675.21 | 226,599.90 |
| July 2029 | 215,281.00 | 223,552.44 | 232,718.09 |
| August 2029 | 221,093.59 | 229,588.36 | 239,001.48 |
| September 2029 | 227,063.12 | 235,787.24 | 245,454.52 |
| October 2029 | 233,193.82 | 242,153.50 | 252,081.79 |
| November 2029 | 239,490.05 | 248,691.64 | 258,888.00 |
| December 2029 | 245,956.28 | 255,406.32 | 265,877.98 |
| January 2030 | 252,597.10 | 262,302.29 | 273,056.68 |
Wrapped Bitcoin Price Prediction 2030
Interpreting the crypto waves for 2030, the long-term Wrapped Bitcoin’s scenario seems optimistic. The narrative might commence with a minimal price of $249,818.78. Progressing through the months, the average price could stabilize at $296,381.45. And if WBTC sails smoothly? The horizon might witness a maximum price of $352,495.82.
| Month | Minimum Price | Average Price | Maximum Price |
|---|---|---|---|
| February 2030 | 249,818.78 | 259,417.22 | 270,053.33 |
| March 2030 | 256,563.89 | 266,421.49 | 277,344.77 |
| April 2030 | 263,491.12 | 273,614.87 | 284,833.08 |
| May 2030 | 270,605.38 | 281,002.47 | 292,523.57 |
| June 2030 | 277,911.72 | 288,589.53 | 300,421.71 |
| July 2030 | 285,415.34 | 296,381.45 | 308,533.09 |
| August 2030 | 293,121.55 | 304,383.75 | 316,863.49 |
| September 2030 | 301,035.83 | 312,602.11 | 325,418.80 |
| October 2030 | 309,163.80 | 321,042.37 | 334,205.11 |
| November 2030 | 317,511.22 | 329,710.51 | 343,228.64 |
| December 2030 | 326,084.03 | 338,612.70 | 352,495.82 |
| January 2031 | 334,888.30 | 347,755.24 | 362,013.21 |
Wrapped Bitcoin Price Prediction 2031
Based on our comprehensive research, 2031 is slated to be another growth year for WBTC. The minimal price might be pegged at $331,204.86 as the year begins. Evolving through the seasons, the average price could trend near $392,936.74. In a bull market scenario? We might eye a maximum price of $467,332.07.
| Month | Minimum Price | Average Price | Maximum Price |
|---|---|---|---|
| February 2031 | 331,204.86 | 343,930.28 | 358,031.43 |
| March 2031 | 340,147.39 | 353,216.40 | 367,698.27 |
| April 2031 | 349,331.37 | 362,753.24 | 377,626.13 |
| May 2031 | 358,763.32 | 372,547.58 | 387,822.03 |
| June 2031 | 368,449.93 | 382,606.37 | 398,293.23 |
| July 2031 | 378,398.08 | 392,936.74 | 409,047.15 |
| August 2031 | 388,614.83 | 403,546.03 | 420,091.42 |
| September 2031 | 399,107.43 | 414,441.77 | 431,433.89 |
| October 2031 | 409,883.33 | 425,631.70 | 443,082.60 |
| November 2031 | 420,950.18 | 437,123.76 | 455,045.83 |
| December 2031 | 432,315.83 | 448,926.10 | 467,332.07 |
| January 2032 | 443,988.36 | 461,047.10 | 479,950.03 |
Wrapped Bitcoin Price Prediction 2032
Peering into 2032, Wrapped Bitcoin’s trajectory paints a favorable picture. The year could possibly unfurl with a minimal price of $439,104.93. As the narrative unfolds, a mean average price of $520,947.85 seems likely. And if all the crypto stars align? We could bask in the glory of a maximum price of $619,579.72.
| Month | Minimum Price | Average Price | Maximum Price |
|---|---|---|---|
| February 2032 | 439,104.93 | 455,976.05 | 474,671.06 |
| March 2032 | 450,960.77 | 468,287.40 | 487,487.18 |
| April 2032 | 463,136.71 | 480,931.16 | 500,649.34 |
| May 2032 | 475,641.40 | 493,916.30 | 514,166.87 |
| June 2032 | 488,483.71 | 507,252.04 | 528,049.37 |
| July 2032 | 501,672.77 | 520,947.85 | 542,306.71 |
| August 2032 | 515,217.94 | 535,013.44 | 556,948.99 |
| September 2032 | 529,128.82 | 549,458.80 | 571,986.61 |
| October 2032 | 543,415.30 | 564,294.19 | 587,430.25 |
| November 2032 | 558,087.52 | 579,530.13 | 603,290.87 |
| December 2032 | 573,155.88 | 595,177.44 | 619,579.72 |
| January 2033 | 588,631.09 | 611,247.23 | 636,308.37 |
The Main Questions Of Critical Thinking When We Talk About Wrapped Bitcoin Price Forecast
In the ever-evolving realm of cryptocurrency, diving deep into price forecasts, especially for assets like Wrapped Bitcoin (WBTC), demands more than a cursory glance at numbers. It’s imperative to approach these predictions armed with critical thinking. Here’s a list of critical thinking questions tailored specifically for Wrapped Bitcoin (WBTC) price forecast:
- What analytical tools or methodologies underpin this Wrapped Bitcoin price prediction?
- Is the WBTC forecast predominantly rooted in historical patterns, or does it also incorporate potential future market shifts and external occurrences?
- Are there any underlying assumptions about the overall crypto ecosystem’s trajectory?
- Does the forecast account for specific developments or trends related to the WBTC protocol and its integrations?
- Are the WBTC predictions anchored in recognized research publications, scholarly articles, or informed expert insights?
- Is there any discernible partiality or predisposition in the data source or the individuals providing the forecast?
- How does the WBTC forecast align with the overarching sentiment and direction of the broader cryptocurrency market?
- What are the distinct elements influencing WBTC’s value that might be absent in other cryptocurrency projections?
- Are there imminent regulatory decisions, technological advancements, or market happenings that could drastically alter WBTC’s outlook?
- How could global events or evolutions in blockchain technology uniquely impact Wrapped Bitcoin?
- Given the inherent unpredictability of the crypto space, is the WBTC forecast revised regularly to encapsulate significant market alterations?
- Are potential worst-case scenarios discussed in the predictions? What are the outlined barriers or hurdles that might hinder reaching the forecasted WBTC price?
- What are other seasoned professionals or analytical models suggesting about WBTC’s price in the foreseeable future?
- Are there differing opinions about WBTC’s trajectory? If so, what rationale is presented to support these alternative viewpoints?
- Do the projections delve into the potential evolution of WBTC’s utility or its rate of adoption over the forecast duration?
- While precise forecasts are a rarity, is there a price range provided for WBTC? If yes, how broad is this spectrum?
- How might changes in Ethereum (given WBTC operates on its blockchain) affect the Wrapped Bitcoin price projections?
- Are there considerations regarding the liquidity and volume of Wrapped Bitcoin when making these price predictions?
- How might the interplay between Bitcoin and Wrapped Bitcoin dynamics influence the forecast?
- In the rapidly changing world of decentralized finance (DeFi), how might new innovations or competitors affect WBTC’s position and, subsequently, its price predictions?
By questioning, analyzing, and understanding the nuances behind each prediction, you stand a better chance of navigating the turbulent waters of cryptocurrency investments.
Wrapped Bitcoin (WBTC) Future Price Predictions by Experts
Great, let’s delve into the opinions of some industry experts and analysts regarding Wrapped Bitcoin (WBTC) future price and prospects. Remember, these are expert opinions and should not be taken as investment advice.
- WalletInvestor: According to WalletInvestor, a long-term increase is not expected, and the price prognosis for the year 2024 stands at $7173.992.
- DigitalCoinPrice: DigitalCoinPrice suggests that, based on their Wrapped Bitcoin forecast, the WBTC price might exceed $59,224.89 by the conclusion of 2024 and potentially reach $122,312.62 by 2026, indicating a profitable investment opportunity.
- GOV Capital: GOV Capital observes that Wrapped Bitcoin displays a rising tendency. Their Wrapped Bitcoin price prediction posits that WBTC could be a good investment, with a future price estimate of $67869.93 after a year.
- Cryptocurrency Price Prediction: Cryptocurrency Price Prediction, through its technical analysis and forecast, proposes that the Wrapped Bitcoin coin price might ascend to $72,934 by the termination of 2024 and soar to a striking $675,314 by the end of 2030.
Decoding the Charts: WBTC Technical Price Analysis
Dive into the world of crypto, and you’ll soon realize it’s not just about catching the latest news or feeling the market’s pulse. Nope, a massive part of the game lies in understanding those ever-tantalizing charts. Specifically, for assets like Wrapped Bitcoin (WBTC), technical analysis can be your compass in the often turbulent seas of cryptocurrency trading. But what tools do experts wield to read these charts? Here’s a quick rundown:
- Price charts: Technical analysts use various types of price charts, such as line charts, bar charts, and candlestick charts, to visualize historical price data and identify patterns or trends.
- Trend analysis: Identifying the overall trend is a critical aspect of technical analysis. Traders look for uptrends (a series of higher highs and higher lows) or downtrends (a series of lower highs and lower lows) to determine the market’s direction.
- Support and resistance levels: Support levels are price points where an asset’s price has historically had difficulty falling below, while resistance levels are points where the price has had difficulty rising above. These levels can help traders identify potential entry and exit points for trades.
- Technical indicators: Technical analysts use various mathematical indicators to gain insights into market trends and momentum. Some common indicators include moving averages, (RSI), moving average convergence divergence (MACD), and Bollinger Bands.
- Chart patterns: Technical analysts look for specific chart patterns that may suggest price movements. Examples of chart patterns include head and shoulders, double tops and bottoms, triangles, and flags.
- Volume analysis: Analyzing trade volume can provide insights into the strength or weakness of price movements. High volume during a price increase can signal strong buying interest, while low volume during a price decline may indicate weak selling pressure.
- Timeframes: Technical analysts can apply their methods to various timeframes, from intraday charts to weekly or monthly charts, depending on their trading style and objectives.
Technical Indicators: Origin and Purpose
Ah, technical indicators! Think of them as the trusty tools in a trader’s toolkit. These nifty little instruments originated from the need to understand and predict future price movements based on historical data. Imagine being a sailor, and technical indicators are the stars you navigate by. They won’t predict the future with 100% accuracy (nothing can!), but they provide a framework, a guideline, something tangible in the intangible world of crypto trading.
The Role of Technical Indicators in Financial Markets
In the grand theater of financial markets, technical indicators play the lead role. Whether it’s stocks, bonds, forex, or our beloved cryptos, these indicators help traders identify potential buy or sell signals. They act as a bridge, connecting past market behavior with potential future movements. By observing patterns, whether it’s a sudden surge in volume or the narrowing of Bollinger Bands, savvy traders can make educated guesses about where the market might head next.
How Technical Indicators Can Help Predict Wrapped Bitcoin Price
Let’s talk WBTC! With Wrapped Bitcoin, as with other cryptocurrencies, volatility is the name of the game. But within this wild rollercoaster, technical indicators can provide moments of clarity. For instance, an oversold RSI might suggest that WBTC is undervalued, presenting a potential buying opportunity. Conversely, if our Fibonacci Retracement lines indicate strong resistance, it could be a sign that selling pressure is about to intensify. By understanding and leveraging these tools, you’re not just shooting in the dark; you’re aiming with precision, backed by data and time-tested methodologies.
Navigating the cryptocurrency markets can often feel akin to sailing a ship amidst a tempest, with the swells and troughs of volatility seemingly at every turn. But fret not, technical indicators guide us through these waters. Today, let’s dive deep into these guiding lights and explore how they illuminate the path for Wrapped Bitcoin (WBTC) price predictions.
Moving Averages (MAs) for Wrapped Bitcoin Price Prediction
Think of Moving Averages (often simply termed MAs) as the gentle hand that smoothens out the erratic heartbeats of the crypto market. These tools provide an averaged view of a coin’s price trajectory over a defined period. The principle is elementary: by averaging the price data, you filter out the ‘noise,’ revealing a clearer picture of the underlying trend.

Example: Imagine a month where WBTC’s price danced unpredictably due to various market stimuli. But when you cast your gaze upon a 30-day MA, you discern that despite these wild jigs, the overarching trend for WBTC leans upwards. This could hint at a broader bullish sentiment, suggesting the transient volatility may not derail WBTC’s longer-term growth prospects.
Relative Strength Index (RSI) for Wrapped Bitcoin Price Prediction
The RSI is like the pulse check for any asset, Wrapped Bitcoin included. It gauges the momentum by comparing the magnitude of recent gains to recent losses. Values range from 0 to 100, and traders commonly view levels above 70 as ‘overbought’ and below 30 as ‘oversold’.
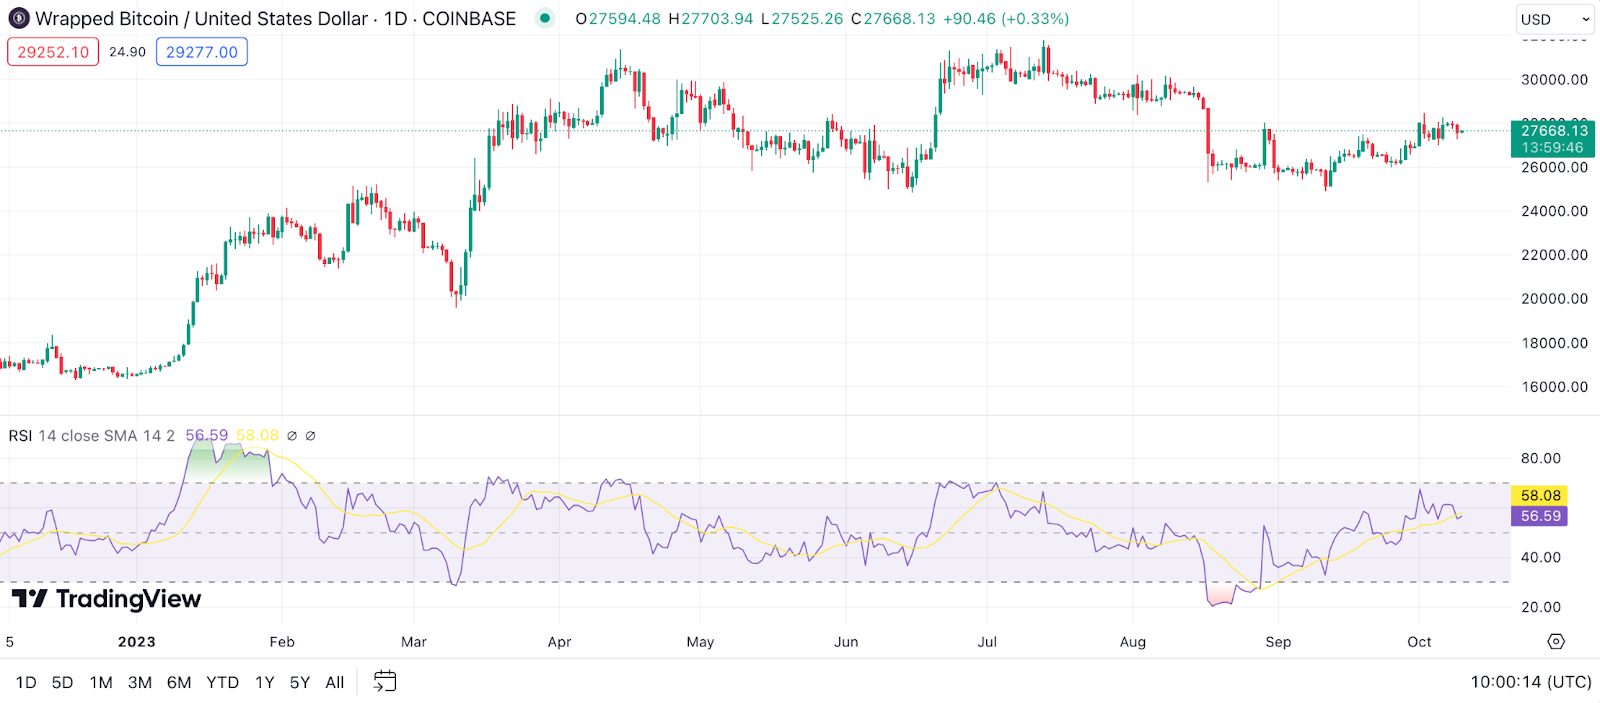
Example: Suppose the RSI for WBTC zooms above 80 after a week of strong gains. This might suggest that WBTC is overbought, and a correction or pullback could be on the horizon. Conversely, if the RSI dips below 20 during a market downturn, it might indicate WBTC is oversold, and a rebound could be in the cards.
Moving Average Convergence Divergence (MACD) for Wrapped Bitcoin Price Prediction
MACD is the drama queen of indicators. It’s all about capturing the relationship between two moving averages of an asset’s price. The MACD line is the difference between a 12-period and a 26-period moving average. When the MACD line crosses above the signal line, it’s a bullish sign; when it goes below, it’s bearish.
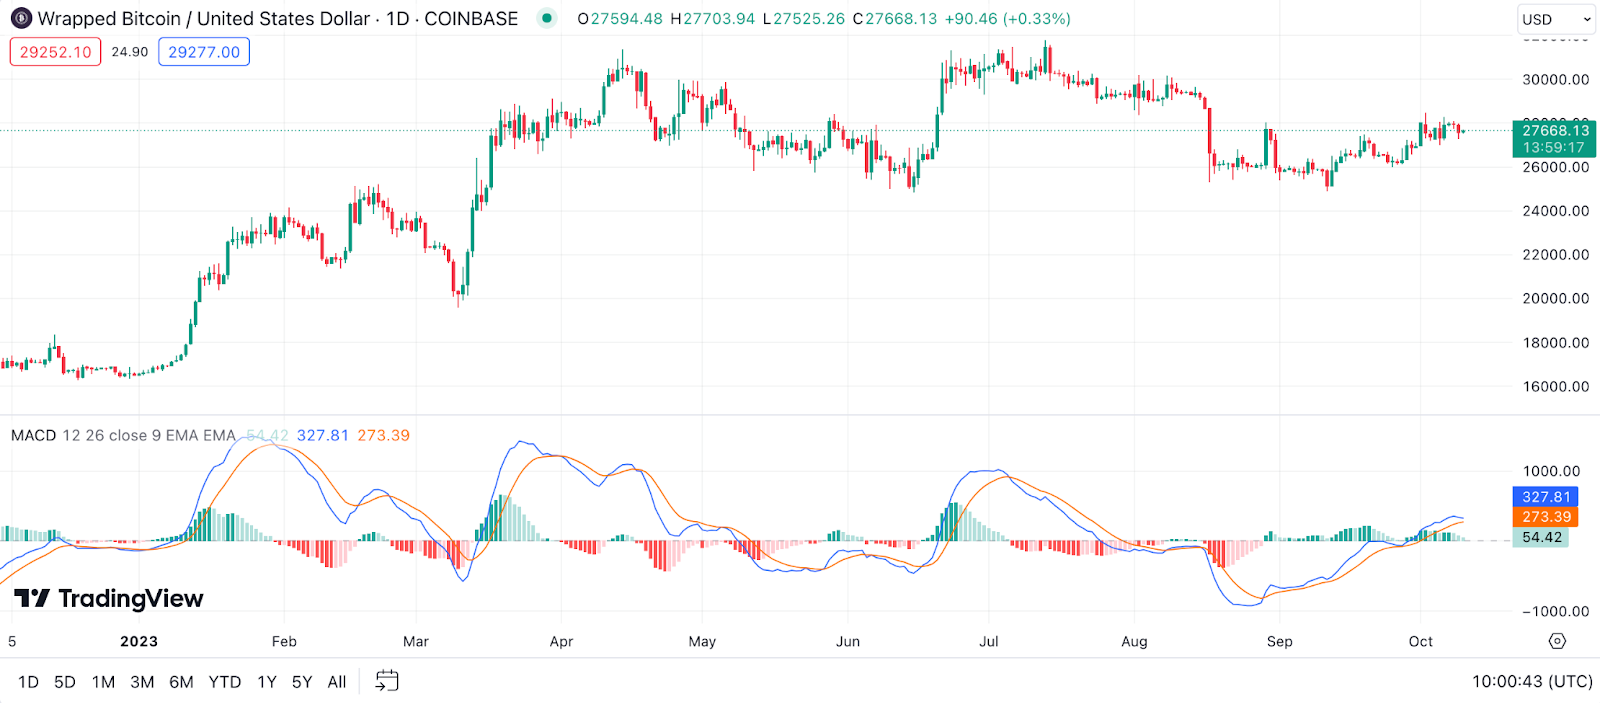
Example: If you’ve been keeping an eye on the WBTC charts, you might notice the MACD line inching closer to the signal line. When it finally crosses above, it’s like the universe is giving you a nudge, suggesting it might be a good time to invest. But remember, always pair this with other indicators and do your due diligence!
Bollinger Bands for Wrapped Bitcoin Price Prediction
Bollinger Bands are like the trusty safety bumpers in a bowling alley. They consist of three lines: a middle band being an N-period simple moving average (SMA), an upper band, and a lower band. These bands adapt and expand based on an asset’s volatility, providing a dynamic view of potential overbought or oversold conditions.

Example: If you’ve been observing the WBTC charts and see the price touching or moving above the upper Bollinger Band, it might indicate that WBTC is overbought. Conversely, should the price start hovering near or below the lower band, it suggests that WBTC might be oversold and due for a bounce back. But tread with caution; bands can expand with increased volatility.
Stochastic Oscillator for Wrapped Bitcoin Price Prediction
The Stochastic Oscillator, with its seemingly complex name, is your go-to tool to measure momentum. It compares a particular closing price of Wrapped Bitcoin to a range of its prices over a certain period. The oscillator moves between zero and one hundred, and just like the RSI, values above 80 are typically considered overbought, while those below 20 are considered oversold.
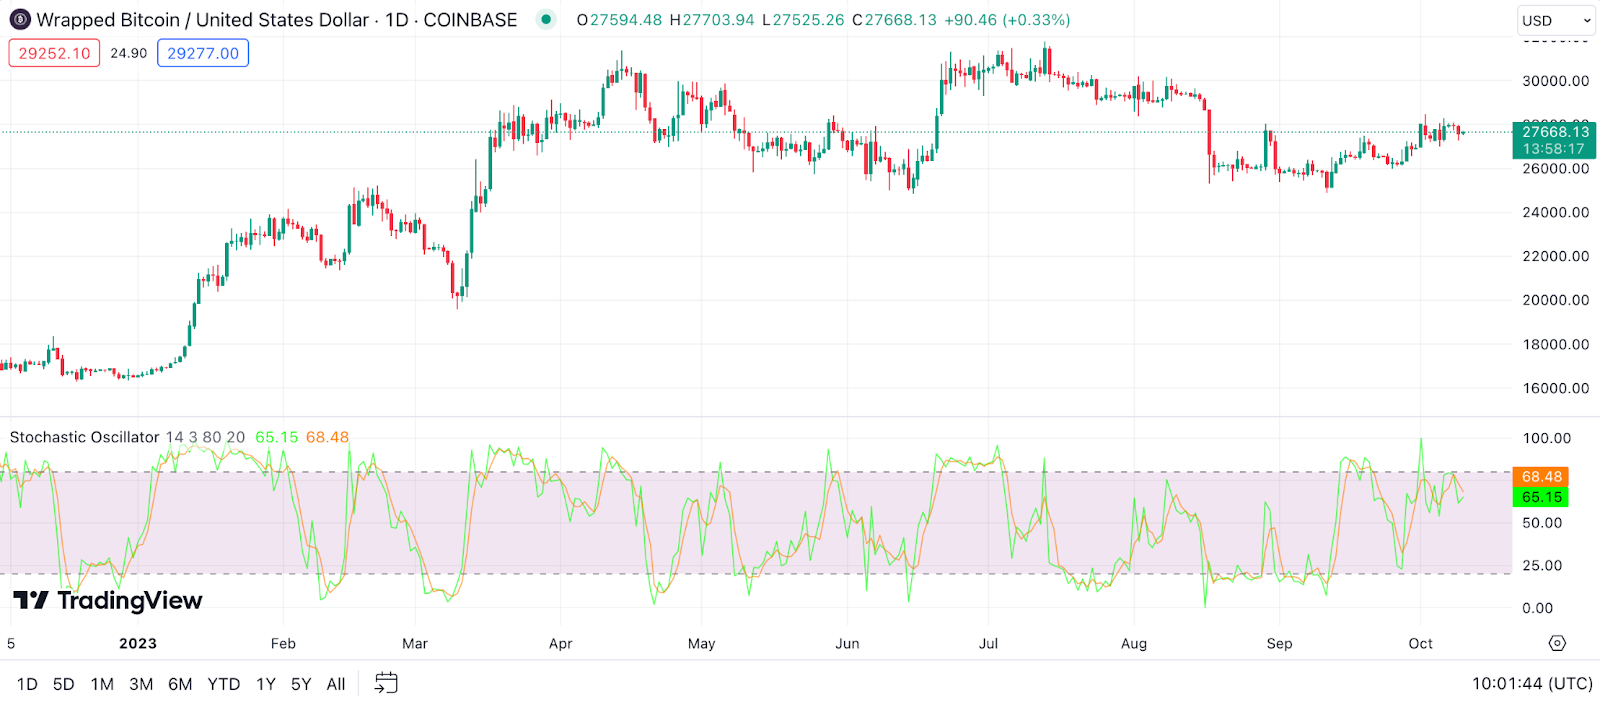
Example: Let’s paint a picture where the Stochastic Oscillator for WBTC drops to 15 after a sharp price decline. This could be signaling that the asset is in an oversold territory, potentially indicating an upcoming price reversal. But remember, it’s always best to cross-check with other indicators for a fuller picture.
Parabolic SAR (Stop and Reverse) for Wrapped Bitcoin Price Prediction
The Parabolic SAR, or simply SAR, is a delightful tool designed to provide specific entry and exit points. It appears as dots on a chart, either above or below the asset’s price, indicating the direction in which the price is moving. When the dots flip sides, it often suggests a potential change in price direction.
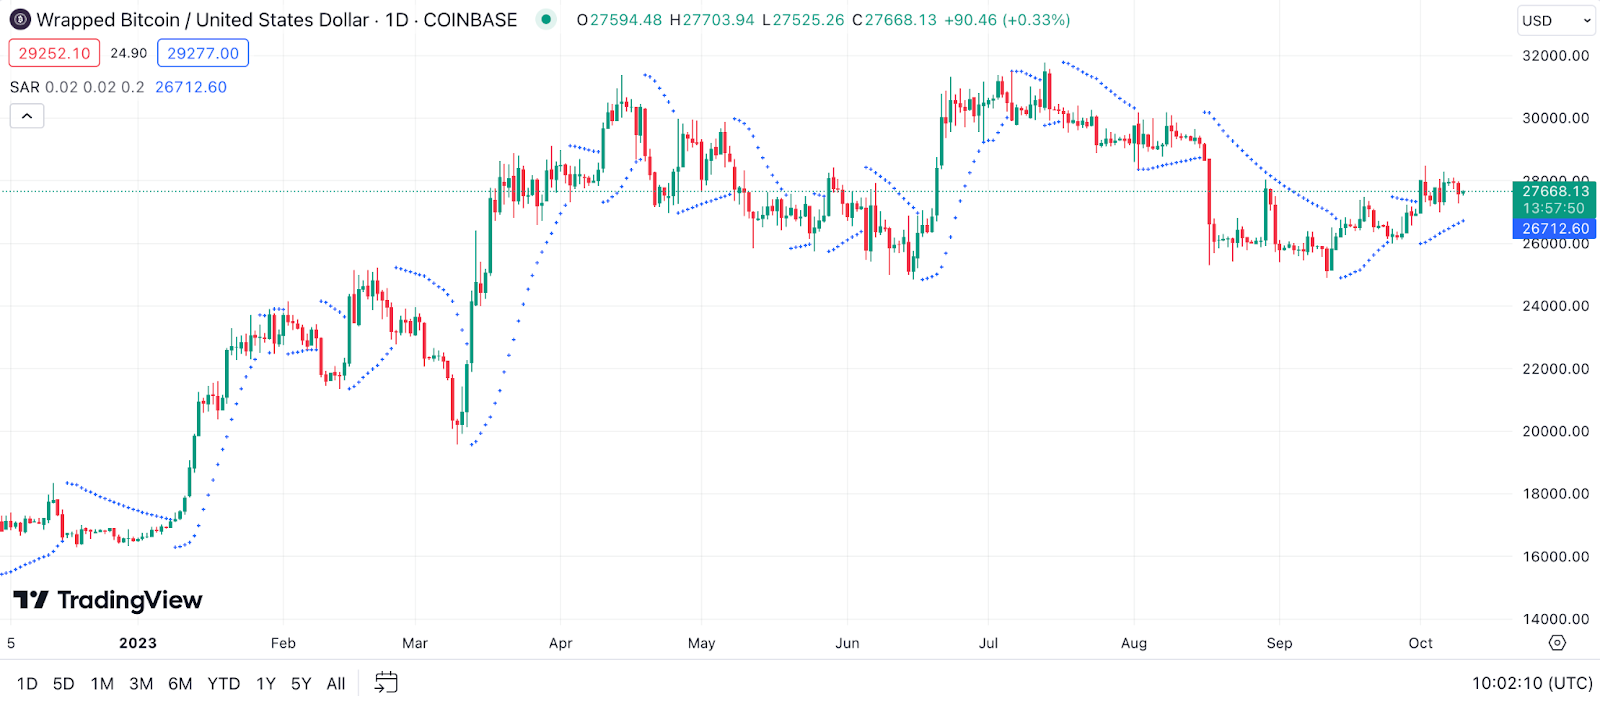
Example: You’re sipping your morning coffee, going through the WBTC chart, and notice the Parabolic SAR dots have shifted from above the price candles to below them. This switch often hints at a potential bullish trend. It’s like the market gently whispering, “Hey, things might be turning up.” But, as always, ensure you consider the broader market context.
Ichimoku Cloud for Wrapped Bitcoin Price Prediction
The Ichimoku Cloud, or simply ‘Ichimoku’, sounds mystical, and its chart might look like a weather forecast at first glance. But, in essence, it offers a comprehensive view of support, resistance, momentum, and trend direction by utilizing five distinct lines. The ‘cloud’ is formed between two of these lines: Senkou Span A and Senkou Span B.

Example: Picture this—you’re analyzing the WBTC chart and notice the price has moved above the Ichimoku Cloud. This breakout typically signals a bullish trend. Conversely, if WBTC dips below the cloud, it’s often a bearish indication. If the cloud turns from red to green, it might signify a reversal in trend.
Fibonacci Retracement for Wrapped Bitcoin Price Prediction
The Fibonacci Retracement, stemming from the famous Fibonacci sequence, provides traders with horizontal lines indicating potential levels of support and resistance. By connecting a major high to a major low, these levels can help determine possible price reversal zones.
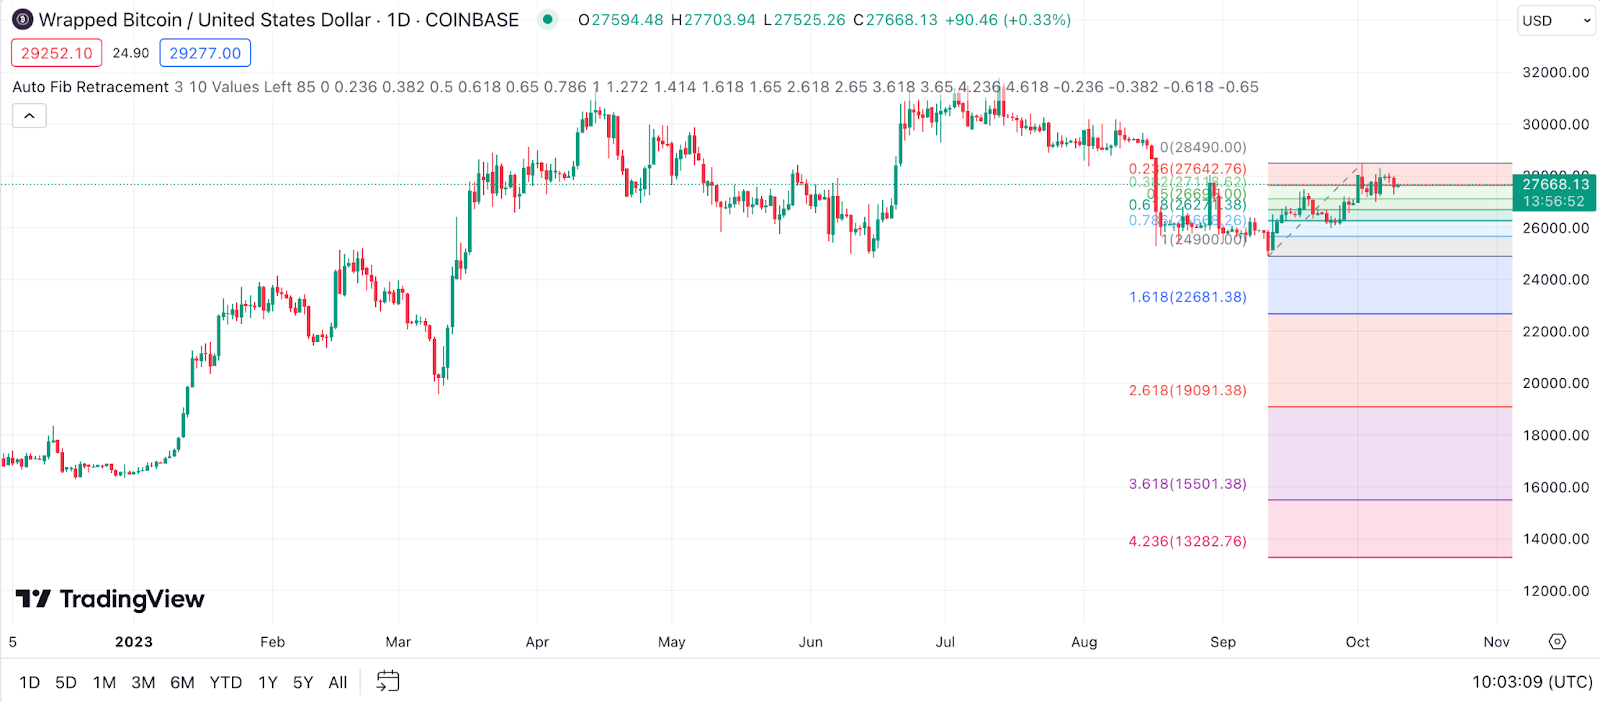
Example: WBTC has been on a wild ride, surging to new heights and then retracing a bit. By using the Fibonacci Retracement tool, you find that WBTC’s price is hovering around the 0.618 level, a golden ratio. This could act as a strong support, and if the price bounces off from this level, it could be an ideal buying opportunity.
Average Directional Index (ADX) for Wrapped Bitcoin Price Prediction
The ADX is all about gauging trend strength. It doesn’t exactly tell the direction of the trend but indicates how strong or weak it is. Typically, an ADX value above 25 suggests a strong trend, while below 20 indicates a weak trend or sideways movement.
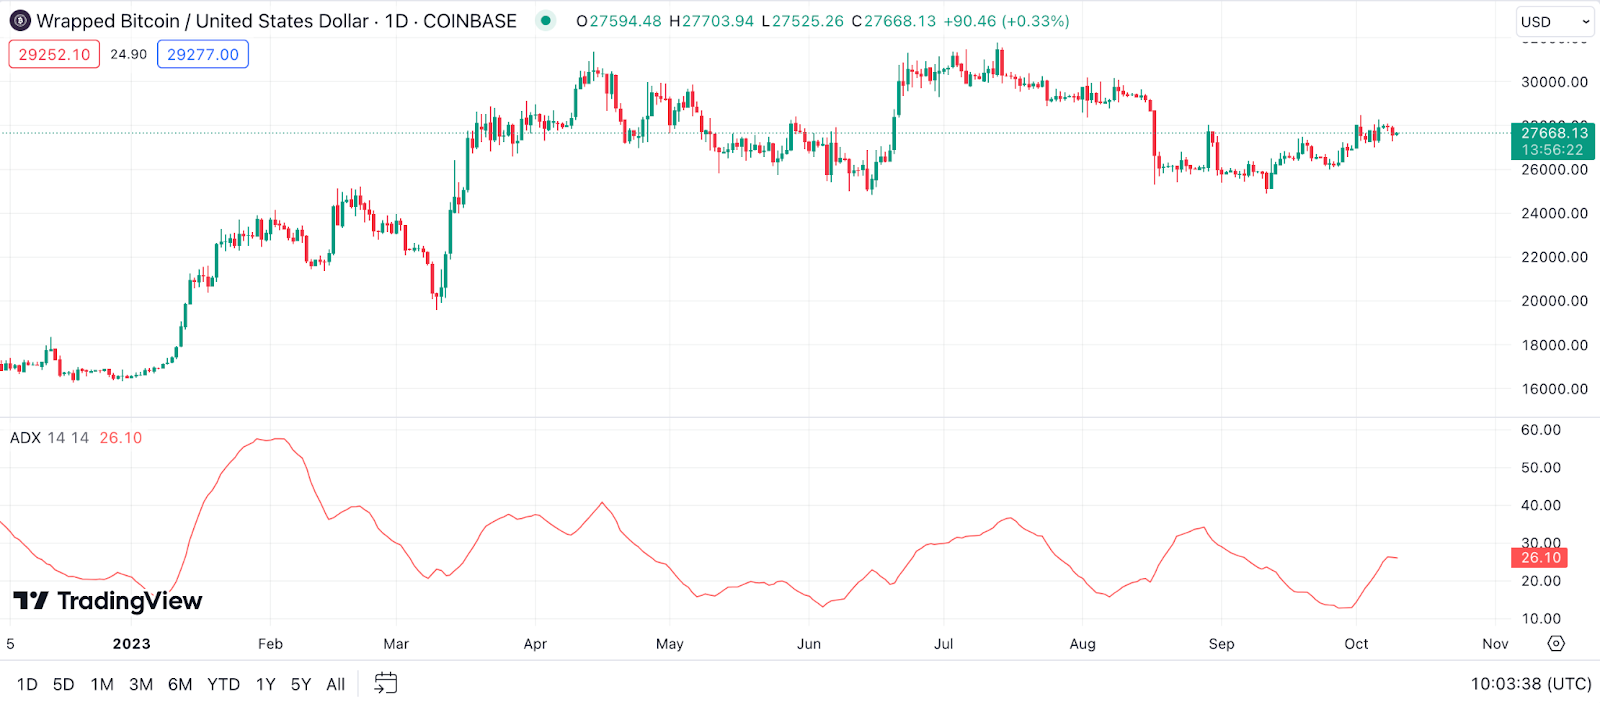
Example: You’ve had your eye on the WBTC chart, and the ADX suddenly spikes to 30. This indicates that the ongoing trend—be it bullish or bearish—is gaining momentum. So, if WBTC was on an upward trajectory when this occurred, it could mean the bullish trend is solidifying.
On Balance Volume (OBV) for Wrapped Bitcoin Price Prediction
On Balance Volume, commonly referred to as OBV, is a momentum indicator that links volume to price changes. It’s straightforward: when the asset’s price closes higher than the previous day, volume gets added to the OBV, and when it closes lower, the volume gets subtracted.
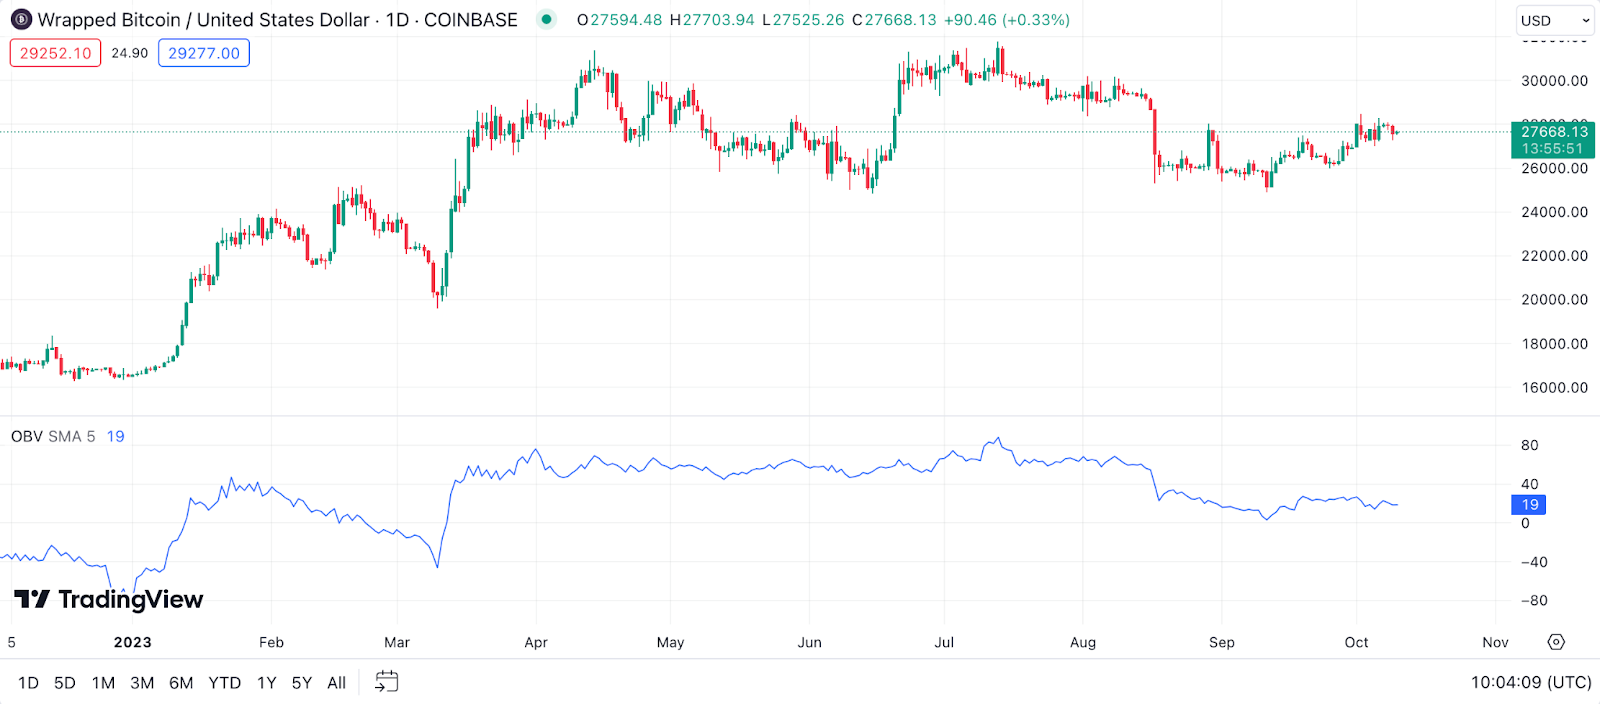
Example: You’re studying the WBTC chart and see that its price has been steadily increasing. Now, if the OBV is also on an upward trajectory, it confirms that the volume is supporting this price rise, signaling a strong bullish trend. Conversely, if WBTC prices are rising, but OBV is moving downwards, it could be a sign of a potential bearish divergence.
Rate of Change (ROC) for Wrapped Bitcoin Price Prediction
The Rate of Change, or ROC, is all about momentum. It measures the percentage change between the current price and the price from a specified number of periods ago. In essence, it tells us how rapidly the price is changing.

Example: While observing the WBTC chart, you note that the ROC has shifted from a negative value to a positive one. This transition might suggest that WBTC’s momentum is shifting from bearish to bullish. If this upward ROC continues, it could be an indication of a strengthening upward trend for WBTC.
Commodity Channel Index (CCI) for Wrapped Bitcoin Price Prediction
The CCI, originally developed for commodities, is now widely used for various assets, including cryptocurrencies. It measures the difference between the asset’s current price, its average price, and its average deviation over a specific period. Values above +100 can indicate an overbought condition, while values below -100 can suggest an oversold condition.
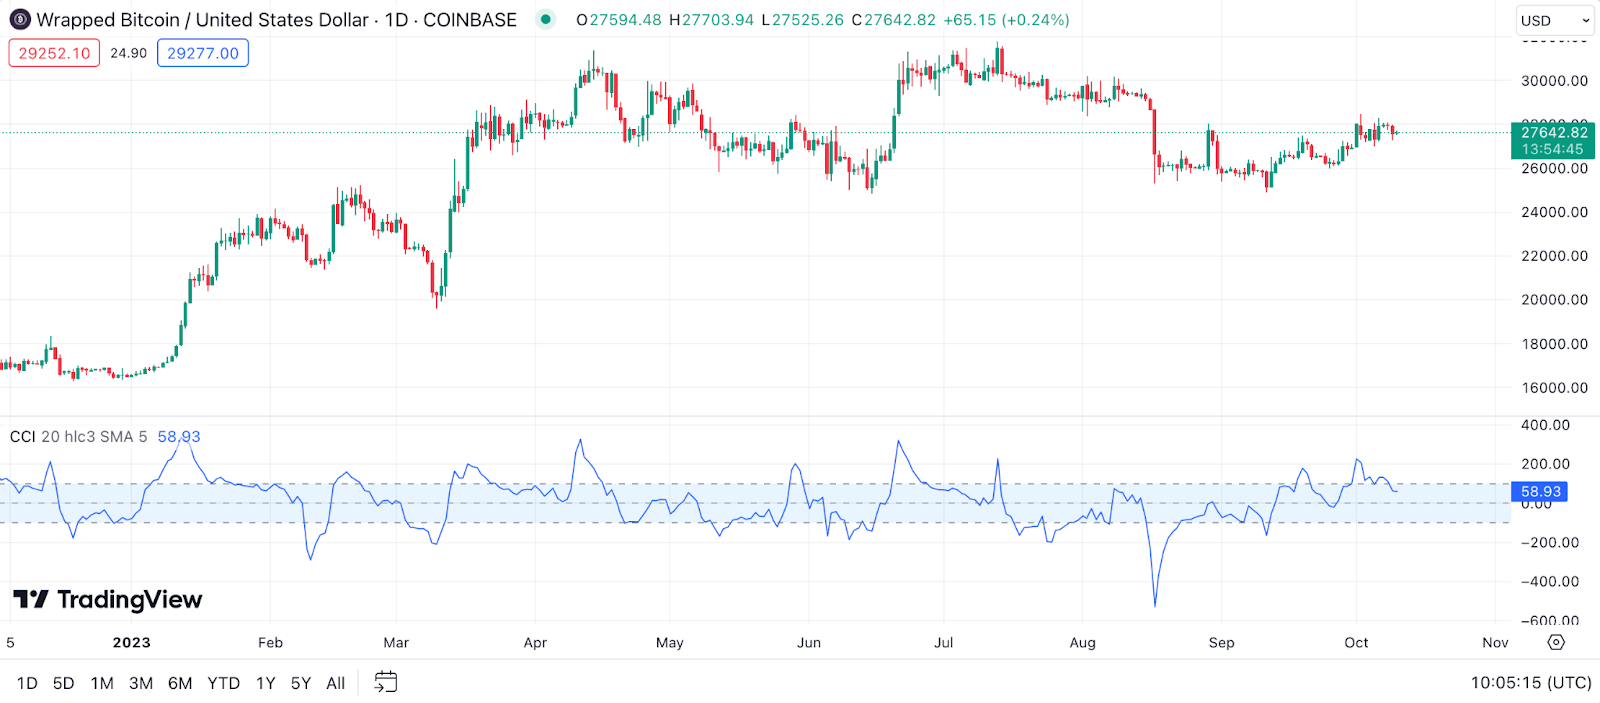
Example: Let’s say the CCI for WBTC has plummeted to -120 after a period of drop. This could indicate that WBTC is in an oversold territory, and a price reversal or bounce might be imminent. However, if the CCI lingers in this zone without a price reversal, it might suggest a strong bearish trend.
Accumulation/Distribution Line (A/D Line) for Wrapped Bitcoin Price Prediction
The A/D Line is like the heartbeat monitor for an asset’s supply and demand. It takes into account the volume and price to determine whether an asset is being accumulated (bought) or distributed (sold). If the A/D Line is rising, it indicates buying pressure (accumulation), and if it’s falling, it suggests selling pressure (distribution).
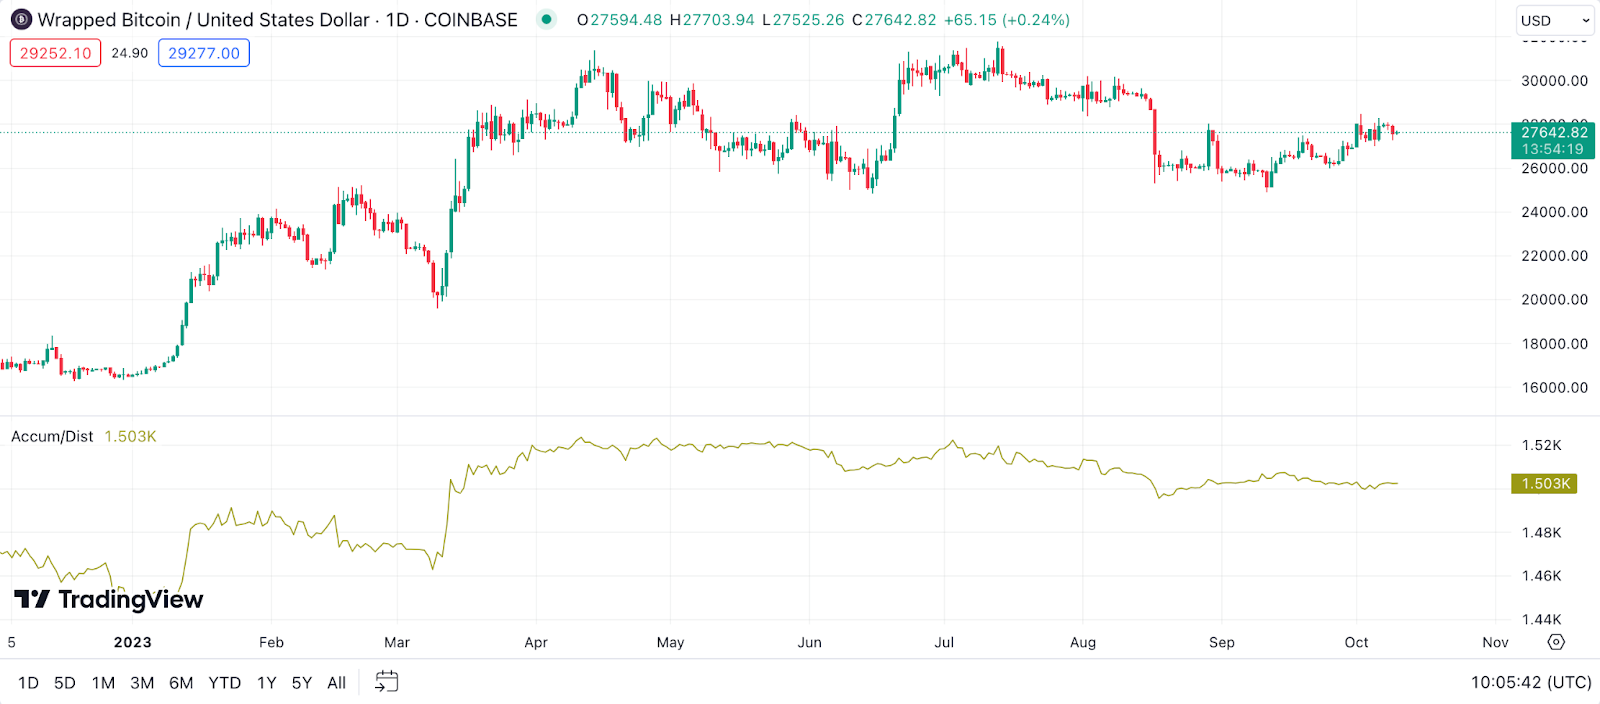
Example: While examining the WBTC chart, you spot the A/D Line moving upwards, even as WBTC’s price remains relatively stable. This divergence could hint that despite the stable price, there’s underlying buying pressure, suggesting that a bullish breakout might be on the horizon.
Pivot Points for Wrapped Bitcoin Price Prediction
Pivot Points are like the North Star for traders, guiding them through potential support and resistance levels. These are calculated using the average of an asset’s high, low, and closing prices from the previous trading session. Pivot Points can provide traders with levels to watch for potential price reversals or breakouts.
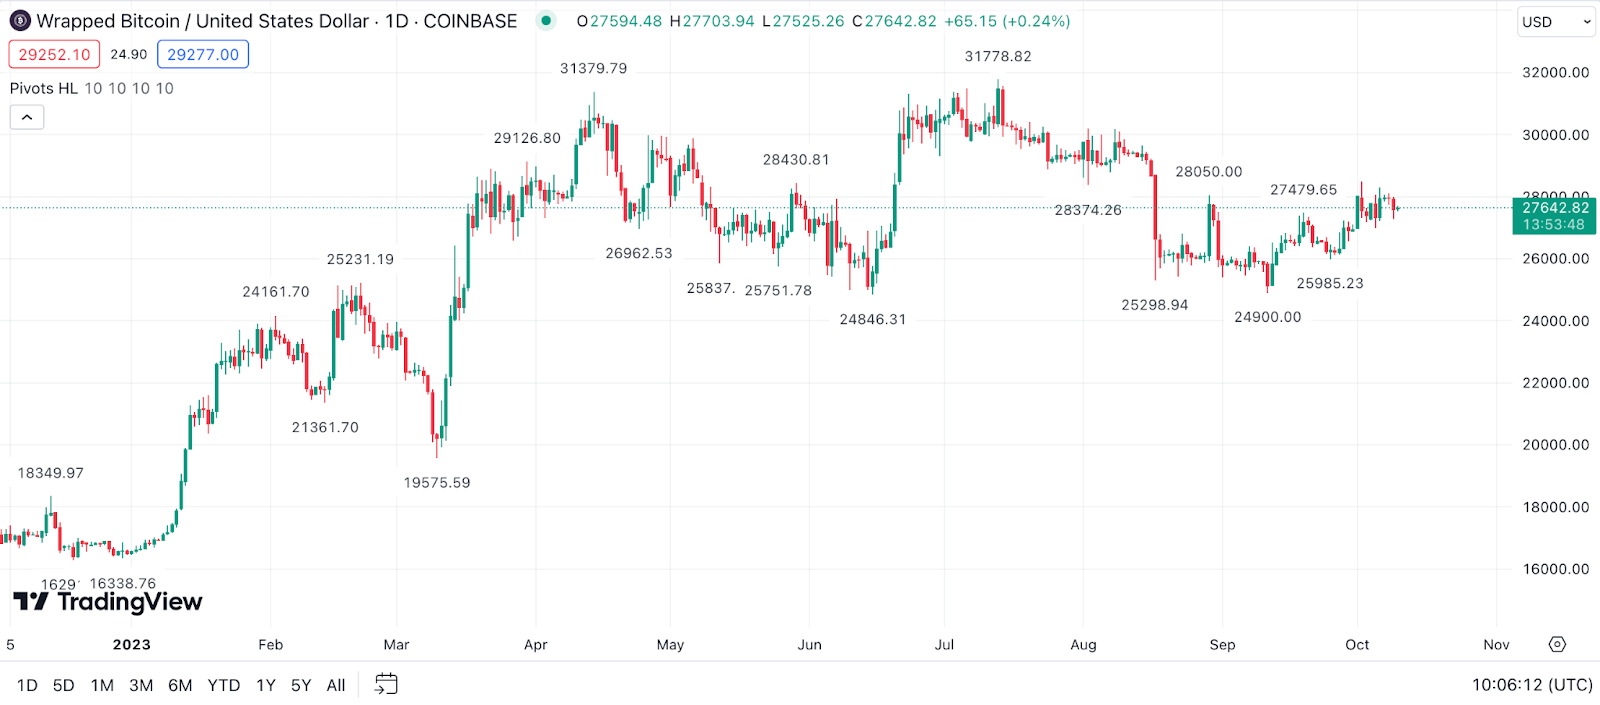
Example: After a volatile trading day for WBTC, you calculate the next day’s Pivot Points. Throughout the day, you notice WBTC’s price bouncing off one of the predicted support levels without breaking below it. This could indicate a strong support level, suggesting that the price might climb from there.
Chaikin Money Flow (CMF) for Wrapped Bitcoin Price Prediction
The CMF, developed by Marc Chaikin, evaluates the amount of Money Flow Volume over a specific period. It’s a way to gauge the market’s sentiment towards an asset, oscillating between -1 and 1. Positive values hint at buying pressure, while negative ones suggest selling pressure.

Example: As you sift through the WBTC chart, you notice the CMF moving steadily above the zero line. This continued positive value might suggest that money is flowing into WBTC, indicating a bullish sentiment. If paired with other positive indicators, it could be a sign of an impending upward trend.
Aroon Indicator for Wrapped Bitcoin Price Prediction
The Aroon Indicator, a lesser-known yet powerful tool, helps traders identify when a new trend might be starting or if an existing trend is losing steam. Comprising the “Aroon Up” and “Aroon Down” lines, this indicator moves between 0 and 100. A high Aroon Up combined with a low Aroon Down signifies a bullish trend, and vice-versa for a bearish trend.
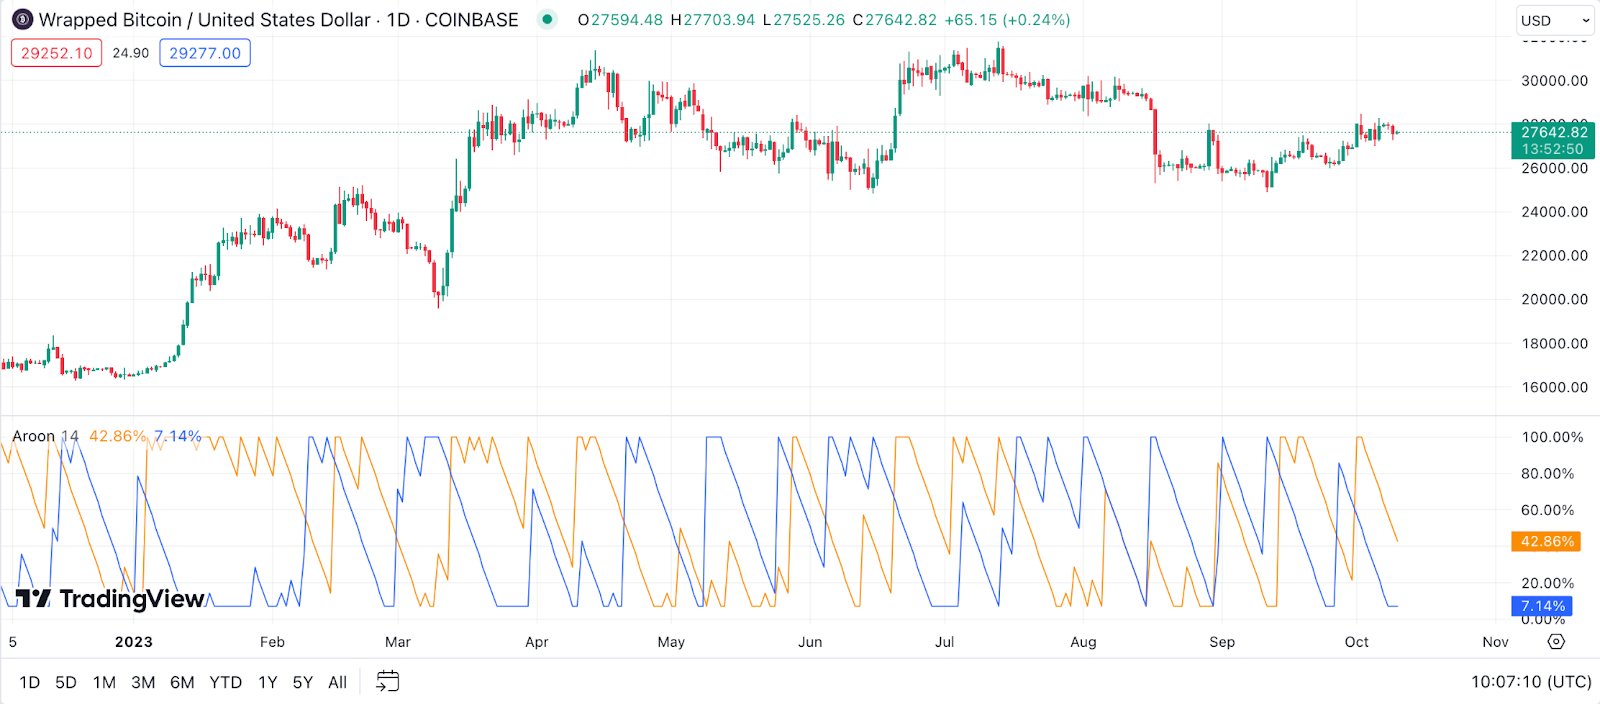
Example: Delving into the WBTC chart, you observe the Aroon Up line moving towards 100 while the Aroon Down line dips towards 0. This pattern indicates a strengthening bullish momentum for WBTC. Such a clear divergence between the two lines can be a strong hint for traders to potentially go long on their positions.
Gann Fan for Wrapped Bitcoin Price Prediction
The Gann Fan, derived from the methods of W.D. Gann, is a fascinating overlay of angular lines that helps in predicting support and resistance levels. Each line, termed a ‘Gann angle,’ represents a potential trend line.
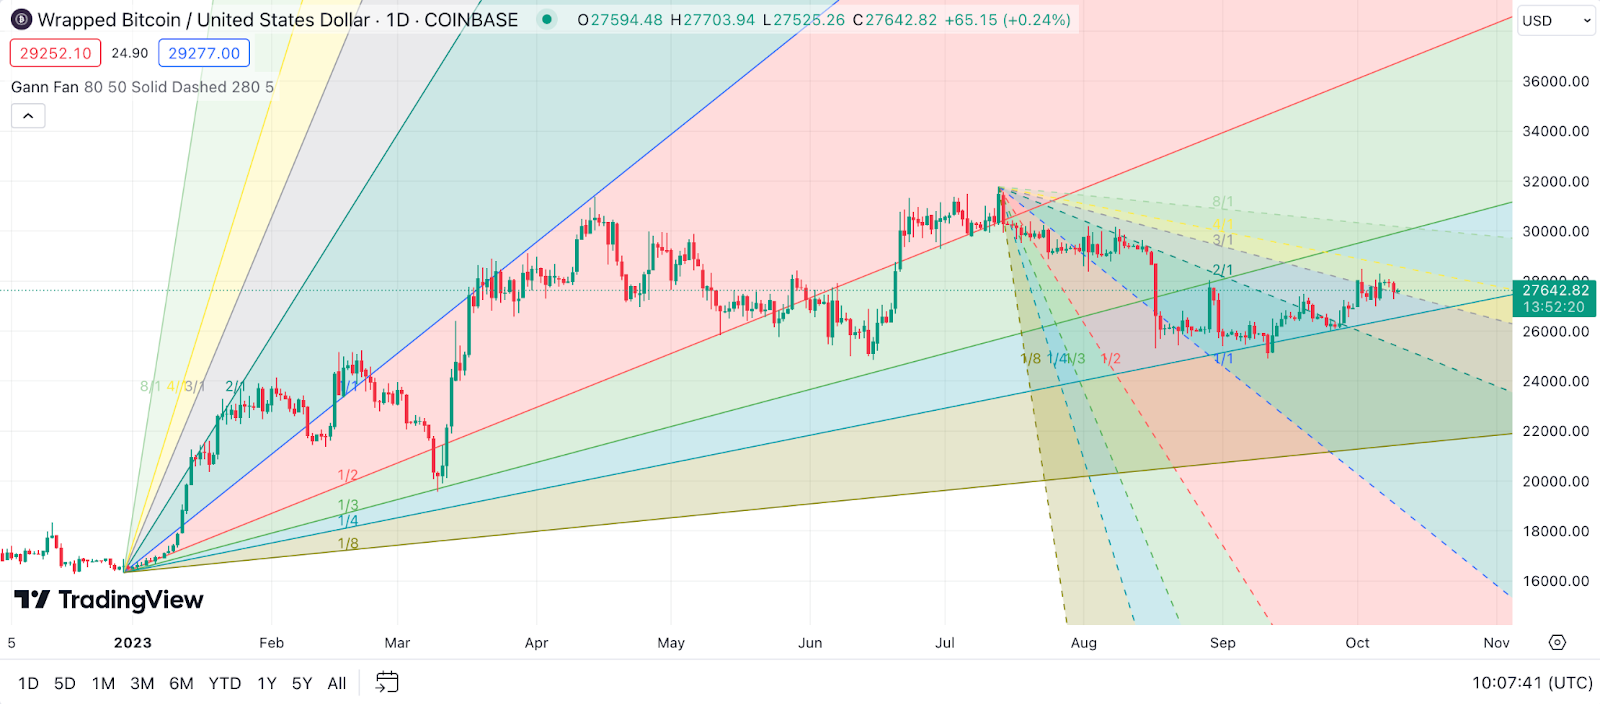
Example: After a significant price move in WBTC, you decide to employ the Gann Fan. As you plot the angles, you find that WBTC’s price is consistently bouncing off one of the Gann angles, treating it as a support line. This observation could guide traders to set their stop-loss or take-profit levels based on these angular support and resistance zones.
Keltner Channel for Wrapped Bitcoin Price Prediction
Keltner Channel, akin to Bollinger Bands, is a volatility-based envelope set above and below an exponential moving average. The width of the channel is determined by the Average True Range (ATR), providing insights into potential price breakouts.
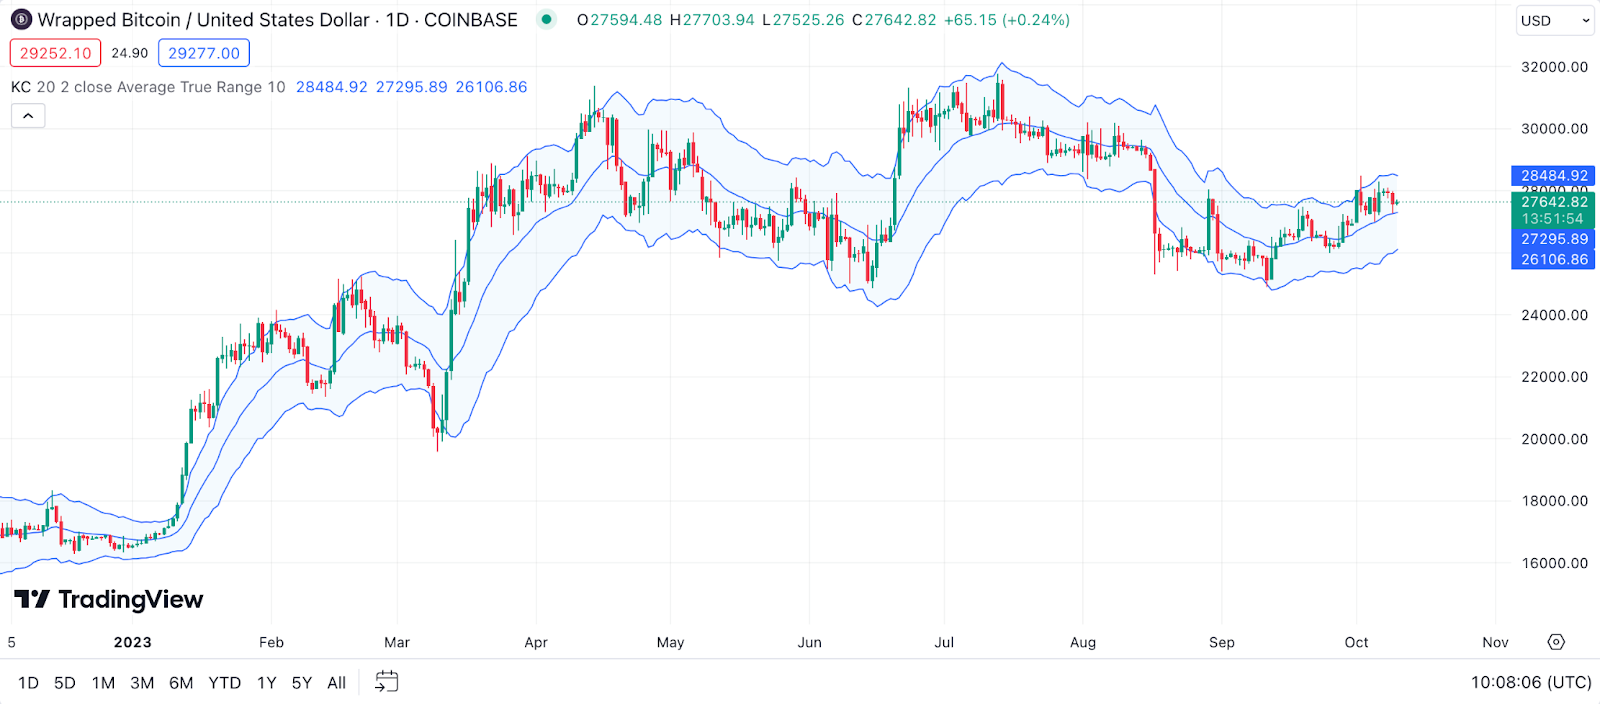
Example: On the WBTC chart, you notice the price touching the upper band of the Keltner Channel after a period of consolidation. This movement could suggest an upward price breakout. Conversely, if WBTC’s price starts hugging the lower band, it might indicate downward pressure.
Money Flow Index (MFI) for Wrapped Bitcoin Price Prediction
The Money Flow Index (MFI) is often dubbed the “volume-weighted RSI” because it integrates volume data, giving traders a richer perspective on buying and selling pressure. It oscillates between 0 and 100, and like the RSI, values above 80 are typically seen as overbought, while values below 20 are viewed as oversold.
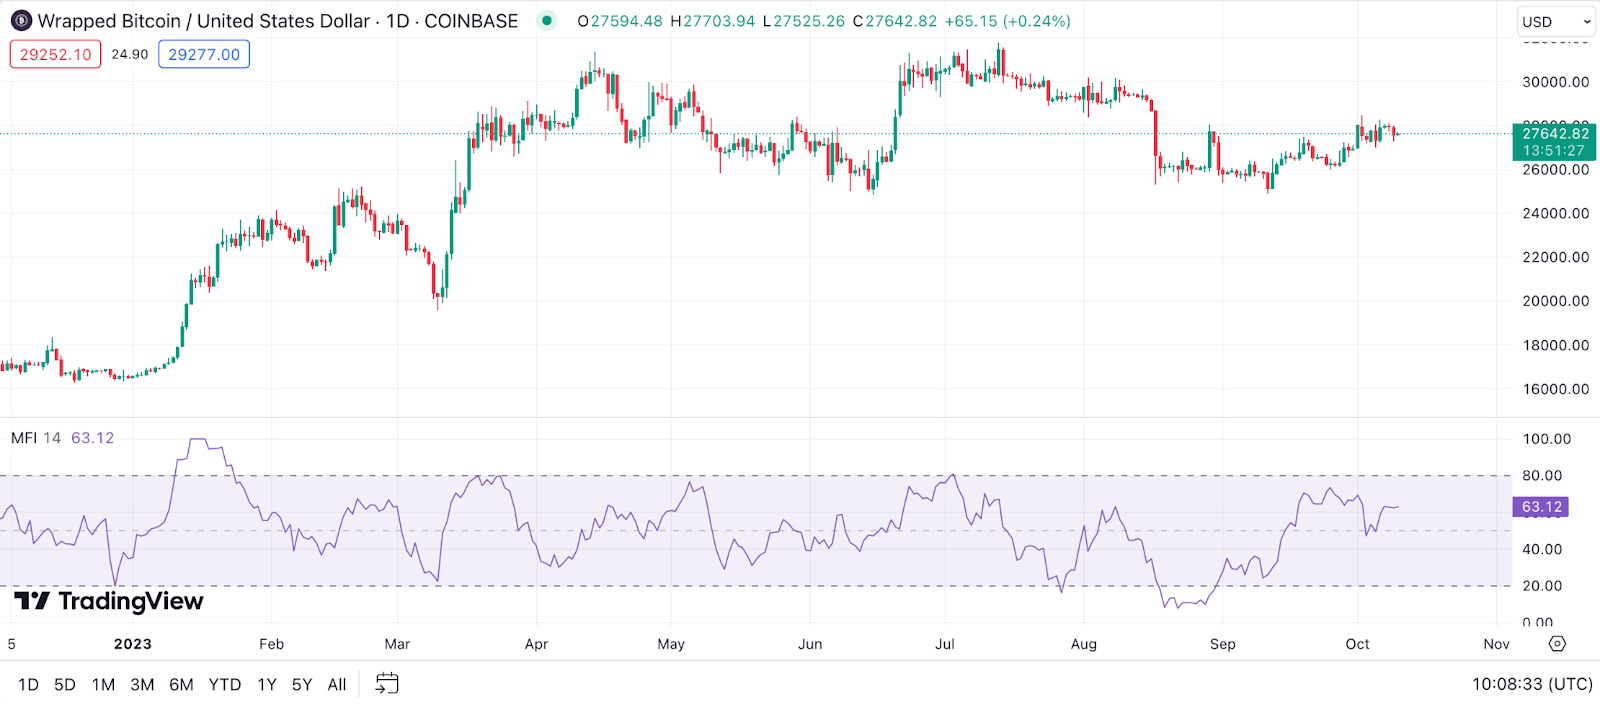
Example: While analyzing the WBTC chart, you spot the MFI breaching the 80 mark. This suggests that WBTC might be in an overbought territory, potentially indicating a pullback or price correction. But if you notice the MFI dipping below 20, it might hint that WBTC is oversold and could be ripe for a rebound.
TRIX for Wrapped Bitcoin Price Prediction
TRIX, which sounds like a charming magician’s name, is a momentum oscillator that displays the rate of change of a triple exponentially smoothed moving average. It’s designed to filter out minor price movements, thus showcasing the primary asset trends.
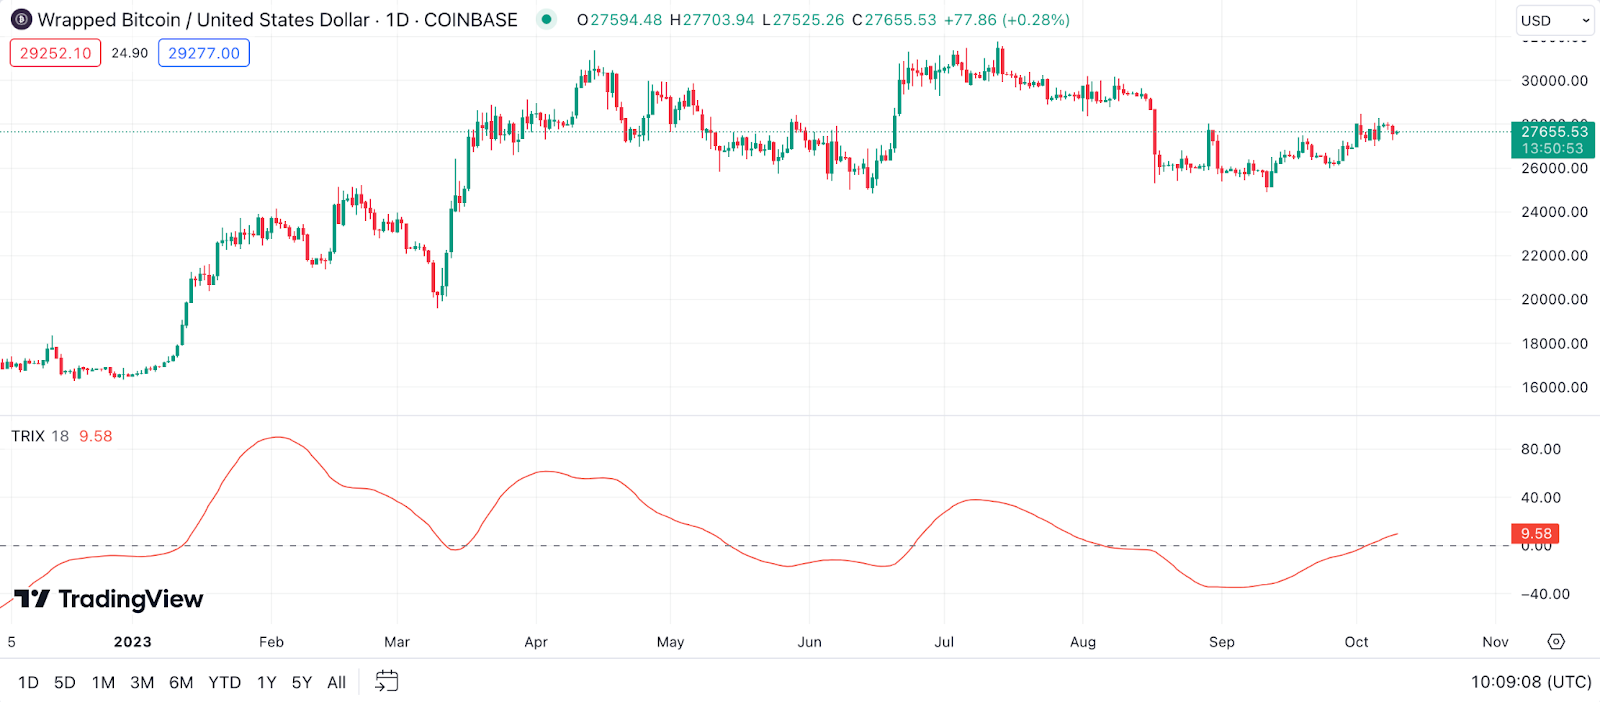
Example: Upon examining the WBTC chart, you observe the TRIX line crossing above its signal line and trending upwards. This could be seen as a bullish indication, signaling that the positive momentum of WBTC is accelerating. Conversely, a downward cross might indicate a potential bearish shift.
The Zig Zag indicator for Wrapped Bitcoin Price Prediction
The Zig Zag indicator, as playful as its name sounds, is serious business. It filters out price changes that are below a certain threshold, essentially focusing only on significant moves. This helps traders visualize the primary trends without being distracted by minor fluctuations.
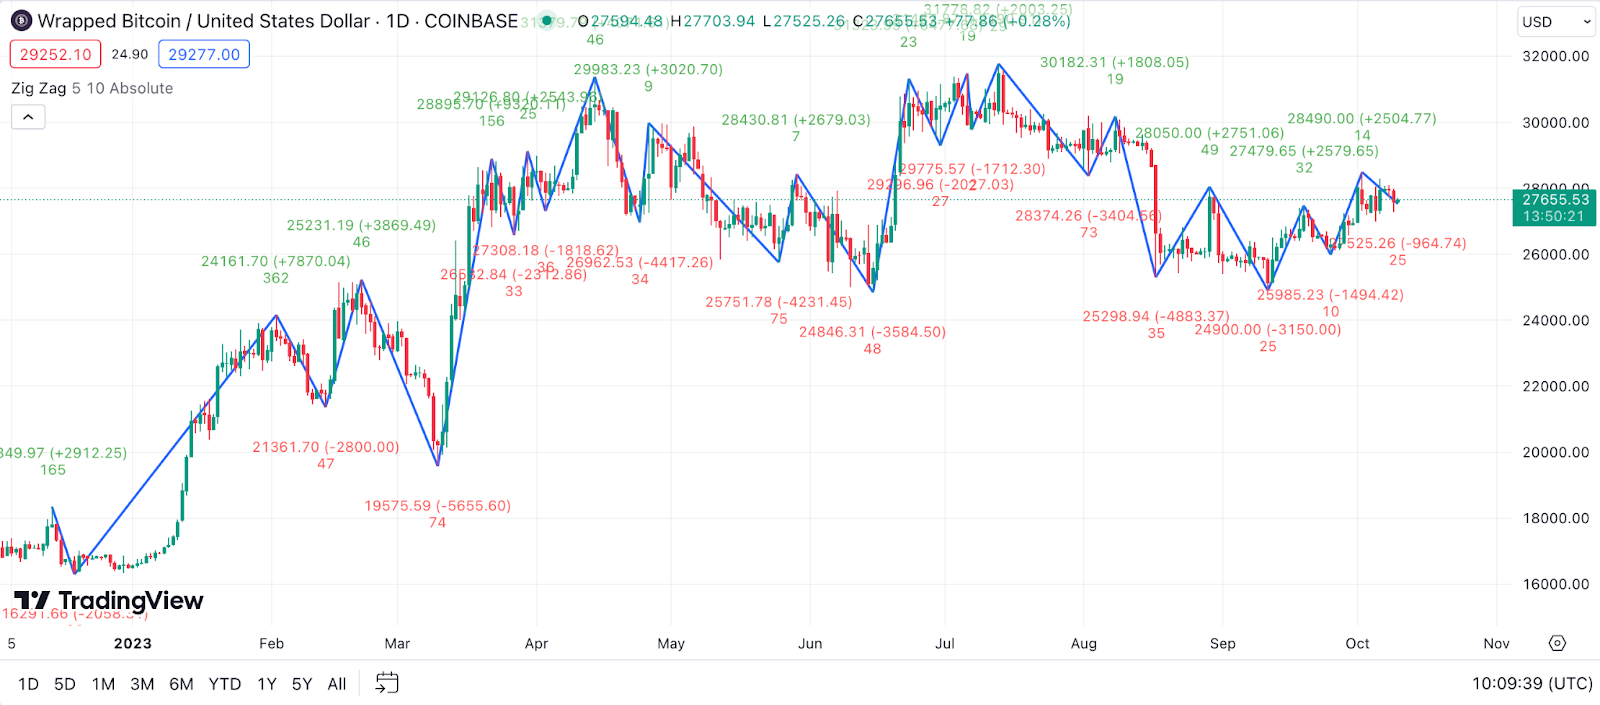
Example: As you gaze upon the WBTC chart, the Zig Zag lines make it apparent that there’s a consistent pattern of higher highs and higher lows, indicating an uptrend. Such visualization simplifies the identification of key support and resistance zones and can guide potential entry or exit points.
Detrended Price Oscillator (DPO) for Wrapped Bitcoin Price Prediction
The DPO, with its utilitarian approach, removes the longer-term trends, allowing traders to focus on short-term market cycles. By comparing the past price to a past moving average, it offers a glimpse into the peaks and troughs of price movement, independent of larger trends.
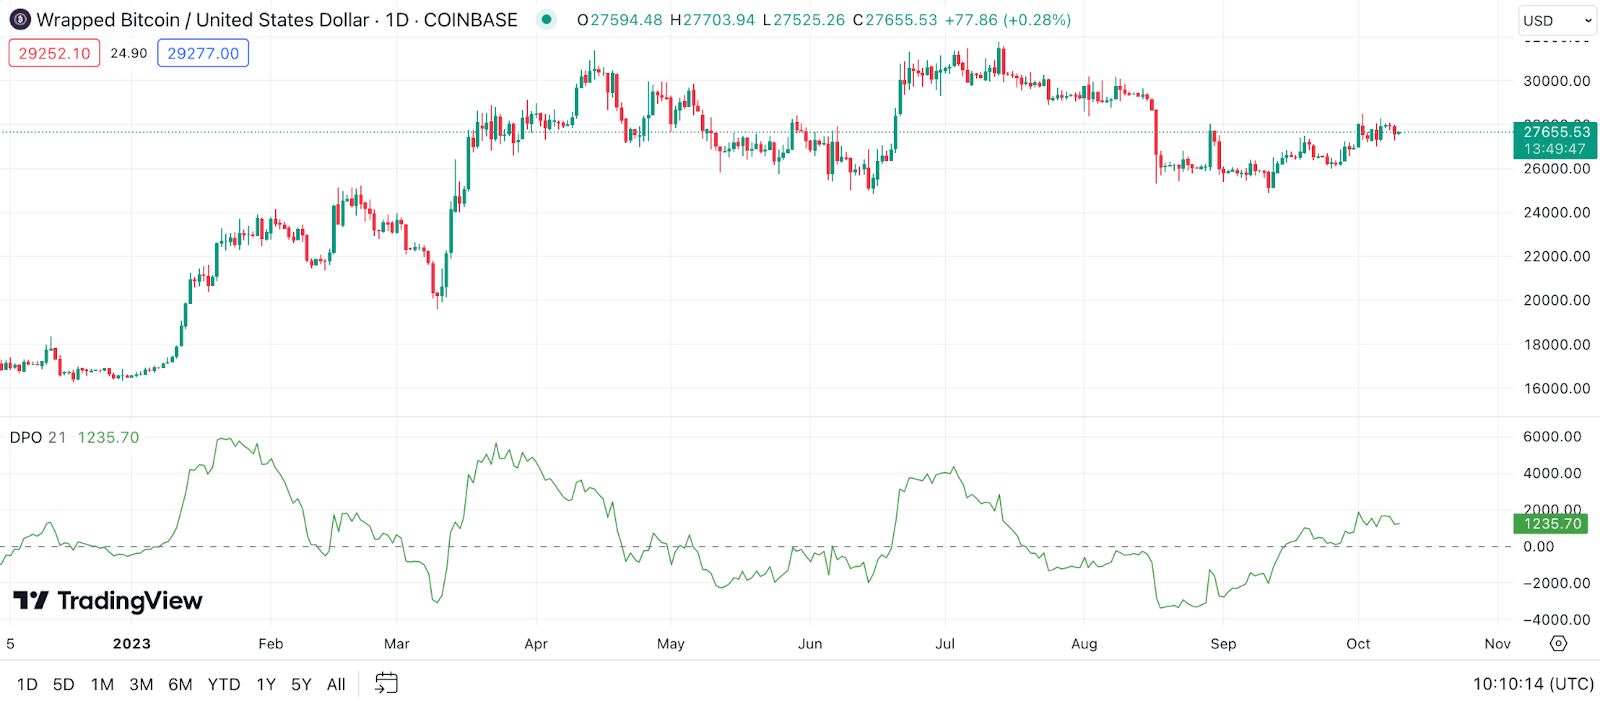
Example: As you comb through the WBTC chart, you notice that the DPO is exhibiting a pronounced peak. This might indicate a potential high in the short-term cycle, hinting at a transient bearish phase. But if the DPO forms a trough, it could signify a short-term bullish phase ahead.
Vortex Indicator (VI) for Wrapped Bitcoin Price Prediction
The Vortex Indicator, inspired by the natural flow and vortexes of water, assesses the strength of a trend by comparing high and low price ranges. The VI consists of two oscillating lines: VI+ and VI-, which represent bullish and bearish trend movements respectively.

Example: You’re perusing the WBTC charts and the VI+ line crosses above the VI- line. This crossover typically signals a potential bullish upswing. Conversely, if the VI- line rises above the VI+, it could be an omen of an impending bearish downturn.
Elder’s Force Index (EFI) for Wrapped Bitcoin Price Prediction
Developed by Dr. Alexander Elder, the EFI encapsulates price change, direction, and volume. It’s a powerful tool that can highlight potential reversals based on divergences between volume and price.

Example: On the WBTC chart, you discern that while the price is making higher highs, the EFI is making lower highs. This bearish divergence could imply that the bullish momentum might be losing steam and a price correction could be on the horizon.
Williams %R for Wrapped Bitcoin Price Prediction
The Williams %R, formulated by Larry Williams, is a momentum indicator akin to the Stochastic Oscillator. It measures the level of the close relative to the highest high for a specific period, usually 14 periods. By doing so, it offers insights into potential overbought or oversold conditions. The indicator fluctuates between 0 and -100, with values above -20 indicating overbought conditions and those below -80 suggesting oversold scenarios.
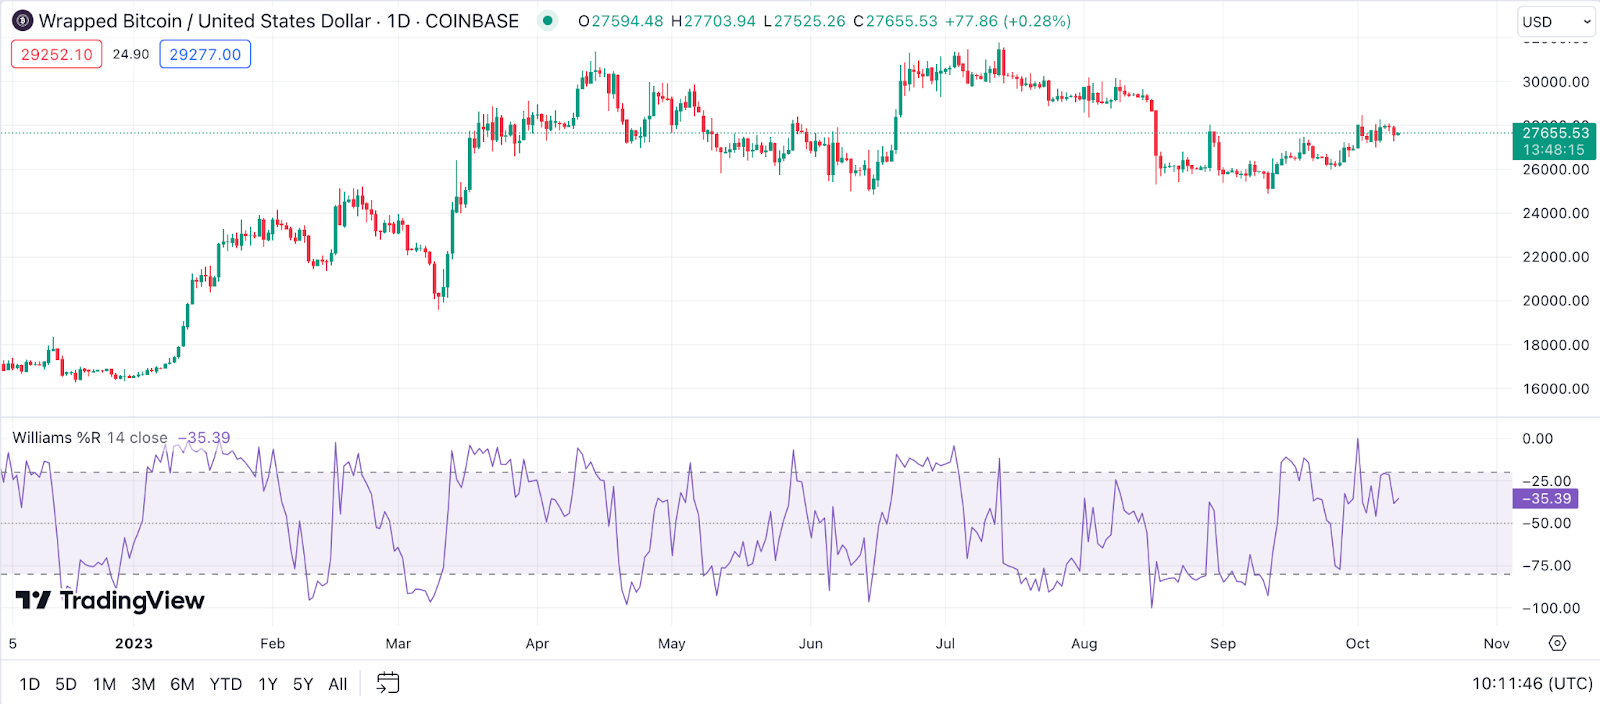
Example: As you navigate the labyrinthine WBTC chart, you spot the Williams %R swiftly ascending and breaching the -20 mark. This movement often suggests that WBTC might be in overbought territory, hinting at a potential price pullback. On the flip side, if you notice the Williams %R diving below -80, it might be an indication that WBTC is oversold, and a price bounce or upward reversal could be on the horizon.
Combining Technical Indicators for Accurate Wrapped Bitcoin Price Prediction
Navigating the crypto waters, especially for an asset as fascinating as Wrapped Bitcoin, can feel like deciphering an ancient map. Sure, each technical indicator is a compass or a landmark, but it’s the combination that helps us find the treasure. Let’s delve deeper into why combining these tools is our best bet.
The Importance of Using Multiple Technical Indicators
Imagine basing all your travel plans on just one review of a place. Risky, right? Similarly, in the world of trading, relying on a singular indicator is like putting all your eggs in one basket. Each indicator provides a unique perspective, illuminating a specific facet of the market. By using them in tandem, you’re not only cross-checking but also gaining a 360° view of the market landscape. It’s about painting a full picture, ensuring you’re not blindsided by unforeseen market swings.
How to Combine Various Indicators for a Comprehensive Analysis
Merging insights from different indicators can be a game-changer. But how do we go about it without getting overwhelmed? Here are some tips to effectively combine various technical indicators for a thorough analysis of WBTC price:
- Start Simple: Don’t dive deep into all indicators at once. Begin with two or three, understand them thoroughly, and then gradually expand your toolkit.
- Categorize Them: Group indicators based on what they measure—momentum, volume, trend, or volatility. This ensures you’re not just echoing the same data in different forms.
- Look for Confirmations: If multiple indicators suggest a bullish trend for WBTC, it strengthens the case. Similarly, contrasting indicators might suggest caution.
- Be Wary of Redundancy: Using too many similar indicators can skew perspectives. Remember, it’s about broadening horizons, not getting multiple views from the same window.
- Balance Leading and Lagging Indicators: While leading indicators predict future movements, lagging indicators confirm trends. A mix of both ensures proactive yet grounded decision-making.
- Stay Updated: The crypto realm is ever-evolving. Regularly update your knowledge on how each indicator functions, especially in the dynamic context of assets like WBTC.
Embarking on the journey of crypto trading, equipped with a holistic set of indicators, ensures you’re not just going by gut feel or narrowly focused views. The crypto market can be tumultuous, and while no strategy guarantees success, an informed approach based on combined insights always has the edge.
The Pillars of Wrapped Bitcoin Prediction: Fundamental Factors
Beyond the cryptic curves and patterns of technical analysis, there’s a realm governed by the tangible and real-world phenomena that shape the destiny of cryptos, Wrapped Bitcoin (WBTC) included. This realm, my fellow crypto enthusiast, is that of fundamental analysis. Let’s dive into the pillars that hold up this world.
Adoption Rate
A crypto’s heartbeat can be felt through its adoption rate. For Wrapped Bitcoin (WBTC), as with other cryptocurrencies, its vitality and long-term viability are directly correlated to its user base and the ecosystem’s integration.
As the world steadily moves towards decentralized financial systems, the adoption rate of assets like WBTC can act as the bridge between traditional finance and the new-age decentralized frontier. But, how do we gauge this bridge’s strength? Here are some key metrics:
- Wallet Growth: It’s always enlightening to monitor the number of new WBTC wallets springing into existence. This often indicates a growing interest in holding or transacting in WBTC.
- Transaction Volume: A rise in the daily or monthly WBTC transactions is a straightforward indicator of its growing usage. More transactions typically translate to greater adoption.
- Active Addresses: If more addresses are holding and transacting WBTC daily, it’s a solid sign of an active and engaged user base.
- Exchange Listings: The breadth of exchanges where WBTC is listed and actively traded can be a thermometer for its popularity. More listings often suggest wider adoption.
- Partnerships and Collaborations: Whenever WBTC enters new partnerships or collaborations, especially with notable players in the financial or tech sectors, it can exponentially boost its reach and adoption.
- Community Engagement: A thriving community around WBTC on platforms like Discord, Telegram, or dedicated forums is often an underappreciated metric. Their fervor, discussions, and grassroots initiatives can drive adoption at the ground level.
- Integration into DeFi Platforms: WBTC’s nature makes it a prime candidate for integration into burgeoning DeFi platforms. Its presence and utility in these platforms can be a strong indicator of its adoption.
- Merchant Acceptance: As more online and brick-and-mortar merchants begin to accept WBTC as a form of payment, it further solidifies its place in the real-world economy.
- Educational Initiatives: Efforts by the community or institutions to educate the masses about WBTC, through webinars, courses, or workshops, can accelerate its adoption. After all, people tend to adopt what they understand.
Understanding WBTC’s adoption nuances can be a treasure trove of insights. It not only offers a macro view of its place in the crypto ecosystem but also helps in anticipating its future trajectory.
Regulatory Developments
In the cryptocurrency world, the winds of regulatory change can be both gentle breezes of prosperity and gales of adversity. While technical indicators offer a look into a coin’s intrinsic value and momentum, it’s the regulations that often shape the broader landscape in which a coin operates.
With WBTC’s unique positioning, straddling the realms of Bitcoin and Ethereum, it’s particularly susceptible to regulatory developments affecting either ecosystem. Here’s an expanded look into some possible regulatory changes and their potential ripple effects:
- Positive Recognition: Regulatory bodies in influential economies granting legal status or otherwise recognizing WBTC could boost its global adoption and legitimacy, propelling its price.
- Taxation Policies: Governments introducing favorable tax policies for crypto transactions could drive more traders and investors towards assets like WBTC. Conversely, stringent taxation might deter potential users.
- Cross-Border Transactions: Simplification of rules and regulations surrounding cross-border transactions using WBTC could revolutionize global trade and finance.
- Security Protocols: While stringent security measures might initially slow down adoption, they can establish long-term trust, giving users confidence in WBTC’s longevity.
- Decentralization Challenges: Any government-led initiatives trying to centralize or exert control over WBTC could be met with resistance, potentially affecting its value.
- Trading Restrictions: Imposing or even the threat of bans and trading restrictions can significantly influence WBTC’s liquidity and price. Alternatively, a loosening of restrictions could foster a bullish environment.
- Integration in Banking Systems: Regulatory clearance for WBTC to be integrated into mainstream banking operations, even in a limited capacity, could be monumental for its price and adoption.
- Licensing of Platforms: Regulatory frameworks that grant licenses to platforms using WBTC can bolster its image as a safe and legitimate asset.
- Anti-Money Laundering (AML) and Know Your Customer (KYC) Regulations: An increase in AML and KYC compliance could initially hamper rapid WBTC adoption, but it also has the potential to foster a more stable and trusted environment.
- Consumer Protection Initiatives: If regulatory bodies introduce measures to protect WBTC users against fraud, scams, or potential loss, it could increase WBTC’s attractiveness to new and cautious investors.
Remember, in the world of crypto, regulatory news can often move markets faster than technical developments.
Utility
At the heart of any cryptocurrency’s value and long-term potential is its utility. While speculations and market sentiments can significantly influence a crypto’s price, it’s the tangible, real-world applications and use cases that dictate its long-term sustainability and relevance. WBTC, with its unique construct and bridge-like function between Bitcoin and Ethereum, carries an arsenal of utilities. Here’s a deeper exploration:
- Collateral in DeFi Platforms: Beyond its common use, the ability of WBTC to serve as collateral for decentralized loans amplifies its integration into the DeFi realm, adding liquidity and versatility to various platforms.
- Cross-Chain Interoperability: Its unique nature as a tokenized version of Bitcoin on the Ethereum blockchain empowers WBTC to act as a vital bridge, facilitating interactions and value transfers between two of the largest crypto ecosystems.
- Payment for Services: With the rise of crypto-centric services and platforms, WBTC, given its increasing recognition, can serve as a preferred mode of payment, from online marketplaces to even some brick-and-mortar establishments.
- Liquidity Provision: Decentralized exchanges and platforms benefit immensely from WBTC’s liquidity provision, ensuring smoother trades and better price stability.
- Staking and Yield Farming: Certain platforms and protocols allow users to leverage their WBTC holdings for staking or yield farming, enabling them to earn rewards and increase their holdings.
- Wrapped Asset Development Inspiration: WBTC has been a pioneer, serving as a blueprint for other wrapped assets, extending the realm of possibilities within the Ethereum ecosystem.
- Institutional Investment Vehicle: Given its direct ties to Bitcoin’s value, WBTC becomes an enticing option for institutional investors looking to have exposure to Bitcoin’s value proposition while leveraging Ethereum’s smart contract functionalities.
- Enhanced Security Protocols: Being on the Ethereum network, WBTC can leverage its robust security protocols, thereby benefiting from reduced transaction vulnerabilities.
- Decentralized Applications (dApps) Integration: WBTC’s compatibility with Ethereum means it can be integrated seamlessly into various dApps, from gaming platforms to financial applications, broadening its utility spectrum.
- Smart Contract Execution: For contracts that require Bitcoin as payment, WBTC can act as a stand-in, allowing the decentralized execution of agreements while still essentially dealing in Bitcoin’s value.
Understanding and appreciating WBTC’s multifaceted utility is crucial in gauging its potential in the ever-evolving crypto landscape. It’s not just about price peaks and troughs; it’s about understanding the underlying value it brings to the table.
Market Sentiment: How WBTC News Prediction Works
Market sentiment is the intangible, often elusive force that can sway the tide for any asset, including Wrapped Bitcoin. It’s a collective emotion, a sum of all fears, expectations, and excitement of traders, holders, and even bystanders. And in the rapid-paced world of cryptocurrency, understanding these sentiments can provide traders with a crucial edge. But how exactly does one gauge this ephemeral emotion, especially when it comes to WBTC? Let’s explore deeper:
- Crypto Media Outlets: Websites and media channels dedicated to cryptocurrency news can often be the first to report significant developments. Regular monitoring of these outlets can provide early indications of emerging trends or sentiments.
- Influencer Opinions and Analyses: The cryptocurrency world has its fair share of influencers and thought leaders. Keeping a tab on their opinions, especially when they opine about WBTC, can offer valuable sentiment insights.
- Dedicated Forums and Social Media Channels: Communities built around WBTC on platforms like Reddit, Telegram, or even Twitter, buzz with user-generated content. These platforms can be sentiment goldmines, capturing real-time reactions to market movements.
- Academic Publications and Whitepapers: Periodic research papers or studies focused on WBTC, or even cryptocurrencies at large, can offer a more analytical perspective on market sentiments and predictions.
- Public Perception Surveys: Occasionally, organizations conduct perception surveys that gauge public sentiment about various cryptocurrencies. These surveys can offer a structured understanding of prevailing market emotions.
- Sentiment Analysis Tools: In our digital age, several tools utilize AI and machine learning to analyze vast amounts of web content to derive sentiment scores for various assets, including WBTC.
- Events, Conferences, and Webinars: Industry gatherings, whether virtual or physical, can significantly influence sentiments. Keynote addresses, panel discussions, or even sideline conversations can offer cues on the direction in which the wind is blowing.
- Adoption Announcements: News of significant platforms or financial institutions adopting or integrating WBTC can sway sentiment overnight. These are pivotal moments that can redefine market dynamics.
- Global News and Macro Events: Broader events, from geopolitical tensions to major economic announcements, can indirectly impact WBTC sentiment. A global financial crisis or regulatory changes in major economies can ripple through the crypto markets.
Decoding market sentiment is as much an art as it is a science. In the labyrinthine corridors of cryptocurrency trading, the lights of sentiment can guide us through foggy paths, offering clarity amidst chaos. So, always keep your ears to the ground, your eyes on the horizon, and your intuition sharp.
The Bottom Line: Making Your Own Wrapped Bitcoin Price Predictions
In our deep dive into the realm of Wrapped Bitcoin Price Prediction, we’ve journeyed through the meticulous world of technical analysis, weighed the tangible pillars of fundamental factors, and sought insights from the wizards of crypto – the expert voices echoing in the vast chambers of the digital currency universe. Every chart, every sentiment, every expert view offers us a piece of the intricate puzzle that is WBTC’s future.
But remember dear reader, in the ever-turbulent seas of cryptocurrency, no compass is infallible. Equip yourself with knowledge, trust your instincts, and chart your own unique path. May the winds of fortune guide your sails in the exhilarating voyage of crypto trading. Until our next adventure!
FAQ
When Will Wrapped Bitcoin Go Up?
Ah, the age-old question of timing in the crypto world! Predicting the exact moment WBTC or any cryptocurrency will rise is a blend of art and science. Factors like market sentiment, global economic indicators, and unforeseen news can all play a part. Stay updated with the latest trends, and remember, the market can be as unpredictable as it is rewarding!
Should I Buy Wrapped Bitcoin?
Well, my friend, that’s a decision only you can make, based on your risk appetite, financial goals, and market research. WBTC has shown promise and has its perks, especially with its unique bridge-like function. Dive deep into both its technical and fundamental aspects, and always consult with financial experts if in doubt!
How High Can Wrapped Bitcoin Go?
The sky’s the limit, or is it? The potential of WBTC is vast, given its ties to both Bitcoin and Ethereum ecosystems. But predicting a precise peak is tricky. Historical data, expert opinions, and market momentum can offer some guidance, but always be prepared for the unexpected twists and turns of the crypto roller coaster!
Will Wrapped Bitcoin Crash Again in 2024?
The crypto market is known for its volatility, and while WBTC has its strengths, it’s not immune to market fluctuations. While we’ve analyzed trends and expert opinions, unforeseen events or shifts in global sentiment can influence outcomes. Diversify, strategize, and keep an eye out for red flags, but also remember – every dip might be a good opportunity.