
Hello, fellow blockchain enthusiasts and THETA investors! Welcome to our in-depth piece on the Theta Network price prediction. We’re going to embark on a fascinating journey today, a foray into the world of THETA’s past, its origin, and its purpose. This trip is not just about learning history though. It’s about the future. We’ll get our hands dirty with some of the tools and techniques that traders wield like magic wands to forecast THETA’s value.
Yes, predicting the price trajectory of any cryptocurrency is no small task, especially when it comes to THETA. It’s like trying to read the future in a swirling crystal ball, full of complex data patterns and market trends. But that’s the thrill of it, isn’t it? The uncertainty, the potential, and the reward of solving the enigma.
And you may ask, why should we bother predicting the price of THETA? Simply put, THETA is not just another coin on the blockchain technology. It’s a key player in the decentralization of video streaming, a field that’s growing at an incredible pace. Its value reflects the potential of this innovative technology, and understanding where it might head can guide our investment decisions, preparing us for opportunities and risks ahead.
So, ready to unravel the mystery of THETA’s future value? Ready to dive into the labyrinth of data, trends, and expert opinions, to see the potential lying beneath? If your answer is a resounding ‘yes’, then you’re in the right place. Buckle up, and let’s delve deeper into this enthralling analysis. The adventure starts right here, right now. Read on!
Theta Network (THETA) Overview
| THETA Price | $0.69 |
| THETA Price Change 24h | -0.01% |
| THETA Price Change 7d | 2.07% |
| THETA Market Cap | $689,020,849.75 |
| THETA Circulation Supply | 1,000,000,000.00 |
| THETA Trading Volume | $11,159,266.33 |
| THETA All-Time High (ATH) | $15.90 |
| THETA All-Time Low (ATL) | $0.03977 |
A Brief History: Theta Network and Its Purpose
So, you want to get to know Theta Network better, eh? Excellent! Strap in, folks, as we take a brief detour into the origins of this revolutionary platform and what it stands for.
Theta Network was born out of an idea. An idea to disrupt the centralized video streaming industry. It sprung to life in 2018, conceived by Sliver.tv, a VR live streaming company. The founding team saw a looming issue in the video streaming space – low-quality streams, high load times, and skyrocketing content delivery costs. They envisioned a decentralized network where users share their excess bandwidth and resources to improve video streaming quality and reach. And thus, Theta blockchain was born. The underpinning governance token, the THETA coin, is used as an incentive for these users who contribute their resources.
Now, let’s shift our focus to the rollercoaster ride that is the THETA price history. One could say it’s a saga in itself, full of highs and lows. Here’s an overview of some of the most remarkable price fluctuations:
- The Initial Jump: After being relatively stable for about two years, THETA token made its first significant leap in price in December 2020.
- The Peak of 2021: Come 2021, and THETA cryptocurrency hit the highest price in March, making it one of the top gainers of the year.
- The Mid-year Slump: However, by June 2021, like many other cryptocurrencies, THETA crypto coins had slumped significantly.
- Late 2021 Stability: Towards the end of the year, the price started to stabilize, showing promise for future growth.
Theta Network – THETA Price Prediction For Today, Tomorrow, This Week, Next Week, and Next 30 Days
| Date | Price | Change |
|---|---|---|
| July 06, 2025 | 0.69 | -0.49% |
| July 07, 2025 | 0.69 | 0.80% |
| July 08, 2025 | 0.70 | 0.70% |
| July 09, 2025 | 0.70 | 0.94% |
| July 10, 2025 | 0.70 | -0.01% |
| July 11, 2025 | 0.70 | -0.16% |
| July 12, 2025 | 0.70 | -0.10% |
| July 13, 2025 | 0.70 | -0.76% |
| July 14, 2025 | 0.69 | -0.74% |
| July 15, 2025 | 0.69 | 0.45% |
| July 16, 2025 | 0.69 | 0.05% |
| July 17, 2025 | 0.70 | 0.45% |
| July 18, 2025 | 0.70 | 0.88% |
| July 19, 2025 | 0.70 | -0.95% |
| July 20, 2025 | 0.70 | 0.25% |
| July 21, 2025 | 0.71 | 0.90% |
| July 22, 2025 | 0.70 | -0.98% |
| July 23, 2025 | 0.71 | 0.97% |
| July 24, 2025 | 0.71 | 0.49% |
| July 25, 2025 | 0.71 | 0.50% |
| July 26, 2025 | 0.71 | -0.85% |
| July 27, 2025 | 0.70 | -0.26% |
| July 28, 2025 | 0.70 | -0.57% |
| July 29, 2025 | 0.70 | -0.30% |
| July 30, 2025 | 0.70 | 0.33% |
| July 31, 2025 | 0.70 | 0.03% |
| August 01, 2025 | 0.70 | -0.42% |
| August 02, 2025 | 0.69 | -0.55% |
| August 03, 2025 | 0.69 | 0.11% |
| August 04, 2025 | 0.70 | 0.60% |
Theta Network Price Prediction 2024
After analyzing THETA price prediction 2024, we found that the projected minimum price is $0.62, while the average and maximum prices are $0.72 and $0.83, respectively.
Our assessment of future returns based on this data suggests that THETA price prediction 2024 is relatively stable, with moderate growth expected.
The narrow price range implies that the market may not anticipate significant fluctuations in value, but there is still potential for substantial returns for those willing to take on high risks associated with investing in THETA.
Nonetheless, cryptocurrency investors must be cautious and carry out thorough research before making any investment decisions in this space due to the historical volatility of cryptocurrencies and the continuously evolving market landscape.
| Month | Minimum Price | Average Price | Maximum Price |
|---|---|---|---|
| February 2024 | 1.03 | 1.07 | 1.11 |
| March 2024 | 1.06 | 1.10 | 1.14 |
| April 2024 | 1.08 | 1.13 | 1.17 |
| May 2024 | 1.11 | 1.16 | 1.20 |
| June 2024 | 1.14 | 1.19 | 1.24 |
| July 2024 | 1.18 | 1.22 | 1.27 |
| August 2024 | 1.21 | 1.25 | 1.30 |
| September 2024 | 1.24 | 1.29 | 1.34 |
| October 2024 | 1.27 | 1.32 | 1.38 |
| November 2024 | 1.31 | 1.36 | 1.41 |
| December 2024 | 1.34 | 1.39 | 1.45 |
| January 2025 | 1.38 | 1.43 | 1.49 |
January 2024: Theta Network Price Forecast
As we embark on a new year, the forecasting models suggest a sturdy beginning for Theta Network with a minimal price of $0.95, an average hovering around $1.03, and a potential spike to a maximum price of $1.07. This indicates a bullish outset for investors, suggesting that Theta Network’s fundamentals are gaining solid ground within the crypto community.
THETA Price Forecast for February 2024
As we ventured into February, the price of Theta Network exhibited a promising uptrend. Crypto enthusiasts observed a minimum price of $1.03, with a steady climb to an average price of $1.07, peaking at a maximum price of $1.11. This growth trajectory indicated a burgeoning confidence among investors in Theta’s potential as a leading video streaming blockchain.
March 2024: Theta Network Price Forecast
March saw Theta Network continue its ascent in the crypto market, with a minimum price of $1.06 that suggested a robust support level. The average price edged up to $1.10, reinforcing investor optimism, while the maximum price of $1.14 signaled a growing appetite for risk among traders looking to capitalize on Theta’s innovative edge.
THETA Price Forecast for April 2024
Entering April, Theta Network’s price predictions pointed to a persistent upward movement. The minimum price inched upwards to $1.08, and the market’s sustained interest pushed the average price to $1.13. The maximum price reached $1.17, indicating a bullish sentiment that Theta’s technology was increasingly gaining traction.
May 2024: Theta Network Price Forecast
May’s forecasts for Theta Network were marked by steady gains, with the minimum price reaching $1.11. The average price climbed to a confident $1.16, as the platform’s enhancements in streaming quality likely captured the market’s attention. A maximum price of $1.20 suggested that investors were closely watching Theta’s partnerships and tech rollouts.
THETA Price Forecast for June 2024
June’s outlook for Theta Network was buoyant, with the minimum price moving up to $1.14. This progression reflected a consistent trust in Theta’s market position, and with the average price hitting $1.19, it was clear that the network’s user growth was translating into investor gains. The maximum price of $1.24 was a nod to the enthusiastic trading within the community.
July 2024: Theta Network Price Forecast
By July, Theta Network’s price predictions indicated a resilient uptrend, marked by a minimum price of $1.18. The average price ascended to $1.22, likely due to Theta’s expanding use cases in decentralized finance. The maximum price of $1.27 reflected peak interest, hinting at speculative movements tied to key network updates.
THETA Price Forecast for August 2024
In August, the Theta Network’s forecast showed no signs of slowing, with a minimum price of $1.21. As the average price reached $1.25, it appeared that Theta’s innovations were being acknowledged, possibly related to strategic partnerships or technological breakthroughs. The maximum price hit $1.30, a level that hinted at a bullish run fueled by positive sentiment.
September 2024: Theta Network Price Forecast
Come September, the price forecast for Theta Network was robust, with the minimum price at $1.24. The average price was now $1.29, indicating a solidifying position in the market. A maximum price of $1.34 suggested that the network was possibly on the cusp of announcing major developments or integrations.
THETA Price Forecast for October 2024
Theta Network’s performance in October suggested an unyielding growth trend, with a minimum price of $1.27. The average price of $1.32 reflected a market that was eagerly anticipating Theta’s next move. The maximum price reached $1.38, possibly due to rumors or leaks of upcoming innovations within the Theta ecosystem.
November 2024: Theta Network Price Forecast
As the year neared its close, Theta Network’s price forecast for November showed a steadfast uptick, with a minimum price of $1.31. The average price pushed upwards to $1.36, potentially as a result of the network’s end-of-year summaries highlighting key achievements and milestones. The maximum price of $1.41 pointed to market excitement for what 2025 would bring for Theta.
THETA Price Forecast for December 2024
In December, Theta Network’s price trajectory capped off the year on a high note, with the minimum price reaching $1.34. The average price climbed to $1.39, likely reflecting year-end consolidations and the anticipation of new year strategies. The maximum price of $1.45 showcased the optimism surrounding Theta’s role in the upcoming year’s crypto ecosystem.
Theta Network Price Prediction 2025
Moving forward to 2025, our THETA price prediction indicate a potential upswing. We could see a minimum price of $1.2, and an average price likely around $1.42. And, if all things align, we may witness a maximum THETA price hitting $1.69.
| Month | Minimum Price | Average Price | Maximum Price |
|---|---|---|---|
| February 2025 | 1.20 | 1.24 | 1.29 |
| March 2025 | 1.23 | 1.28 | 1.33 |
| April 2025 | 1.26 | 1.31 | 1.36 |
| May 2025 | 1.30 | 1.35 | 1.40 |
| June 2025 | 1.33 | 1.38 | 1.44 |
| July 2025 | 1.37 | 1.42 | 1.48 |
| August 2025 | 1.40 | 1.46 | 1.52 |
| September 2025 | 1.44 | 1.50 | 1.56 |
| October 2025 | 1.48 | 1.54 | 1.60 |
| November 2025 | 1.52 | 1.58 | 1.64 |
| December 2025 | 1.56 | 1.62 | 1.69 |
| January 2026 | 1.60 | 1.67 | 1.73 |
Theta Network Price Prediction 2026
In the year 2026, we predict THETA’s value continuing to trend positively. Expect to see a minimum price of around $1.45, with an average price of $1.72. The stars might align for a maximum price reaching up to $2.05.
| Month | Minimum Price | Average Price | Maximum Price |
|---|---|---|---|
| February 2026 | 1.45 | 1.51 | 1.57 |
| March 2026 | 1.49 | 1.55 | 1.61 |
| April 2026 | 1.53 | 1.59 | 1.66 |
| May 2026 | 1.57 | 1.64 | 1.70 |
| June 2026 | 1.62 | 1.68 | 1.75 |
| July 2026 | 1.66 | 1.72 | 1.80 |
| August 2026 | 1.71 | 1.77 | 1.84 |
| September 2026 | 1.75 | 1.82 | 1.89 |
| October 2026 | 1.80 | 1.87 | 1.94 |
| November 2026 | 1.85 | 1.92 | 2.00 |
| December 2026 | 1.90 | 1.97 | 2.05 |
| January 2027 | 1.95 | 2.02 | 2.11 |
Theta Network Price Prediction 2027
As we gaze into our crystal ball for 2027, our THETA price prediction present a minimum price of $1.93. With an average price potentially hitting $2.29, we might see the maximum price soar to a whopping $2.72.
| Month | Minimum Price | Average Price | Maximum Price |
|---|---|---|---|
| February 2027 | 1.93 | 2.00 | 2.08 |
| March 2027 | 1.98 | 2.06 | 2.14 |
| April 2027 | 2.03 | 2.11 | 2.20 |
| May 2027 | 2.09 | 2.17 | 2.26 |
| June 2027 | 2.15 | 2.23 | 2.32 |
| July 2027 | 2.20 | 2.29 | 2.38 |
| August 2027 | 2.26 | 2.35 | 2.45 |
| September 2027 | 2.32 | 2.41 | 2.51 |
| October 2027 | 2.39 | 2.48 | 2.58 |
| November 2027 | 2.45 | 2.55 | 2.65 |
| December 2027 | 2.52 | 2.61 | 2.72 |
| January 2028 | 2.59 | 2.68 | 2.79 |
Theta Network Price Prediction 2028
Navigating through the crypto cosmos, we reach 2028. Our THETA price prediction foresees a minimum THETA price of $2.56. With a predicted average price of $3.04, there’s a chance we could witness a maximum price of $3.61.
| Month | Minimum Price | Average Price | Maximum Price |
|---|---|---|---|
| February 2028 | 2.56 | 2.66 | 2.77 |
| March 2028 | 2.63 | 2.73 | 2.84 |
| April 2028 | 2.70 | 2.81 | 2.92 |
| May 2028 | 2.77 | 2.88 | 3.00 |
| June 2028 | 2.85 | 2.96 | 3.08 |
| July 2028 | 2.93 | 3.04 | 3.16 |
| August 2028 | 3.01 | 3.12 | 3.25 |
| September 2028 | 3.09 | 3.21 | 3.34 |
| October 2028 | 3.17 | 3.29 | 3.43 |
| November 2028 | 3.26 | 3.38 | 3.52 |
| December 2028 | 3.34 | 3.47 | 3.61 |
| January 2029 | 3.43 | 3.57 | 3.71 |
Theta Network Price Prediction 2029
Accelerating forward to 2029, our experts anticipate a minimum price of $3.39. The average price could be around $4.02, with the potential to reach a maximum value of $4.79.
| Month | Minimum Price | Average Price | Maximum Price |
|---|---|---|---|
| February 2029 | 3.39 | 3.52 | 3.67 |
| March 2029 | 3.48 | 3.62 | 3.77 |
| April 2029 | 3.58 | 3.72 | 3.87 |
| May 2029 | 3.67 | 3.82 | 3.97 |
| June 2029 | 3.77 | 3.92 | 4.08 |
| July 2029 | 3.88 | 4.02 | 4.19 |
| August 2029 | 3.98 | 4.13 | 4.30 |
| September 2029 | 4.09 | 4.24 | 4.42 |
| October 2029 | 4.20 | 4.36 | 4.54 |
| November 2029 | 4.31 | 4.48 | 4.66 |
| December 2029 | 4.43 | 4.60 | 4.79 |
| January 2030 | 4.55 | 4.72 | 4.92 |
Theta Network Price Prediction 2030
As we look to 2030, the THETA price prediction remain bullish. We foresee a minimum price of $4.5, an average price around $5.34, and a maximum price that might reach as high as $6.35.
| Month | Minimum Price | Average Price | Maximum Price |
|---|---|---|---|
| February 2030 | 4.50 | 4.67 | 4.86 |
| March 2030 | 4.62 | 4.80 | 5.00 |
| April 2030 | 4.75 | 4.93 | 5.13 |
| May 2030 | 4.87 | 5.06 | 5.27 |
| June 2030 | 5.01 | 5.20 | 5.41 |
| July 2030 | 5.14 | 5.34 | 5.56 |
| August 2030 | 5.28 | 5.48 | 5.71 |
| September 2030 | 5.42 | 5.63 | 5.86 |
| October 2030 | 5.57 | 5.78 | 6.02 |
| November 2030 | 5.72 | 5.94 | 6.18 |
| December 2030 | 5.87 | 6.10 | 6.35 |
| January 2031 | 6.03 | 6.26 | 6.52 |
Theta Network Price Prediction 2031
In our long-term THETA price prediction for 2031, we anticipate a minimum price of $5.96, an average price of around $7.08, and a maximum price potentially hitting $8.41.
| Month | Minimum Price | Average Price | Maximum Price |
|---|---|---|---|
| February 2031 | 5.96 | 6.19 | 6.45 |
| March 2031 | 6.12 | 6.36 | 6.62 |
| April 2031 | 6.29 | 6.53 | 6.80 |
| May 2031 | 6.46 | 6.71 | 6.98 |
| June 2031 | 6.63 | 6.89 | 7.17 |
| July 2031 | 6.81 | 7.08 | 7.37 |
| August 2031 | 7.00 | 7.27 | 7.56 |
| September 2031 | 7.19 | 7.46 | 7.77 |
| October 2031 | 7.38 | 7.66 | 7.98 |
| November 2031 | 7.58 | 7.87 | 8.19 |
| December 2031 | 7.78 | 8.08 | 8.41 |
| January 2032 | 7.99 | 8.30 | 8.64 |
Theta Network Price Prediction 2032
As we leap forward to the year 2032, our THETA price prediction suggests a minimum price of $7.9, an average price of about $9.37, and a maximum price that could reach a lofty $11.15.
| Month | Minimum Price | Average Price | Maximum Price |
|---|---|---|---|
| February 2032 | 7.90 | 8.21 | 8.54 |
| March 2032 | 8.12 | 8.43 | 8.77 |
| April 2032 | 8.33 | 8.65 | 9.01 |
| May 2032 | 8.56 | 8.89 | 9.25 |
| June 2032 | 8.79 | 9.13 | 9.50 |
| July 2032 | 9.03 | 9.37 | 9.76 |
| August 2032 | 9.27 | 9.63 | 10.02 |
| September 2032 | 9.52 | 9.89 | 10.29 |
| October 2032 | 9.78 | 10.16 | 10.57 |
| November 2032 | 10.04 | 10.43 | 10.86 |
| December 2032 | 10.31 | 10.71 | 11.15 |
| January 2033 | 10.59 | 11.00 | 11.45 |
The Main Questions Of Critical Thinking When We Talk About Theta Network Price Forecast
Below are three critical thinking questions to deepen your own research and understanding of the price of THETA and the other factors influencing it:
- What is the data source? It’s vital to understand where the data is coming from. Is it from a reputable source? Is the data recent and up-to-date?
- What factors influence the THETA price? Just like any other cryptocurrency, several factors can impact the price of Theta Network, such as supply and demand, market sentiment, technological advancements, regulatory news, and overall market trends.
- What are the assumptions made in the THETA price prediction? Every THETA price prediction is based on certain assumptions. Are these assumptions logical and based on sound economic principles?
- What methodologies are used for the THETA price prediction? There are different methodologies for predicting crypto prices, such as technical analysis and fundamental analysis. Which one is used, and why?
- How reliable have past THETA price predictions been? Looking at past price predictions and how accurate they were can give you an idea of how trustworthy current predictions might be.
- What are the potential risks and uncertainties? The crypto market is highly volatile and unpredictable. What uncertainties could potentially affect the forecast?
- How does the THETA price prediction compare to others? It’s beneficial to compare forecasts from different sources. Are they largely in agreement, or are there significant differences?
- What is the time frame of the THETA price prediction? THETA price predictions can greatly vary depending on whether they’re short-term or long-term forecasts.
- What are the potential impacts of broader market trends? How could global economic factors and trends in the wider crypto market impact the price of Theta Network?
- What are the implications of this THETA price prediction? If the forecast is accurate, what could this mean for THETA and its investors?
Remember, it’s important to always use critical thinking and conduct thorough research before making investment decisions. Don’t rely solely on forecasts and always be prepared for the unexpected.
Theta Network (THETA) Price Predictions by Experts
Great, let’s delve into the opinions of some industry experts and business analysts regarding Theta Network’s (THETA) price prediction and future prospects. Remember, these are expert opinions and should not be taken as investment advice.
- Wallet Investor’s THETA Price Prediction: Based on their Theta price forecast, a long-term correction is expected. Their year-end prediction for 2024 sees the price at $0.534. According to this analysis, current investments may devalue, positioning THETA as a potentially high-risk investment option.
- Digital Coin THETA Price Prediction: As per their Theta price prediction, the price of Theta Network is projected to exceed $2.30. By the close of 2024, Theta Network is expected to reach a minimum value of $2.34. Furthermore, the THETA price has the potential to achieve a maximum level of $2.77.
- GOV Capital’s THETA Price Prediction: The future price of the THETA token is forecasted at $1.197 a year from now, according to their THETA price prediction.
- Price Prediction Analysis: Based on a deep technical analysis and Theta price prediction, the price of Theta Network is estimated to be around a minimum value of $1.44 in 2024. The Theta Network price value can reach a maximum of $1.67 with an average trading price of $1.49.
- Mitch Liu, the co-founder and CEO of Theta Network: Mitch Liu has consistently expressed confidence in the project’s potential. He has emphasized the importance of users being rewarded for sharing their bandwidth to others, thereby improving the overall efficiency of video streaming.

Mitch Liu
Decoding the Charts: Technical Analysis in THETA Price Predictions
Cracking the code of THETA’s price movement requires understanding the nuances of technical analysis. This is the methodical examination of price patterns, volume data, and various technical indicators that traders utilize to predict future price movement. It’s like trying to make sense of a chaotic symphony by isolating individual instruments.
Before we delve into specifics, here are some key concepts and tools used in technical analysis:
- Trend Lines: These lines follow the general market direction over time.
- Moving Averages: They smooth out price data by creating a constantly updated average price.
- Volume: This refers to the number of shares or contracts traded in a security or market.
- Oscillators: These are leading indicators signaling potential market reversals.
Technical Indicators for THETA Price Prediction: Origin and Purpose
The universe of technical analysis revolves around tech indicators, designed to forecast financial market directions.
Technical indicators, mathematical calculations based on a trading instrument’s price, volume, or open interest, are integral to the predictive models of trading. Their history dates back to the 18th century with the advent of the candlestick charting technique in Japan. Since then, hundreds of indicators have been developed, with pioneers like Welles Wilder and John Bollinger leaving indelible marks on the trading world.
The Role of Technical Indicators in Financial Markets
Tech indicators serve as the compass guiding traders through the turbulent seas of financial markets. They help decipher the price patterns and other market behaviors, making them invaluable for assessing market entry or exit points. The study of these indicators is integral to spotting trends, volatility, momentum, and other key aspects of market psychology.
How Technical Indicators Can Be Used in THETA Price Prediction
Technical indicators are not solely the realm of traditional finance; they have a place in the crypto market as well. They can help predict the price of THETA, for instance, by identifying periods of consolidation, breakouts, or potential price reversals.
Traders often use indicators like the Relative Strength Index (RSI) or Moving Average Convergence Divergence (MACD) to gauge market sentiment around THETA. When used in conjunction with other analysis methods, tech indicators can provide a rounded perspective of THETA’s future price direction.
As we delve deeper into the realm of technical analysis, it becomes increasingly crucial to familiarize ourselves with the key tech indicators. These indicators serve as our trusted guides, enabling us to make sense of the complex web of price patterns and market movements. Let’s dive into the most common technical indicators used in predicting the price of Theta Network’s THETA token.
Moving Averages (MAs) for Theta Network Price Prediction
Moving averages are one of the most popular and easy-to-use tools available to technical analysts. They smooth out price data to form a trend-following indicator. For THETA price prediction, you could use the 50-day moving average (MA), which calculates the average price of THETA over the past 50 days.

Example: If the price of Theta Network is currently above its 50-day MA, it could signal a bullish trend. Conversely, if it’s below, that could suggest a bearish trend. It’s essential to remember, though, that MAs are lagging indicators. They don’t predict future price movements but rather indicate existing trends.
Relative Strength Index (RSI) for Theta Network Price Prediction
The Relative Strength Index (RSI) is another powerful tool in a trader’s arsenal. It’s an oscillator that measures the speed and change of price movements on a scale of 0 to 100. Generally, an RSI above 70 suggests that THETA may be overbought (and due for a price drop), while an RSI below 30 indicates it could be oversold (and might see a price rise).

Example: Let’s take an example where the RSI for THETA price prediction moves from 70 to 75. While some might think this continues to signal overbuying, it could also indicate strengthening momentum, leading to even higher prices. The key is to use RSI in conjunction with other indicators for more robust predictions.
Moving Average Convergence Divergence (MACD) for Theta Network Price Prediction
The Moving Average Convergence Divergence (MACD) is a trend-following momentum indicator that reveals the relationship between two moving averages of the price of Theta Network. It consists of the MACD line (the 12-day EMA minus the 26-day EMA), a signal line (the 9-day EMA of the MACD line), and the histogram (depicting the difference between the MACD line and the signal line).
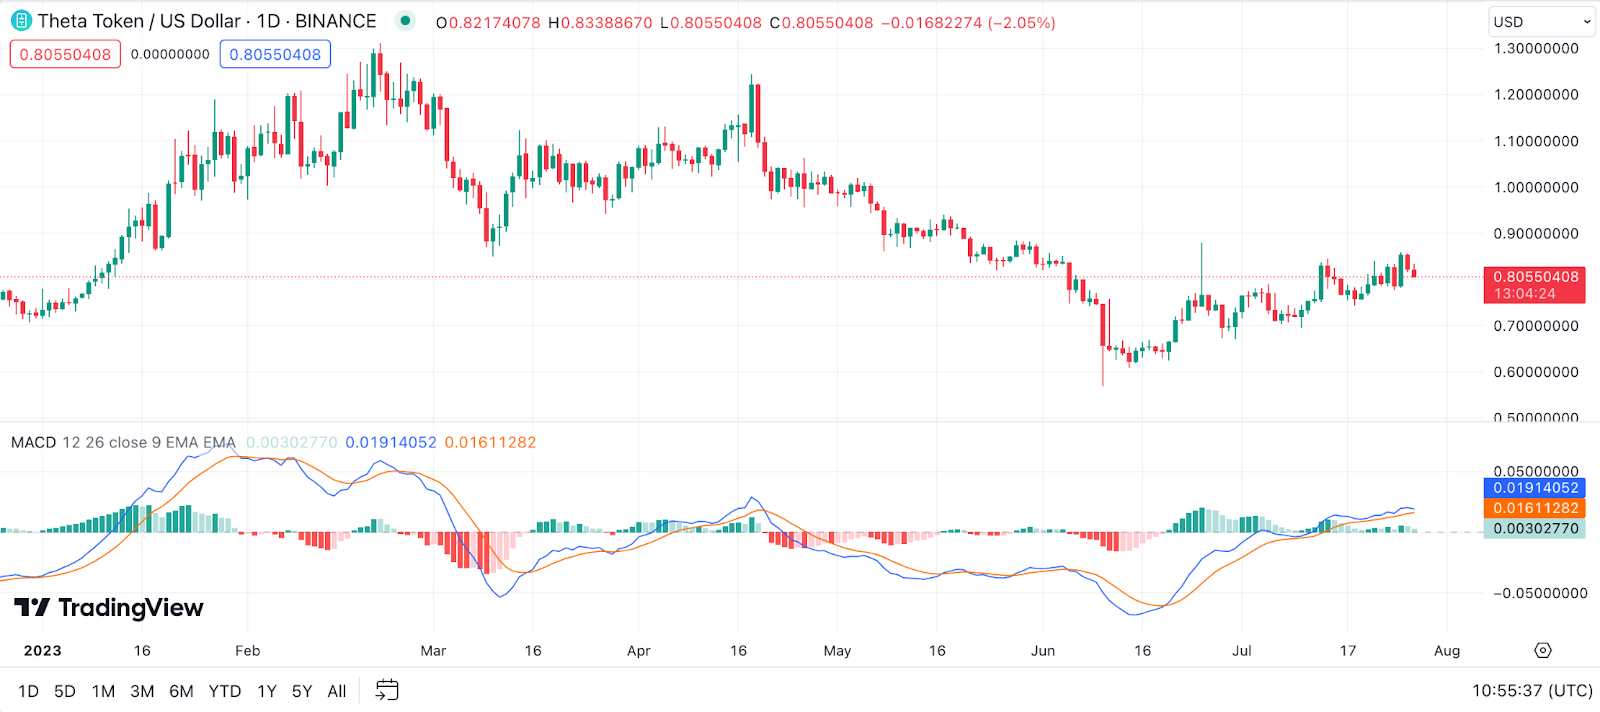
Example: When the MACD line crosses above the signal line, it generates a bullish signal, implying it could be a good time to buy THETA. Conversely, a bearish signal is produced when the MACD line crosses below the signal line, suggesting it might be an ideal time to sell. Like all indicators, the MACD isn’t infallible and should be used in tandem with other indicators and analysis techniques.
Bollinger Bands for Theta Network Price Prediction
Bollinger Bands are a volatility indicator widely used in financial markets, including the crypto space. They comprise a middle band (a simple moving average) with two standard deviations plotted above and below it. These bands expand and contract based on THETA’s volatility.
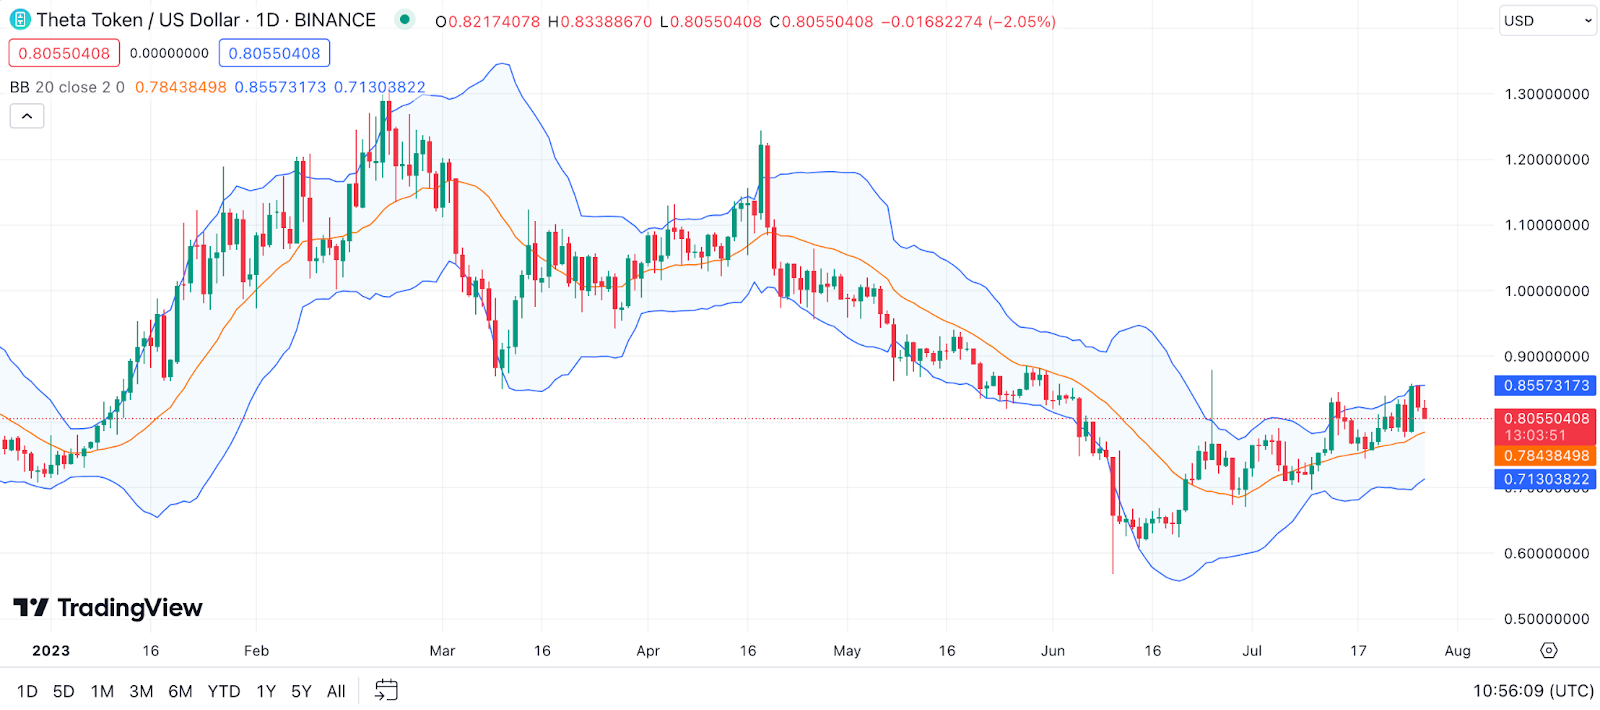
Example: Suppose the price of Theta Network touches the upper band. In that case, it might be considered overbought, suggesting a potential price retraction. On the other hand, if the price touches the lower band, it could be a sign that THETA is oversold and a price rebound may be in order. A price breakout above or below these bands might also indicate a strong trend.
If the price of Theta Network consistently rides the upper Bollinger Band during a bullish trend, this could suggest strong upward momentum. However, if it then breaks below the middle band, it might signal a trend reversal.
Stochastic Oscillator for Theta Network Price Prediction
The Stochastic Oscillator is a momentum indicator comparing a particular closing price of THETA to a range of its prices over a certain period. The indicator oscillates between 0 and 100, with readings below 20 indicating an oversold condition and above 80 an overbought condition.
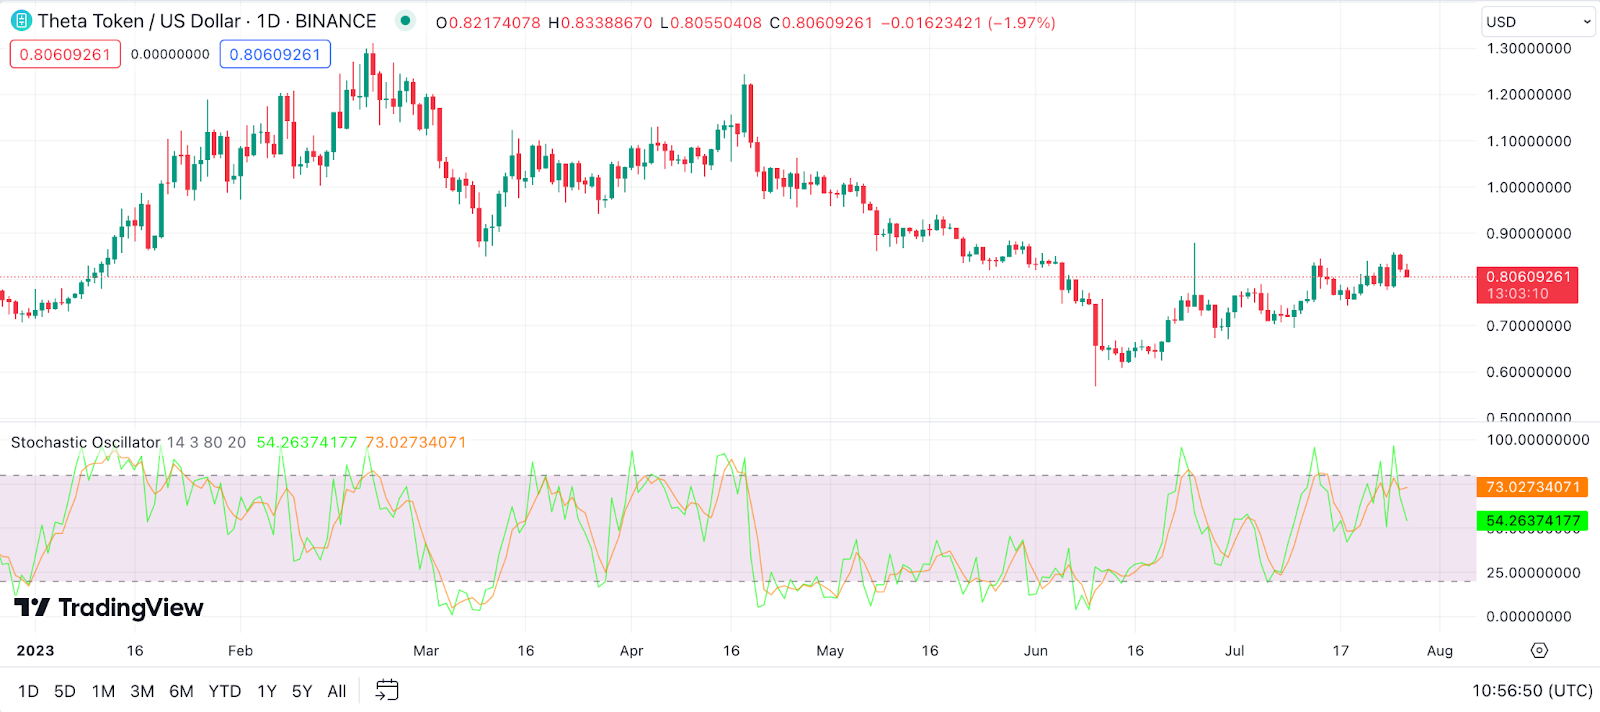
Example: Let’s say the Stochastic Oscillator for THETA price prediction drops below 20. This signals that THETA might be oversold and could be due for a price bounce. Conversely, if the oscillator moves above 80, it suggests that THETA may be overbought and could experience a price drop.
Parabolic SAR (Stop and Reverse) for Theta Network Price Prediction
The Parabolic SAR (Stop and Reverse) is a trend-following indicator providing potential entry and exit points. The dots are plotted below the price during uptrends (indicating bullish sentiment) and above the price during downtrends (indicating bearish sentiment).
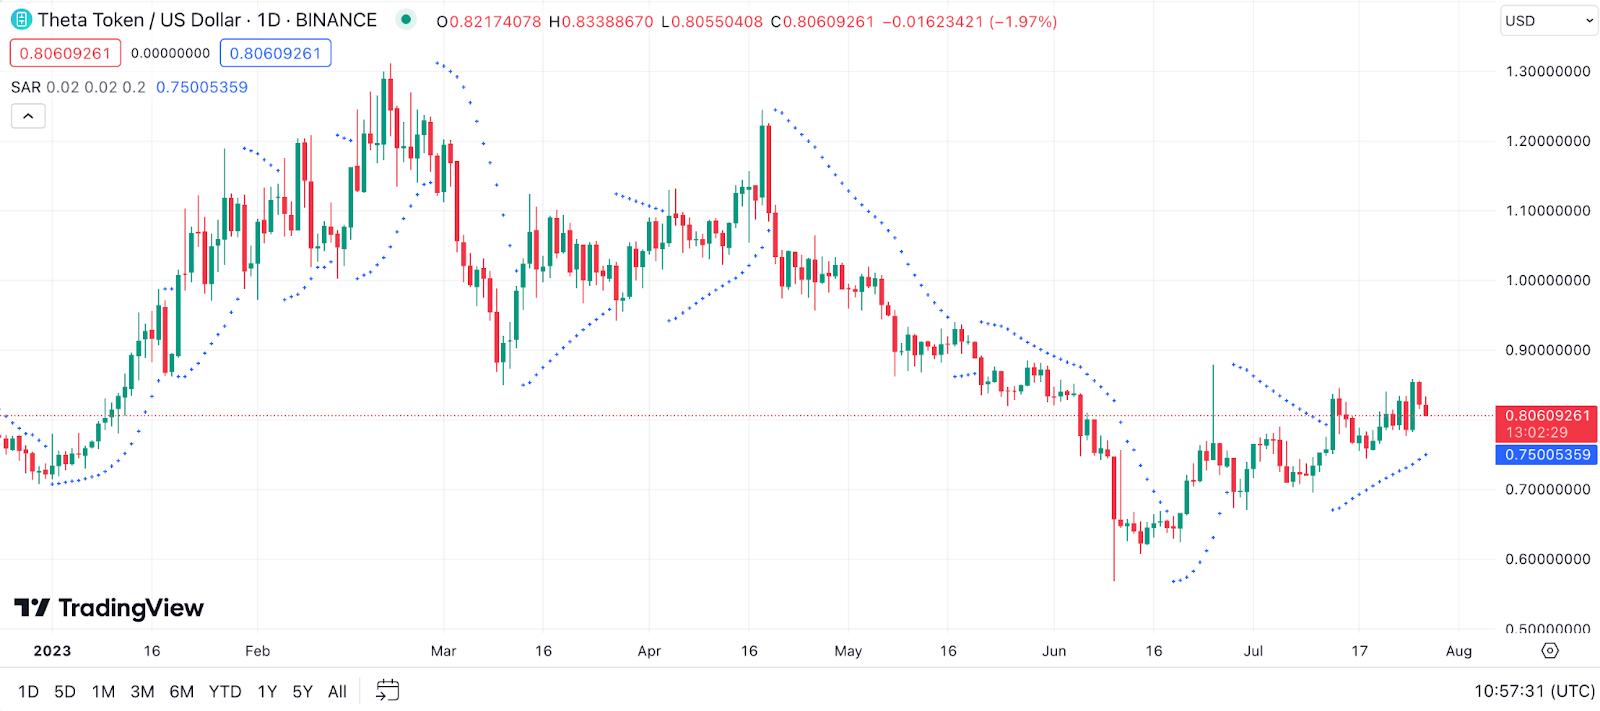
Example: If the Parabolic SAR dots shift from above to below the price of Theta Network, it might signal a bullish reversal, suggesting a buying opportunity. Conversely, if the dots move from below to above the price, a bearish reversal might be at play, indicating it might be time to sell.
Ichimoku Cloud for Theta Network Price Prediction
The Ichimoku Cloud is a comprehensive indicator providing a wealth of information about support and resistance, trend direction, momentum, and potential buy and sell signals. It comprises five lines: the Tenkan-sen, Kijun-sen, Senkou Span A, Senkou Span B, and Chikou Span.
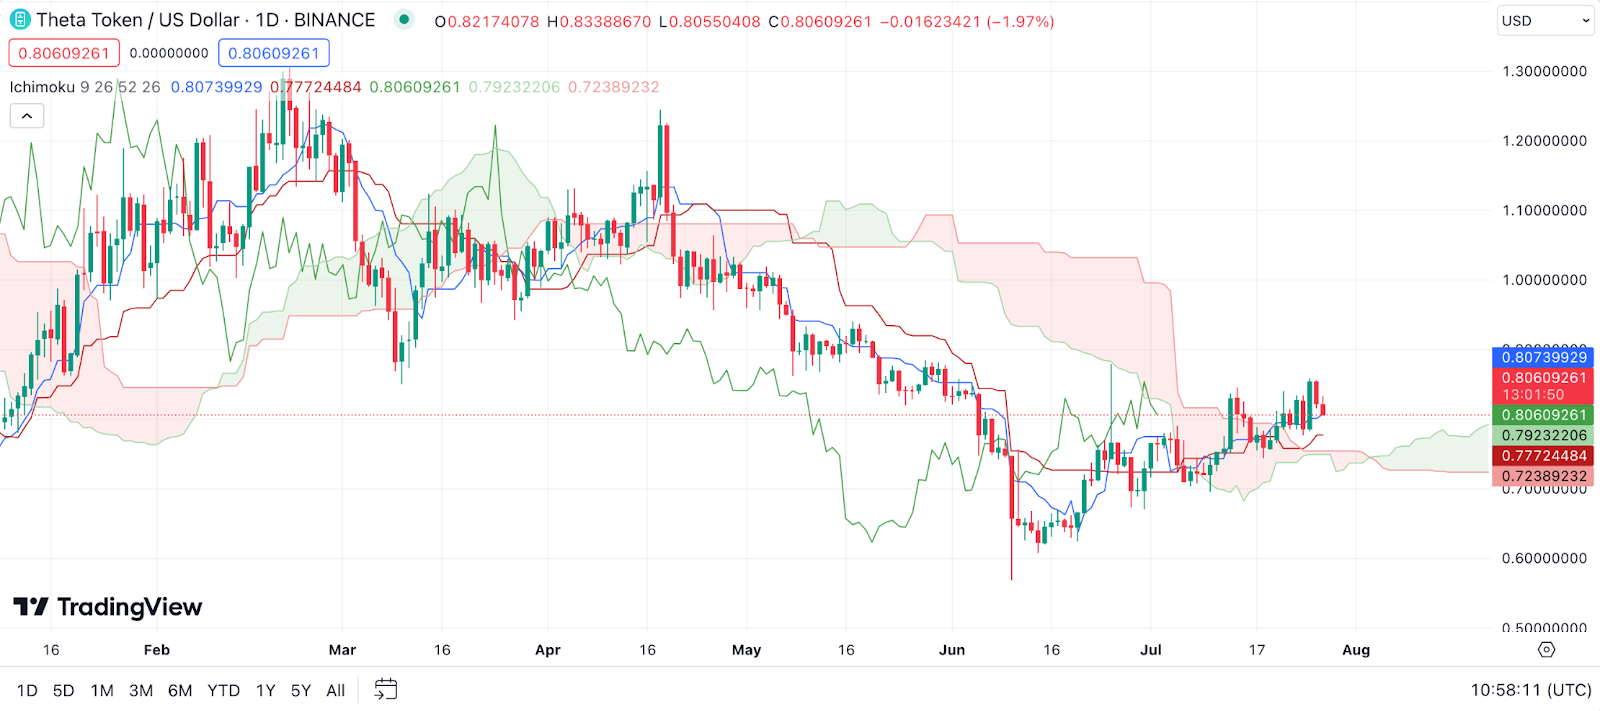
Example: If the THETA price is above the cloud, the overall trend is bullish, and below the cloud indicates a bearish trend. For instance, if the Tenkan-sen (Conversion Line) crosses above the Kijun-sen (Base Line) while the current value of THETA is above the cloud, it’s generally considered a strong buy signal. Conversely, if the Conversion Line crosses below the Base Line with the price below the cloud, it can be seen as a strong sell signal.
Fibonacci Retracement for Theta Network Price Prediction
Fibonacci Retracement is a popular tool among traders to identify potential levels of support and resistance. These levels are based on Fibonacci numbers, a sequence where each number is the sum of the two preceding ones.
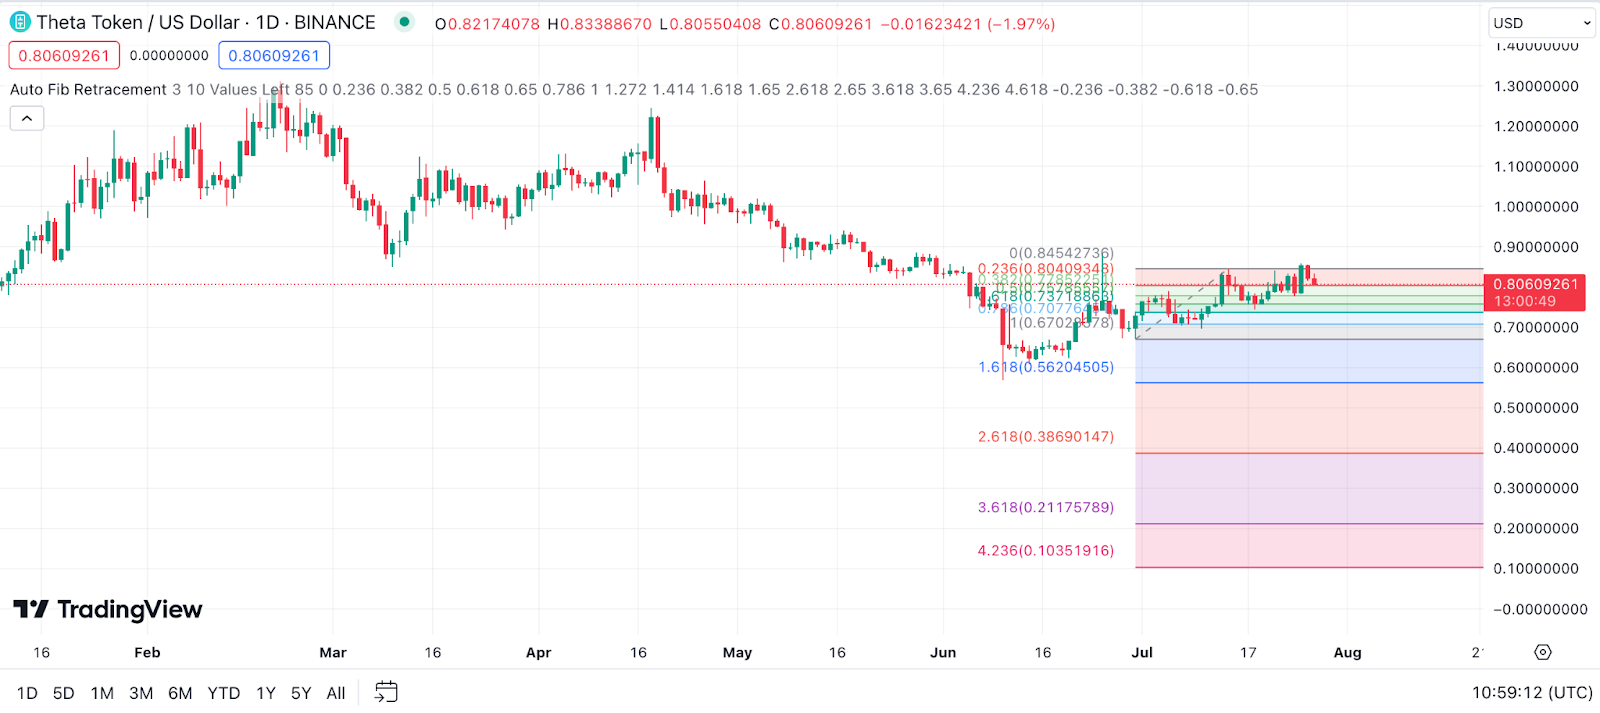
Example: If Theta Network cost experiences a significant price move, either up or down, traders can use the Fibonacci retracement levels to predict where the pullback might end. For example, after a bullish rally, the current value of THETA might retrace back to the 61.8% Fibonacci level before resuming the upward trend.
Average Directional Index (ADX) for Theta Network Price Prediction
The Average Directional Index (ADX) is a technical analysis indicator used to quantify the strength of a trend. It ranges from 0 to 100, with readings below 20 indicating a weak trend and readings above 50 signifying a strong trend.

Example: If the ADX for THETA price prediction is rising above 50, it suggests that the current price trend—whether it’s bullish or bearish—is quite strong. However, if the ADX is declining, it could mean the trend is weakening and a price reversal might be on the horizon. The ADX can be especially valuable when used in conjunction with other indicators to confirm significant market moves.
On Balance Volume (OBV) for Theta Network Price Prediction
On Balance Volume (OBV) is a momentum indicator that uses volume flow to predict changes in the price of a coin. It measures buying and selling pressure by adding volume on days the price increases, and subtracting volume on days the price decreases.
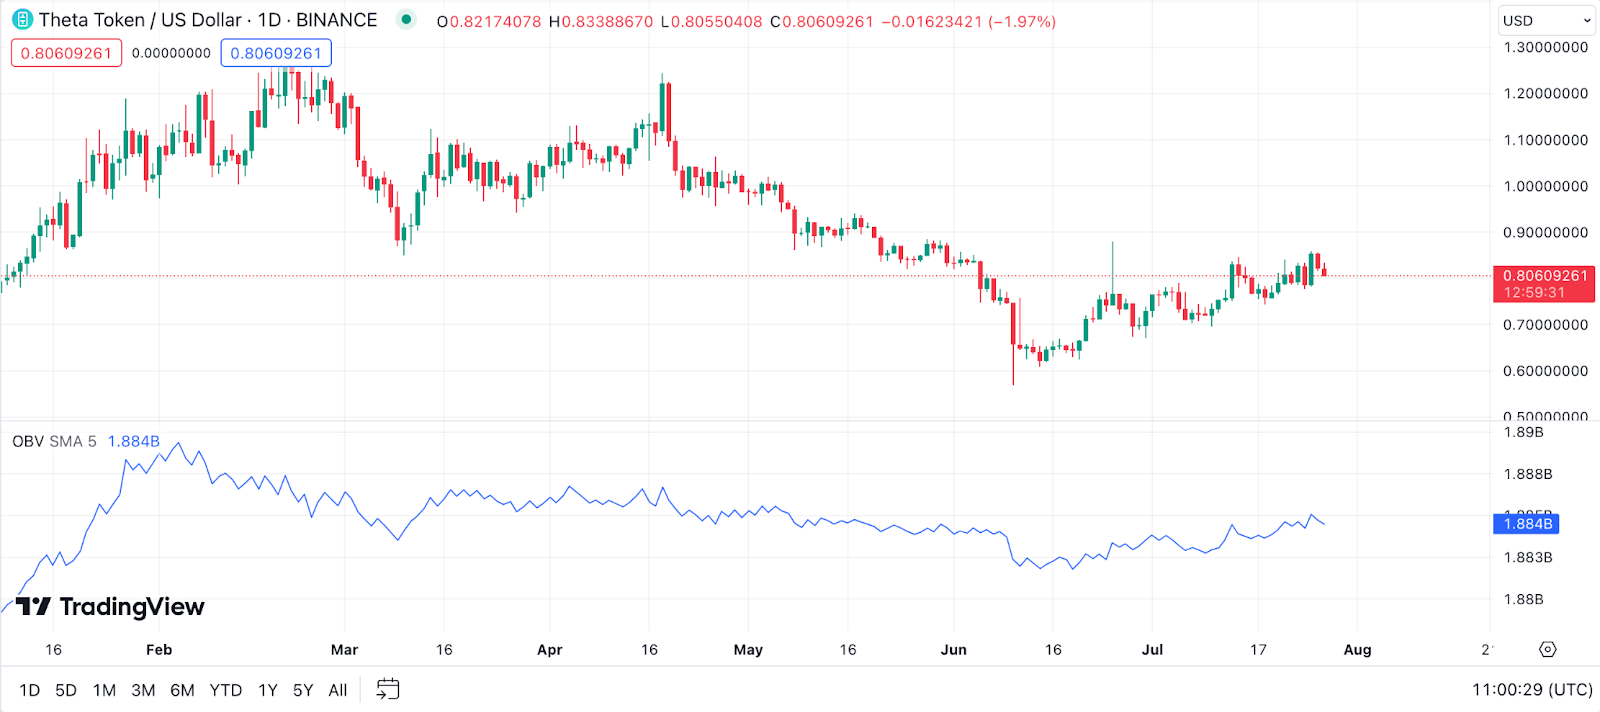
Example: If the current value of THETA is rising and the OBV is rising too, it indicates that volume is higher on up days. If the price starts to fall while OBV remains high or continues to rise, it could signal a potential price rebound, as the volume suggests strong investor interest.
Rate of Change (ROC) for Theta Network Price Prediction
The Rate of Change (ROC) is a momentum oscillator that measures the percentage change in price from one period to the next. The ROC increases as prices rise and decreases as prices fall, helping identify potential buy and sell signals.
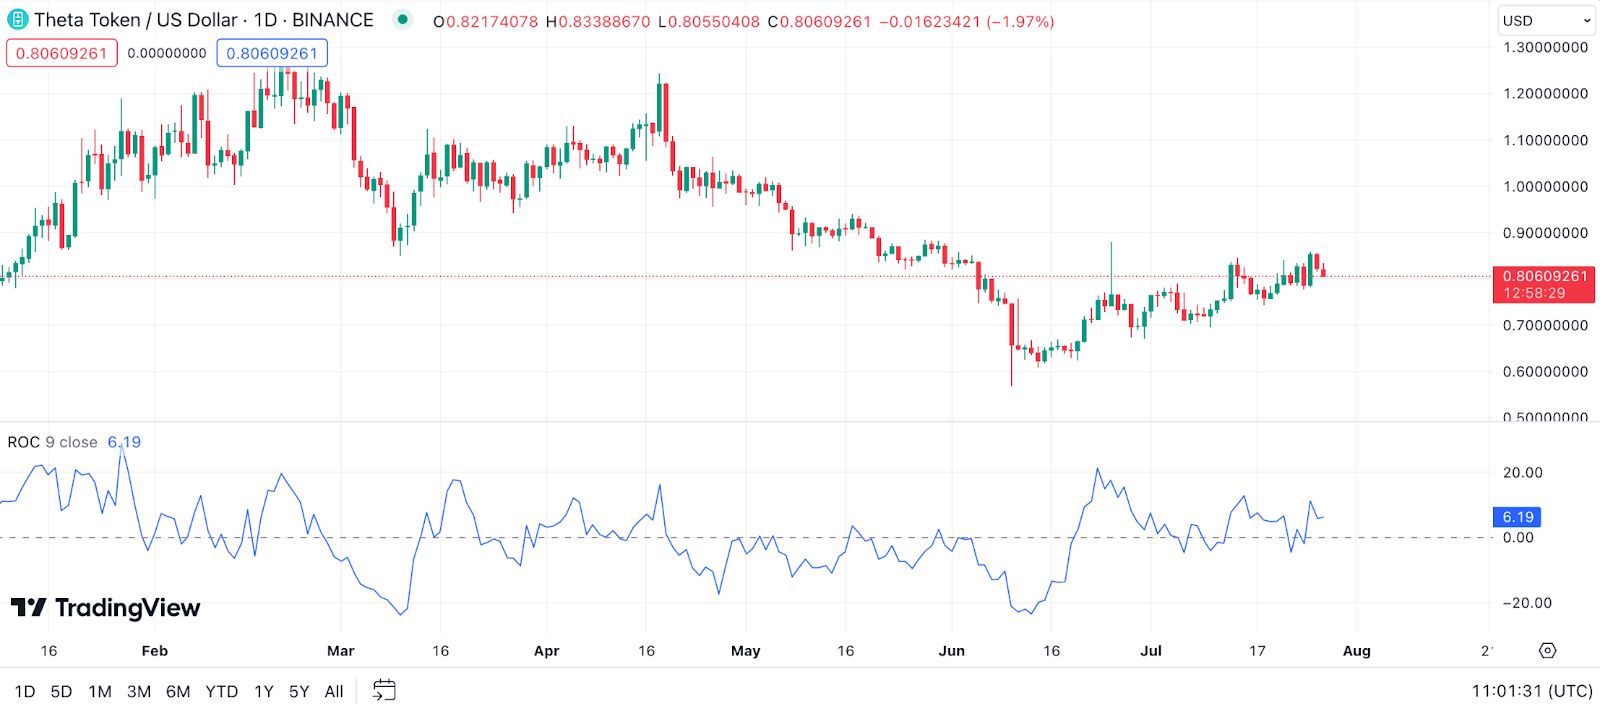
Example: If the ROC for THETA price prediction is moving from below the zero line to above, it’s a bullish sign, suggesting that the price is gaining momentum. Conversely, a move from above the zero line to below can signal a bearish trend, implying a loss of momentum.
Commodity Channel Index (CCI) for Theta Network Price Prediction
The Commodity Channel Index (CCI) is a momentum-based oscillator used to help determine when an investment vehicle is reaching a condition of being overbought or oversold. It’s typically used to assess the direction and strength of a trend, as well as to identify potential reversals.
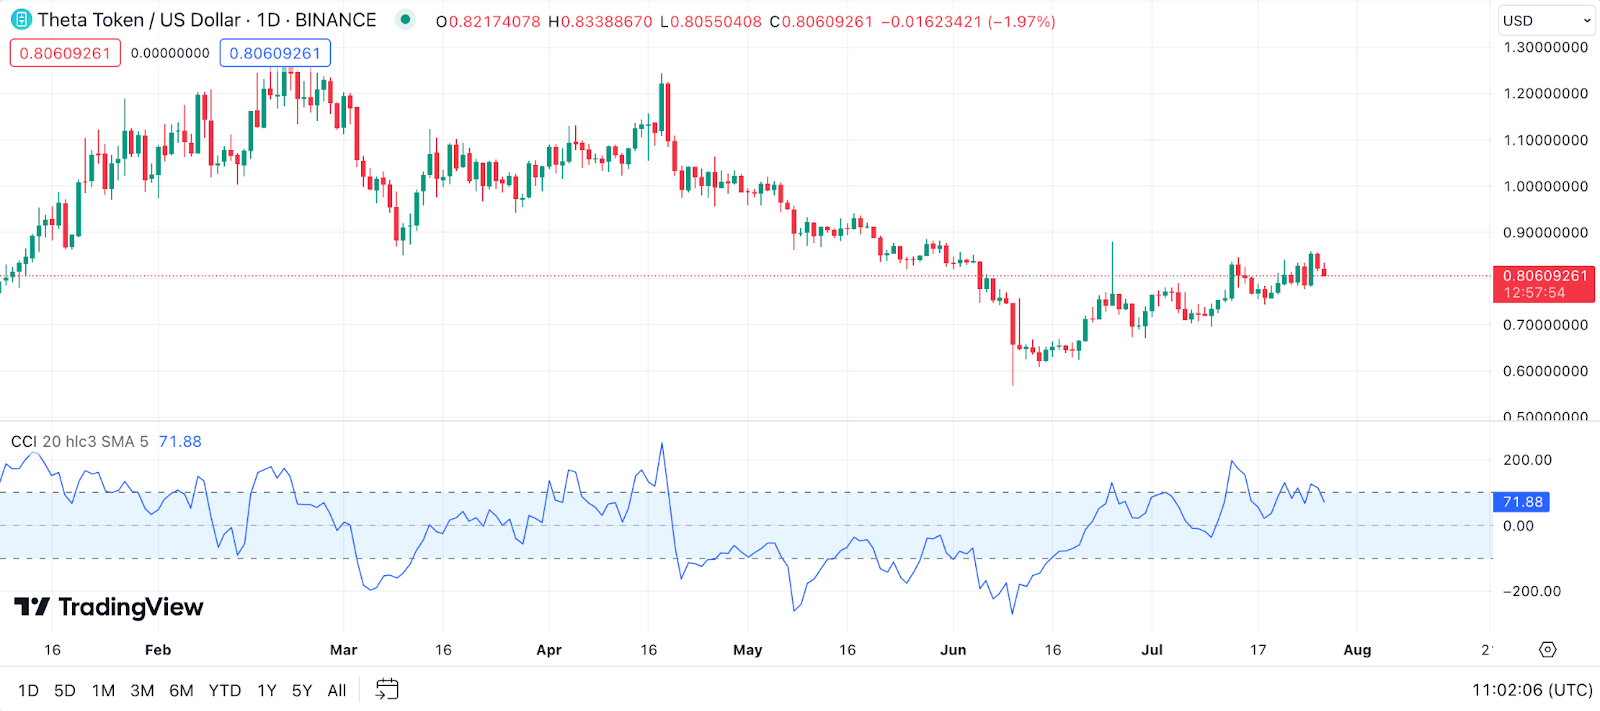
Example: In the context of THETA price prediction, if the CCI moves above +100, it means the price may be in an uptrend and could be considered overbought. This is typically a signal to sell. If the CCI is below -100, the price may be in a downtrend and could be seen as oversold, which is usually a signal to buy Theta Network.
Accumulation/Distribution Line (A/D Line) for Theta Network Price Prediction
The Accumulation/Distribution Line (A/D Line) is a volume-based indicator designed to measure the cumulative flow of money into and out of a security. The A/D line can help to identify buying and selling pressure.
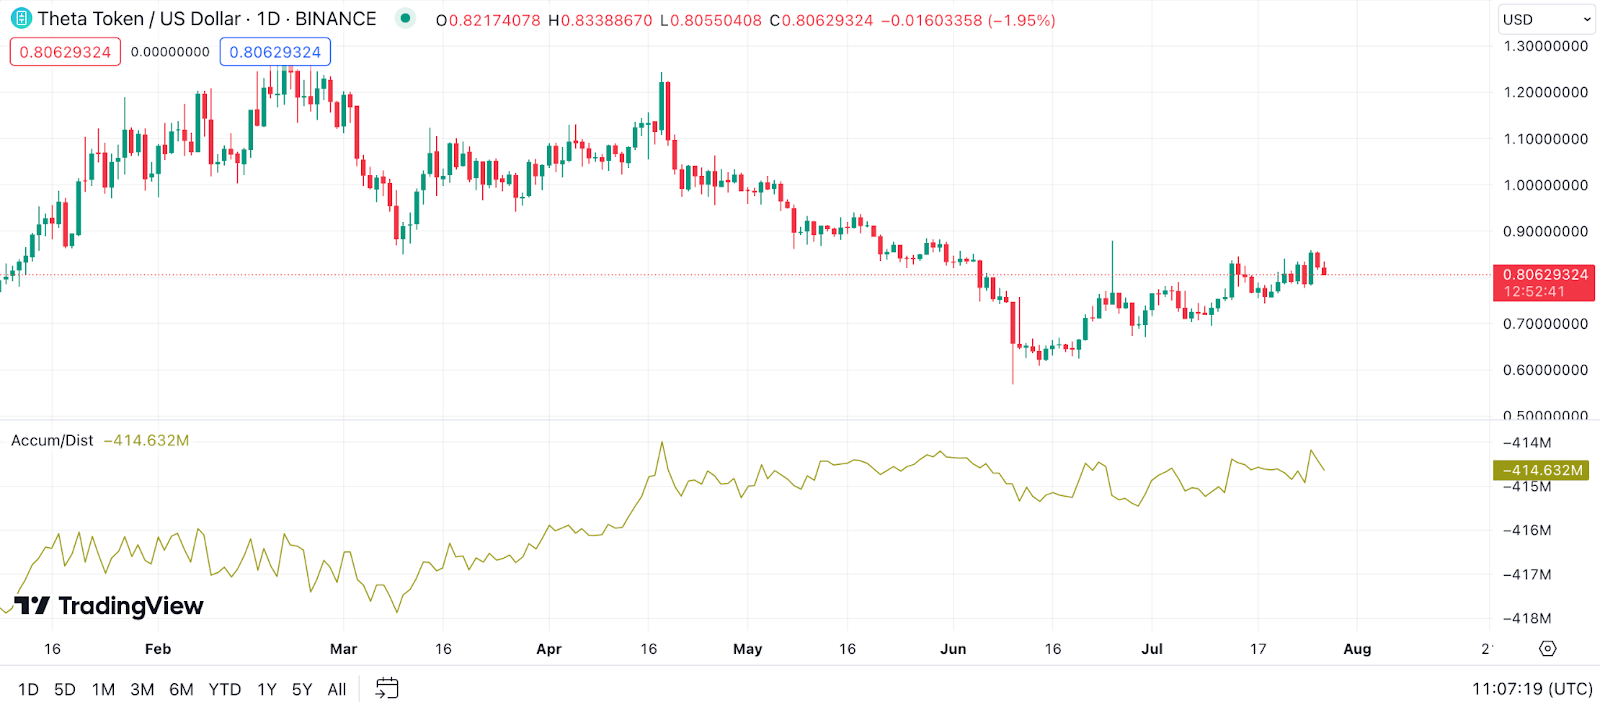
Example: With THETA price prediction, for instance, if the price is rising and the A/D line is rising too, it indicates strong buying pressure. Conversely, if the A/D line falls while the price is still rising, it could be an early warning sign of a potential price reversal, indicating that the coin may be seeing increased selling pressure.
Pivot Points for Theta Network Price Prediction
Pivot points are used by traders as an indicator of potential support and resistance levels. They are calculated using the high, low, and close prices of the previous trading period.
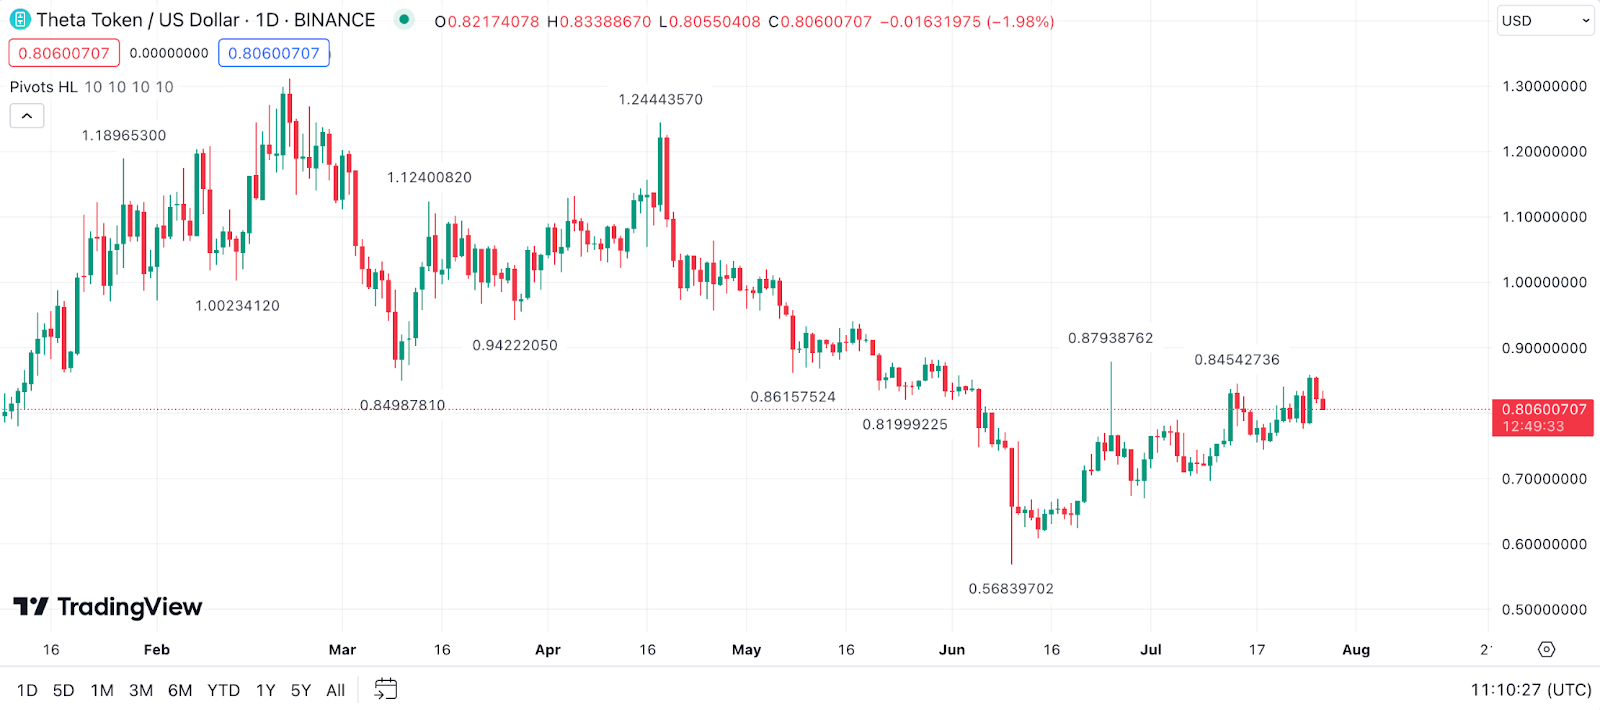
Example: If the current value of THETA rises above a pivot point, it’s considered a bullish signal. On the other hand, if the price falls below a pivot point, it’s seen as bearish. Traders may use these pivot points as areas to place buy or sell orders.
Chaikin Money Flow (CMF) for Theta Network Price Prediction
Chaikin Money Flow (CMF) is a technical analysis indicator used to measure Money Flow Volume over a set period of time. Money Flow Volume forms the basis for the Accumulation Distribution Line. Instead of a cumulative total of Money Flow Volume, CMF represents the running total over the specified period.
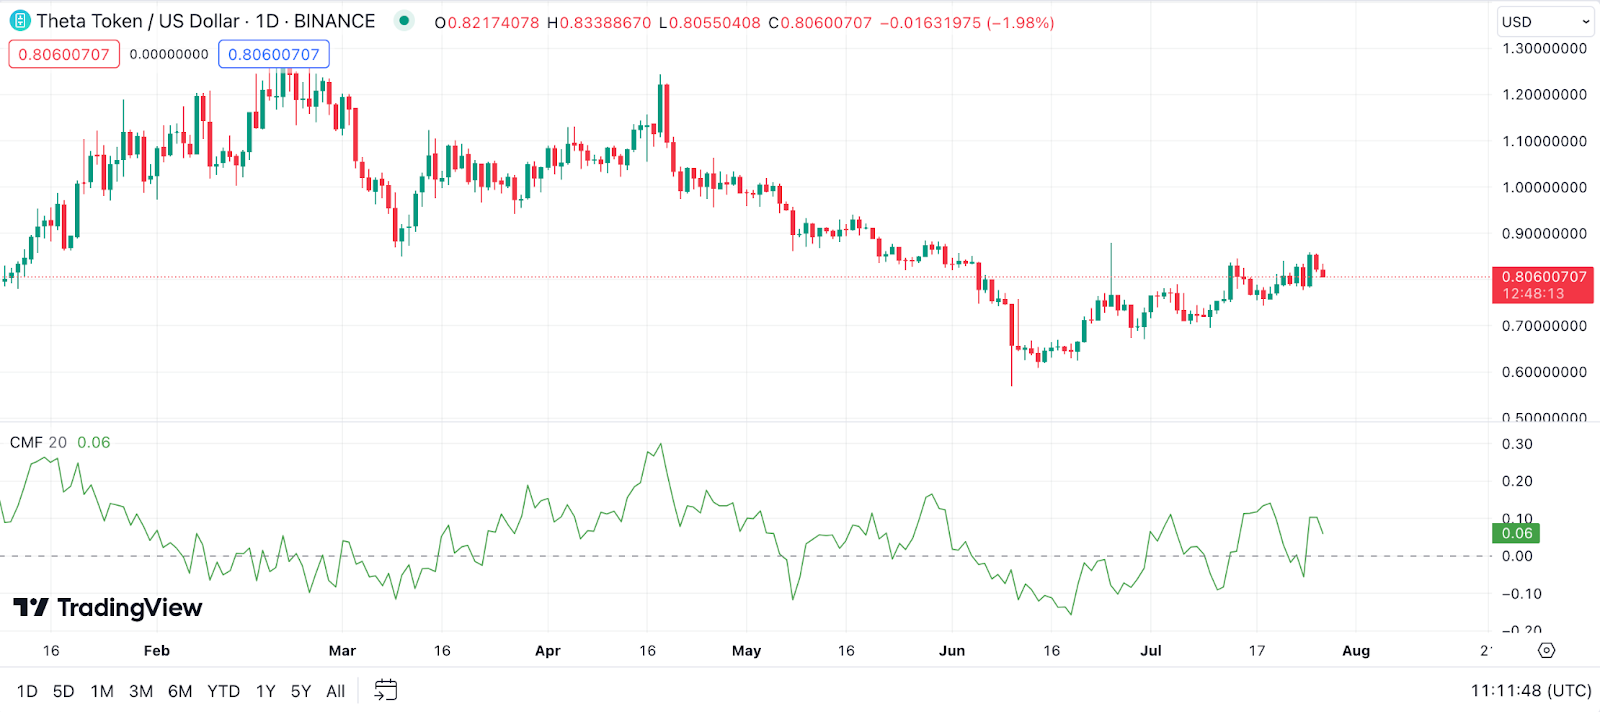
Example: In terms of THETA price prediction, a positive CMF value suggests that the cryptocurrency is likely under accumulation (buying pressure), and prices may move higher. Conversely, a negative CMF value indicates selling pressure with potential price decline.
Aroon Indicator for Theta Network Price Prediction
The Aroon Indicator is a versatile tool used to identify changes in trends, periods of consolidation, and the likelihood of new trends developing. It consists of two lines: Aroon Up and Aroon Down.
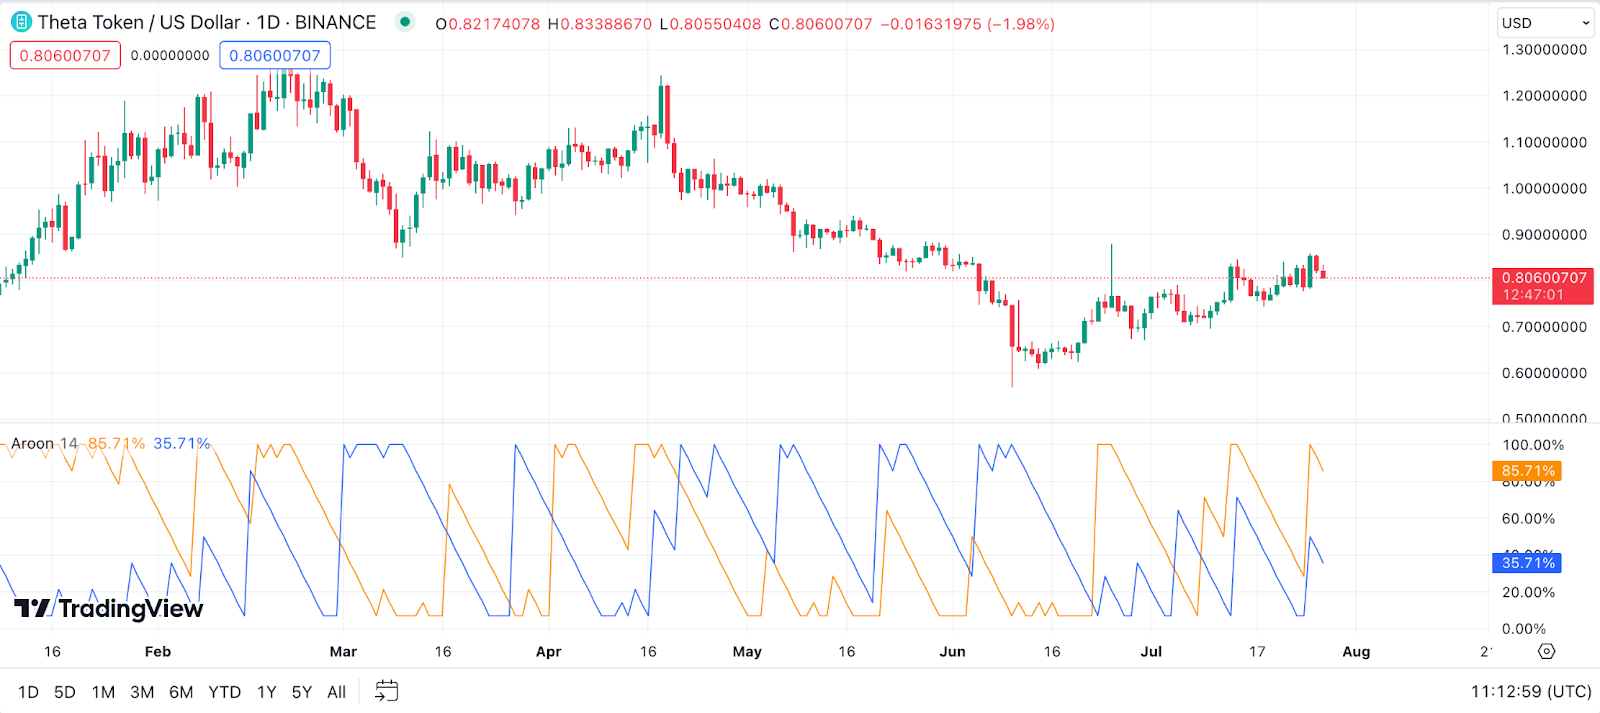
Example: Consider the case of THETA price prediction. If the Aroon Up crosses above the Aroon Down, it’s typically considered a bullish signal, and THETA might be poised for a price increase. However, if Aroon Down crosses above Aroon Up, it may signal a bearish trend, indicating a potential drop in the price of Theta Network.
Gann Fan for Theta Network Price Prediction
The Gann Fan is a technical analysis tool used to gauge the strength of a trend and predict changes in the trend. It uses angular lines to depict speed and time aspects in predicting future price movements.
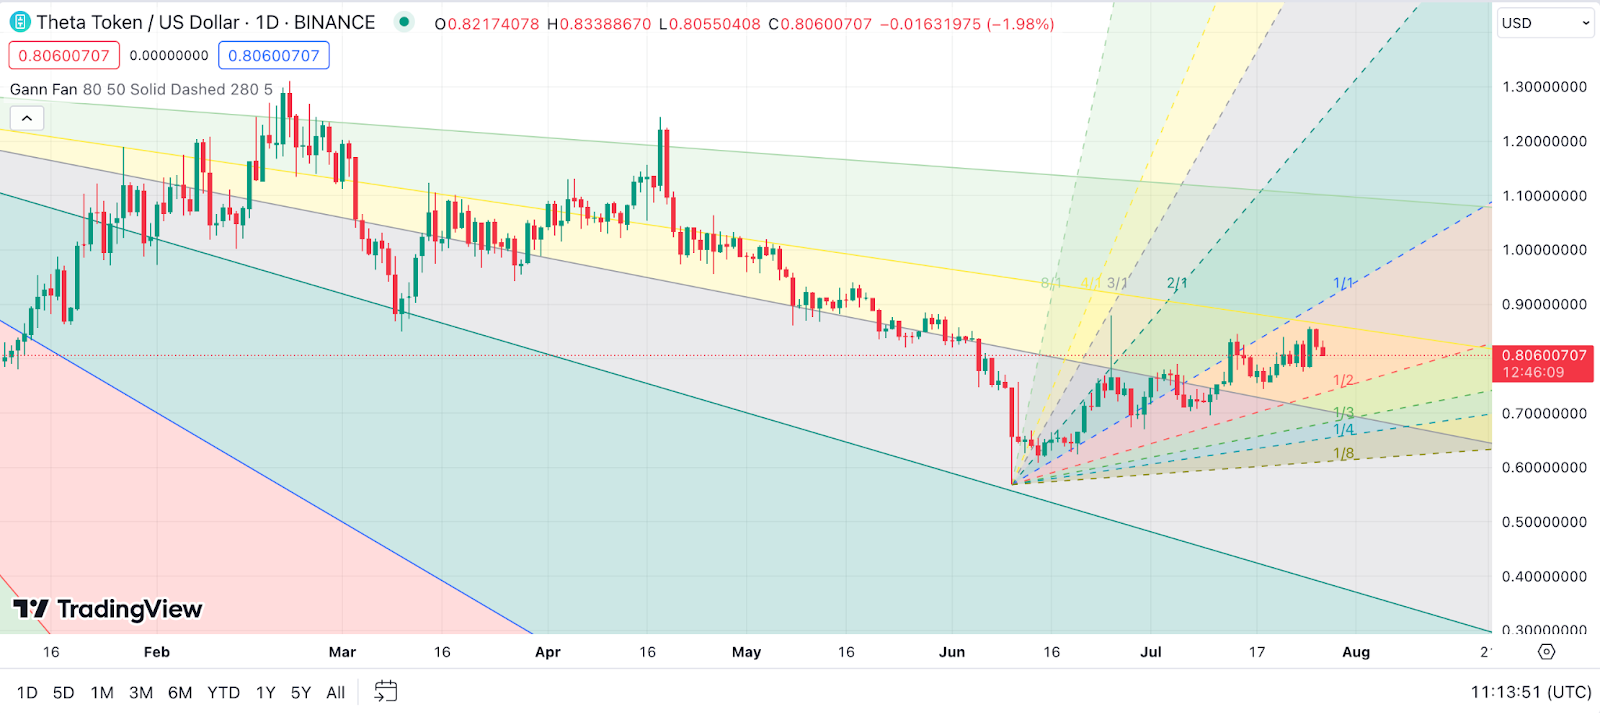
Example: As applied to THETA price prediction, a movement above one of the Gann Fan trend lines can indicate a bullish market trend, suggesting a potential price rise. Conversely, a drop below a Gann line may signal a bearish trend, possibly implying a future significant decline for THETA.
Keltner Channel for Theta Network Price Prediction
The Keltner Channel is a volatility-based technical indicator composed of three separate lines. The middle line is an exponential moving average (EMA), and the top and bottom lines are based on the average true range (ATR) of the price.

Example: For THETA price prediction, if the price moves towards the upper band, it suggests a strong upward trend, potentially indicating a buying opportunity. Conversely, if THETA price is nearing the lower band, it can suggest a downward trend, which might signal a selling opportunity. Remember that like any indicator, Keltner Channel shouldn’t be used in isolation but in conjunction with other analysis tools for a more comprehensive understanding of the market.
Money Flow Index (MFI) for Theta Network Price Prediction
The Money Flow Index (MFI) is a momentum indicator that measures the inflow and outflow of money into an asset over a specific period. It’s often used to identify overbought or oversold conditions in a market.

Example: In the case of THETA price prediction, a MFI reading over 80 would typically suggest that the asset is overbought, and could be due for a price reversal or pullback. Conversely, a MFI reading below 20 could indicate that THETA is oversold, and may be due for a price bounce.
TRIX for Theta Network Price Prediction
TRIX is a momentum oscillator that oscillates around zero, allowing business analysts to identify potential buy and sell signals. It’s particularly effective in filtering out insignificant price fluctuations.
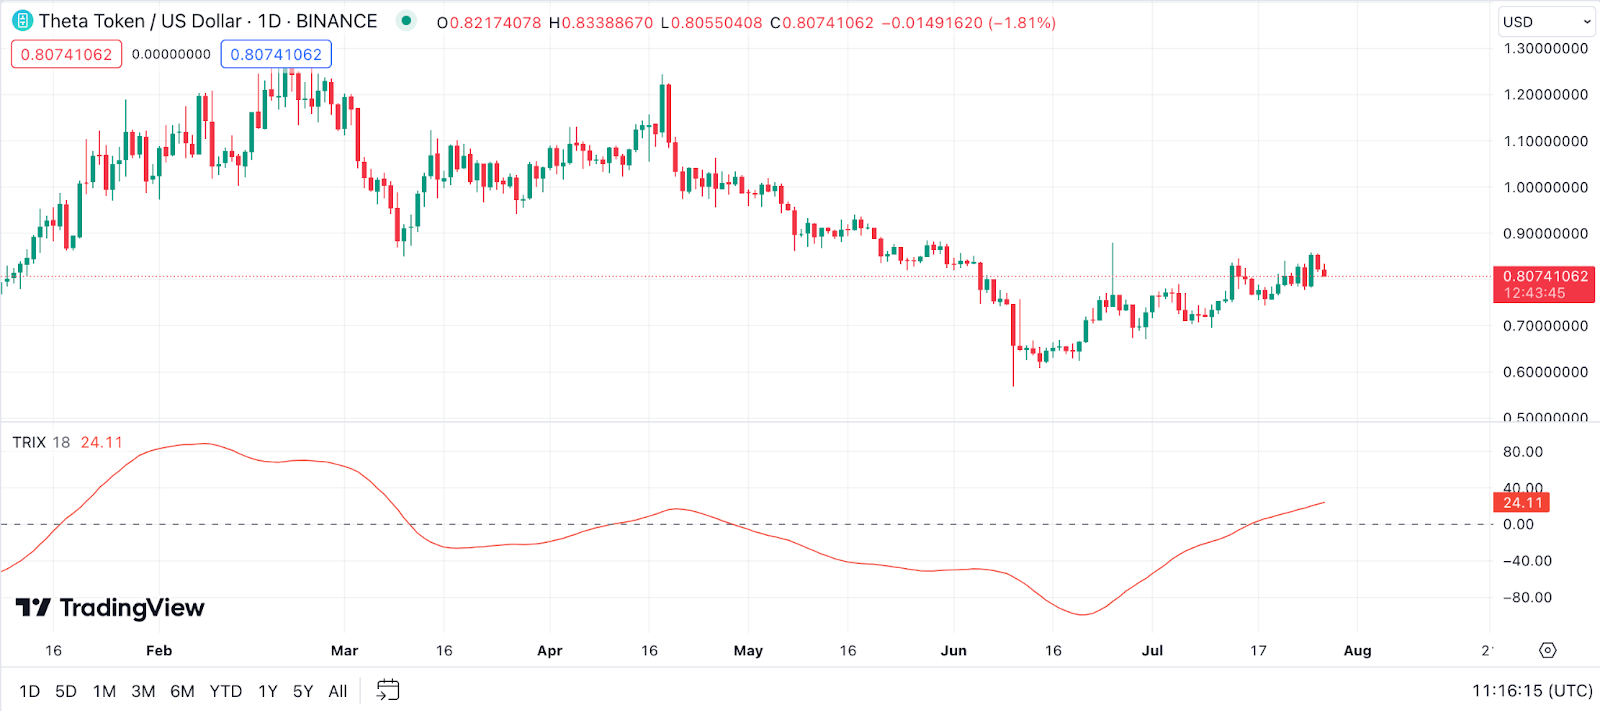
Example: For THETA price prediction, when the TRIX line crosses above the zero line, it can signify a potential bullish market, and may be a good time to consider buying. On the other hand, if the TRIX line crosses below the zero line, it could suggest a bearish market, and possibly a good time to sell.
Zig Zag Indicator for Theta Network Price Prediction
The Zig Zag indicator is a technical analysis tool used to identify classic charting patterns and to filter noise from the market. It draws lines that zigzag between significant highs and lows.
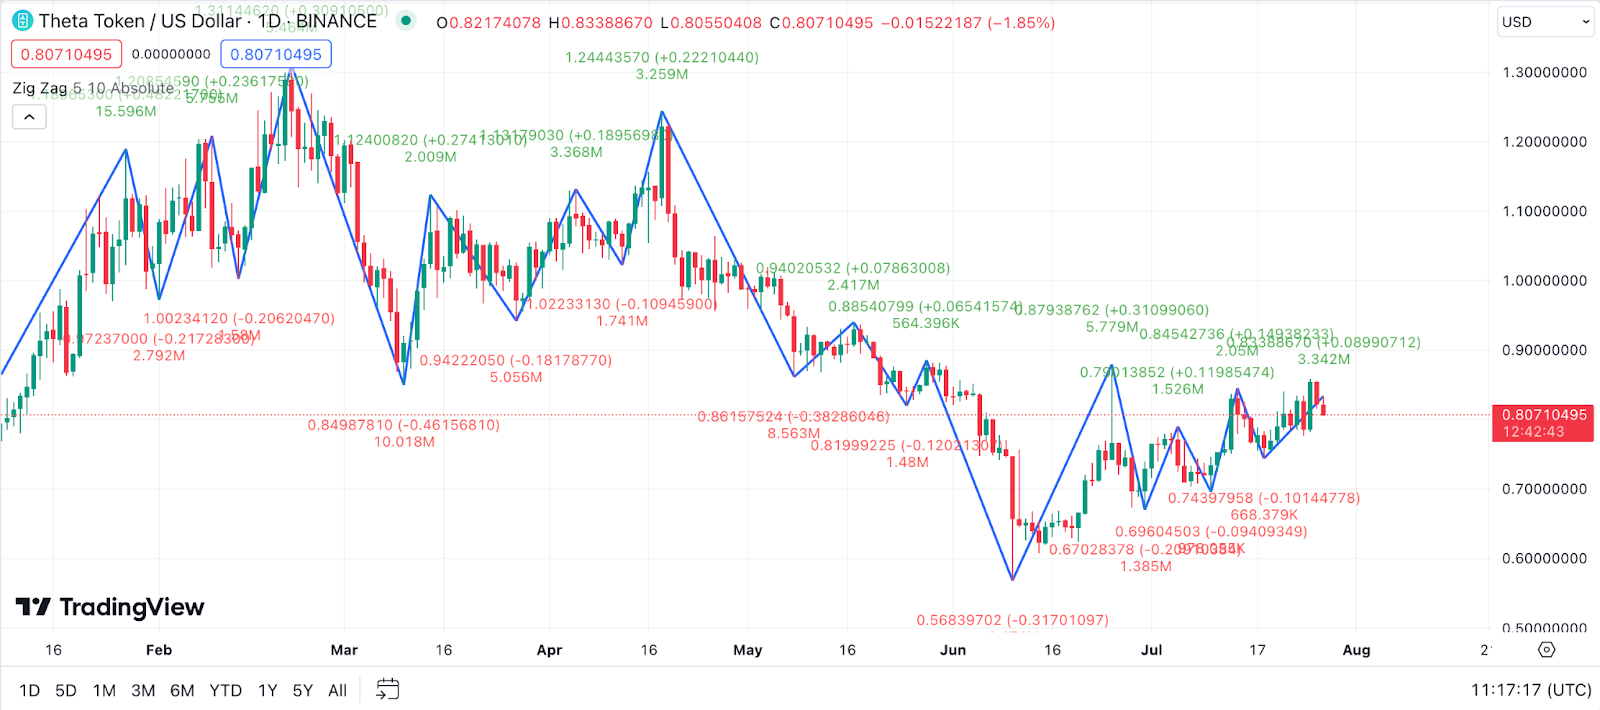
Example: For THETA price prediction, the Zig Zag indicator can help visualize significant upward and downward trends. A line moving upward signals a bullish trend, potentially indicating a good time to buy Theta Network. Conversely, a downward moving line can represent a bearish trend, which might be a sign to sell. As always, these indicators should be used in combination with other tools for a well-rounded view of the market.
Detrended Price Oscillator (DPO) for Theta Network Price Prediction
The Detrended Price Oscillator (DPO) is a price momentum indicator designed to remove the longer-term trends in prices to focus on the intermediate cycle. DPO is used to identify peaks and troughs in the price’s cycle.
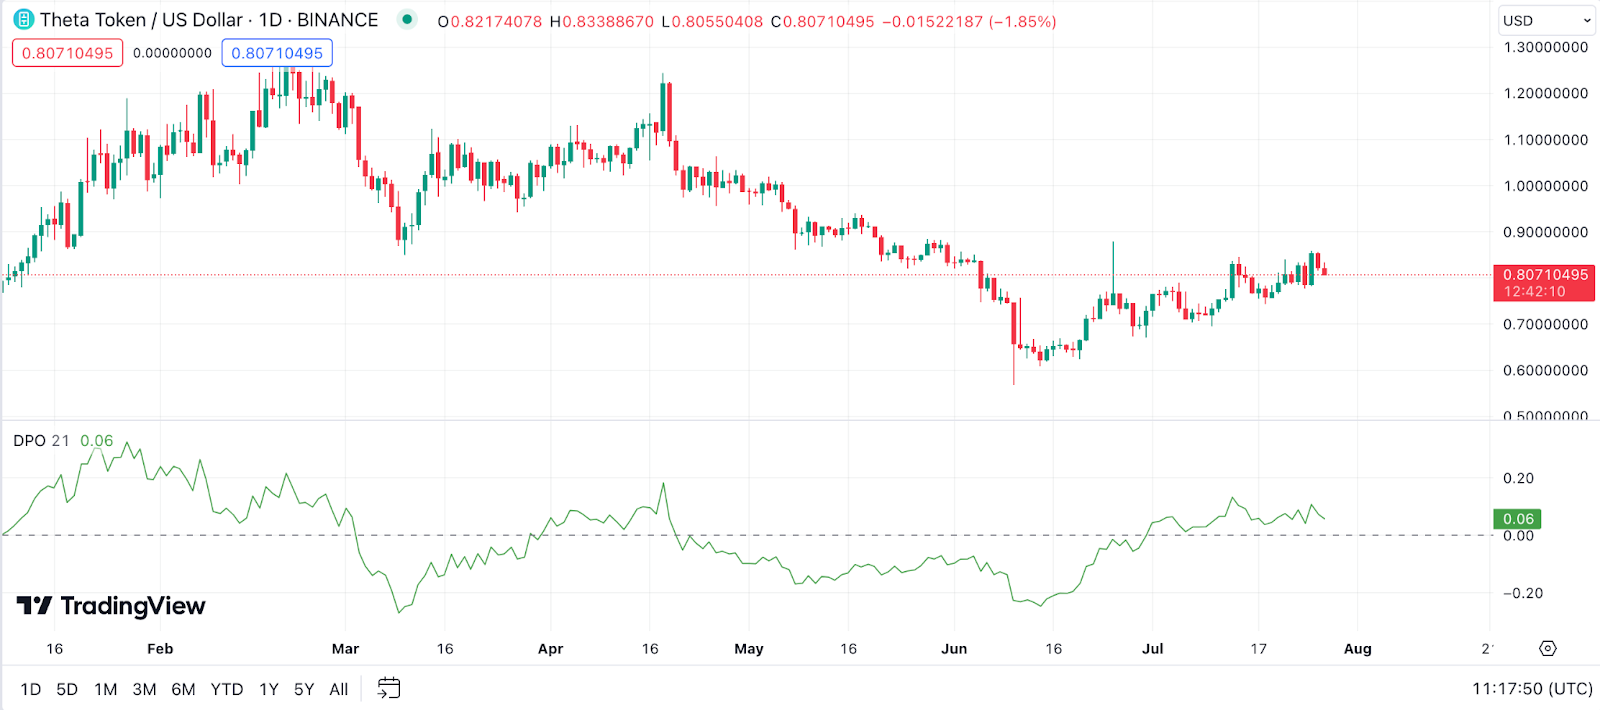
Example: For THETA price prediction, when the DPO moves above zero, it could mean that price is likely in an upward cycle. Conversely, when it moves below zero, it could mean that the price is in a downward cycle. These insights could help traders to potentially time their buys and sells.
Vortex Indicator (VI) for Theta Network Price Prediction
The Vortex Indicator (VI) is designed to identify the start of a new trend or confirm an ongoing trend. It consists of two oscillating lines – VI+ and VI-.
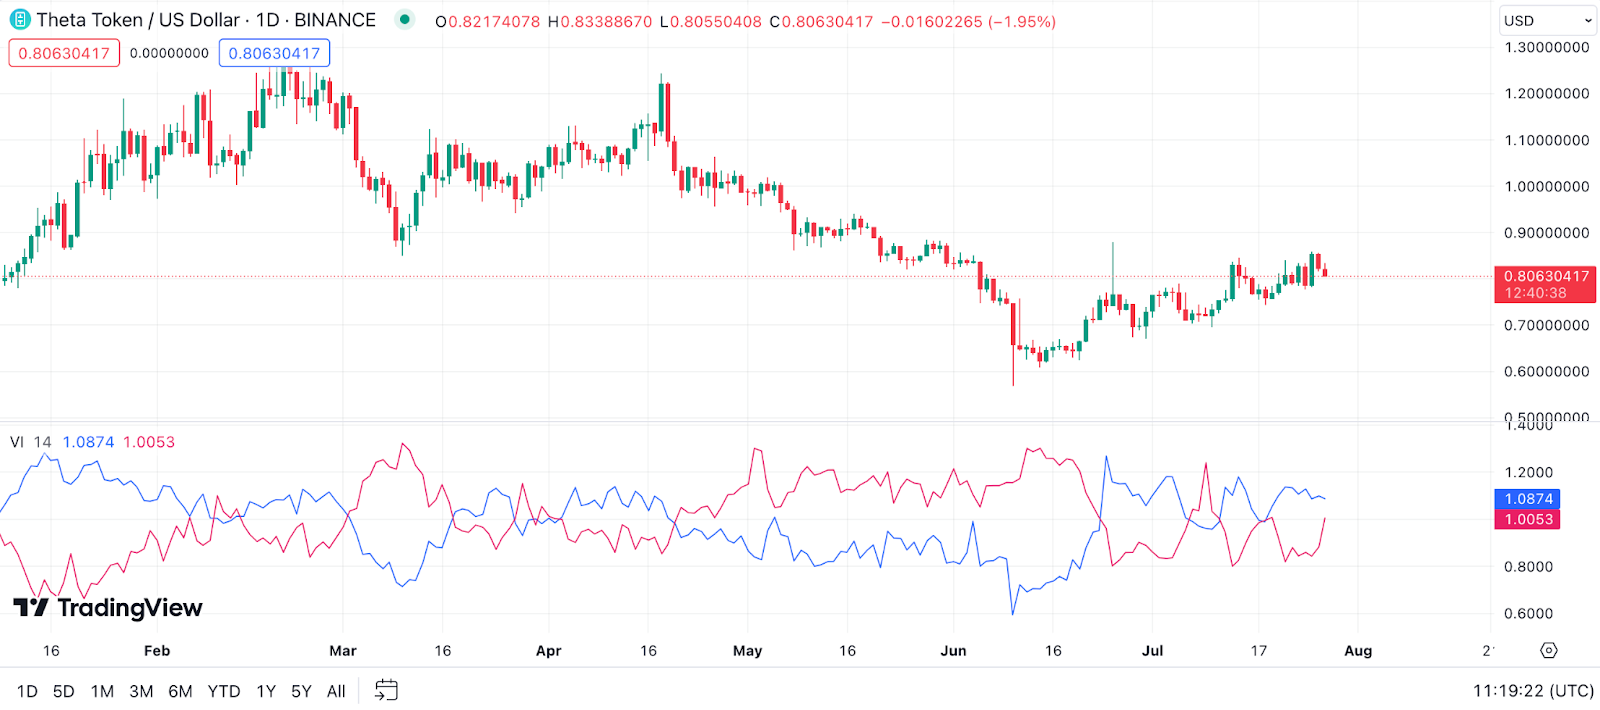
Example: For THETA price prediction, a bullish trend could be indicated when VI+ crosses above VI-. Conversely, when VI- crosses above VI+, it could suggest a bearish trend. As with all indicators, it’s essential to use the Vortex Indicator in conjunction with other analysis tools to make sound trading decisions.
Elder’s Force Index (EFI) for Theta Network Price Prediction
Elder’s Force Index (EFI) is an indicator that uses price and volume to assess the power behind a move or identify potential turning points.
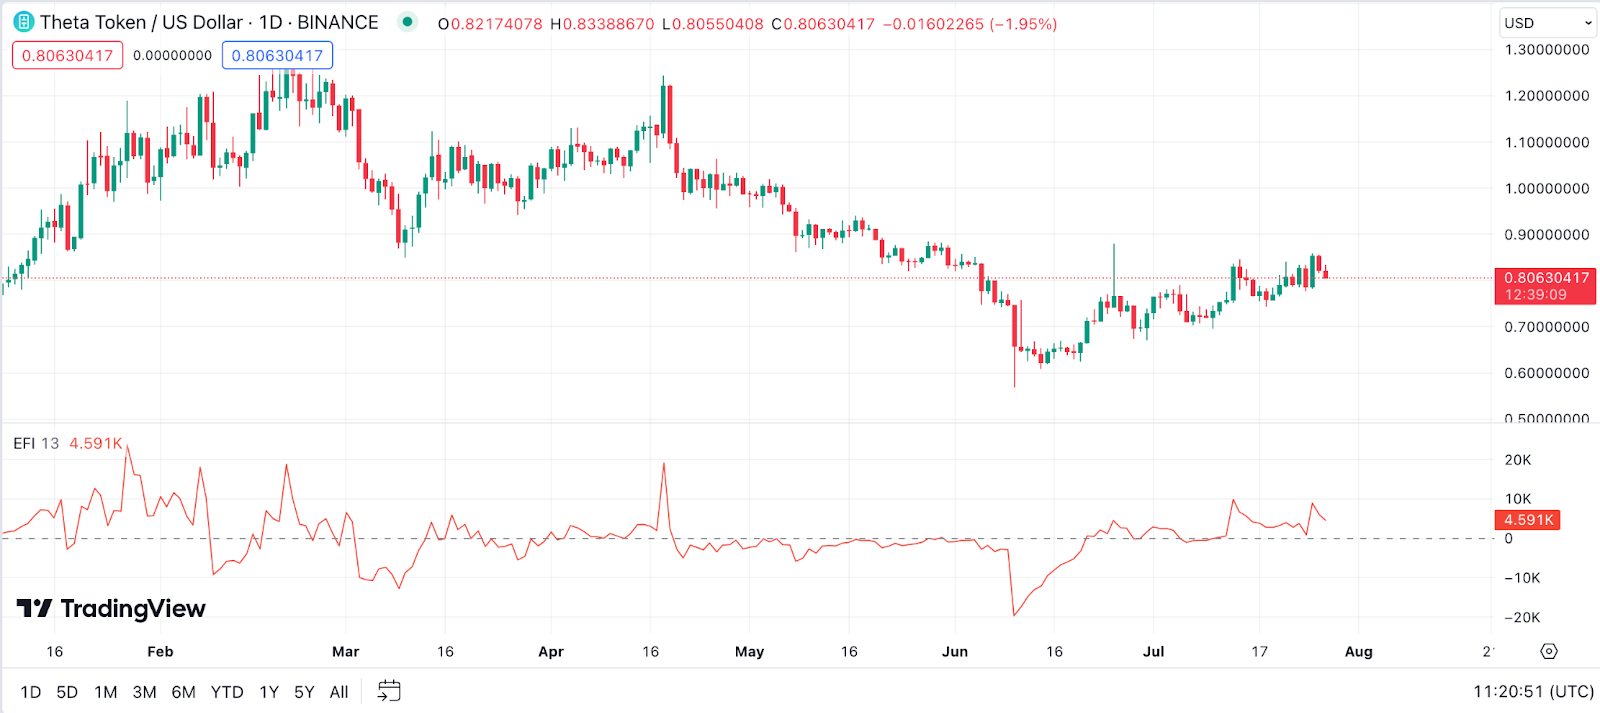
Example: For THETA price prediction, positive values of EFI may suggest buying pressure or bullish activity, whereas negative EFI values could indicate selling pressure or bearish activity. Extreme values of EFI could also denote overbought or oversold conditions, which could potentially precede a price reversal. It’s important to remember that the EFI should be used with other indicators to confirm signals and avoid false alarms.
Williams %R for Theta Network Price Prediction
Williams %R, also known as the Williams Percent Range, is a type of momentum indicator that moves between 0 and -100 and measures overbought and oversold levels.
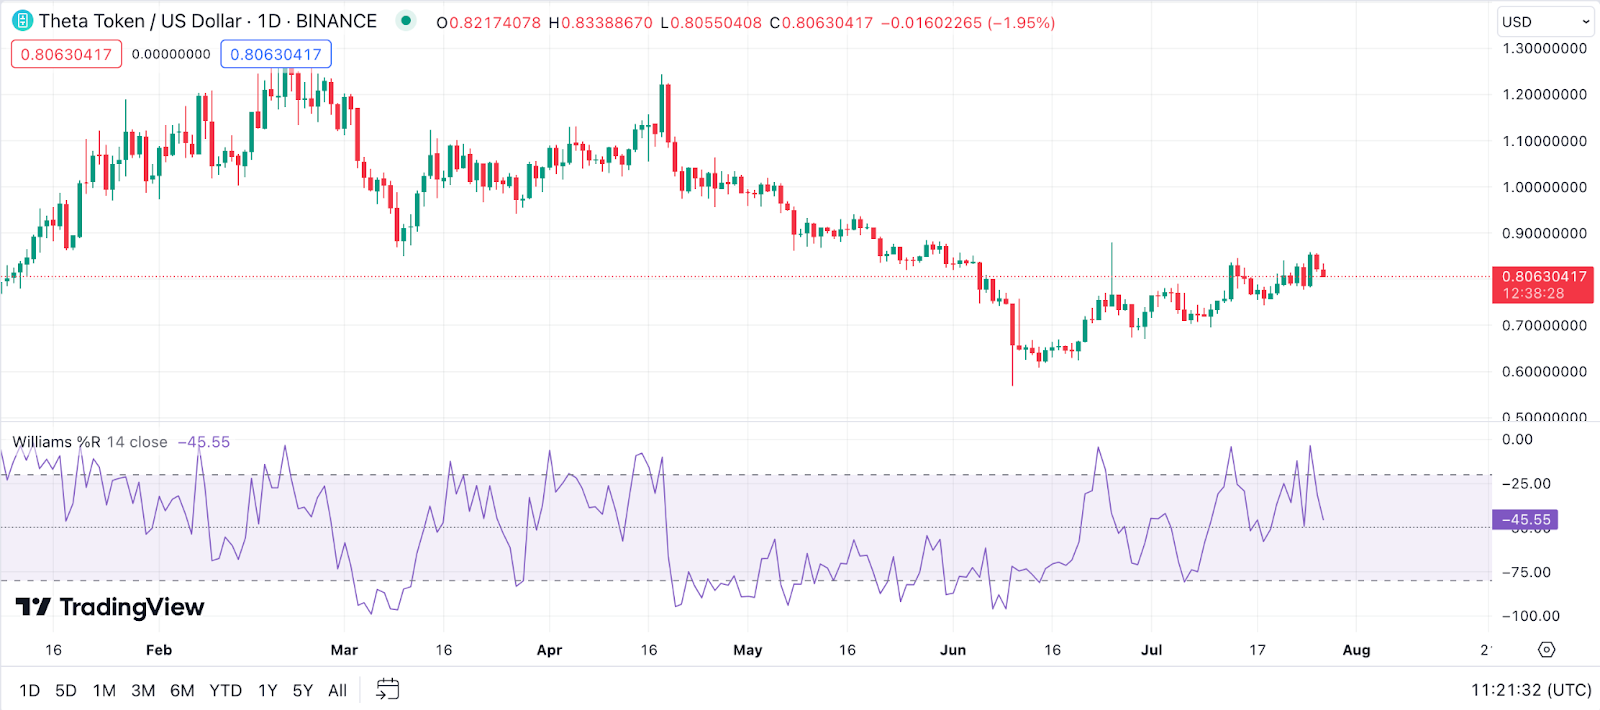
Example: In the context of THETA price prediction, a reading above -20 is generally considered overbought, suggesting that it may be overvalued and a bearish price reaction could be forthcoming. Conversely, if Williams %R dips below -80, this could suggest that THETA is oversold and undervalued, indicating a potential bullish reaction in the future.
Combining Technical Indicators for Accurate Theta Network Price Prediction
In the realm of crypto trading, a single technical indicator might not be sufficient to make a thorough prediction. As a result, many seasoned traders prefer to employ a combination of technical indicators. Let’s delve into why that’s important and how it can be achieved.
The Importance of Using Multiple Technical Indicators
When it comes to predicting the price of Theta Network, or any other cryptocurrency for that matter, one single technical indicator may not provide the full picture. Just as in a puzzle, each indicator only provides a single piece of the larger image. While a single piece can give some insight, it’s when we start putting the pieces together that the full picture, and thus a more accurate prediction, starts to emerge. By using multiple indicators, traders can better understand the various market dynamics at play and make a more informed prediction about future price movements.
How to Combine Various Indicators for THETA Price Prediction
It’s important to note that not all technical indicators should be used together. For a comprehensive and accurate analysis, consider the following tips on how to effectively combine different indicators:
- Use Indicators That Complement Each Other: Some indicators tend to give similar information. Using two of these together may not provide much additional insight. Instead, try to use indicators that complement each other. For example, a volume-based indicator like OBV can be used alongside a momentum-based indicator like RSI.
- Use Indicators From Different Categories: Tech indicators can be divided into different categories, such as trend, momentum, volatility, and volume. Using one indicator from each category can provide a more holistic view of the market.
- Watch out for Contradictions: If two indicators give contradicting signals, it may be best to wait until the market provides a clearer signal.
- Less is More: While it may be tempting to use as many indicators as possible, this could lead to analysis paralysis. It’s better to choose a handful of indicators that you understand well.
- Diversify Timeframes: Using indicators over different timeframes can give insight into both short-term and long-term trends. For example, using a 14-day RSI alongside a 50-day MA can help assess both short-term momentum and longer-term trend direction.
- Adjust Settings Based on the Asset: The same indicator settings may not work well across different assets. It’s important to adjust the settings of your indicators based on the volatility and other characteristics of the asset you’re analyzing.
- Practice and Learn: The best way to get better at using indicators is through practice and learning. Try out different combinations, study past trends and results, and always aim to improve your analysis skills.
- Risk Management: Even with the most sophisticated combination of tech indicators, the risk of trading can never be eliminated completely. It’s always crucial to have a solid risk management strategy in place, regardless of what the indicators might suggest.
By using these strategies, you can combine different tech indicators to provide a more accurate Theta Network price prediction. Just remember that no strategy is foolproof, and it’s important to also consider fundamental analysis and news events.
The Pillars of Theta Network Prediction: Fundamental Factors
Decoding the price of THETA doesn’t just rest on technical analysis. There’s more to the puzzle. The more intriguing part lies within the underlying fundamental factors. Let’s explore the role these factors play in Theta Network price prediction.
Adoption Rate
Adoption rate serves as an essential litmus test for any cryptocurrency, THETA included. A higher adoption rate signifies more users and, consequently, a higher demand for the token. Various factors can help gauge the adoption rate of THETA:
- Number of Active Addresses: A higher number of active addresses on the Theta network indicates an increasing user base and adoption rate.
- Transaction Count: More transactions on the Theta network usually suggest a higher level of activity and utility.
- Partnerships: Strategic partnerships with prominent platforms can propel the adoption rate by providing THETA with more exposure and utility.
- Network Growth: A growing network, whether in terms of users, guardian nodes, or developers, can directly contribute to the increase in adoption rate.
- Integration and Acceptance: Wider integration and acceptance of THETA on various platforms, for payments or transactions, is a positive sign of adoption.
- Market Capitalization: Though not an exact measure of adoption, a larger market cap often reflects higher adoption and confidence in the asset.
- Social Media Mentions and Trends: Increasing mentions and discussions about THETA on social media platforms can indicate growing interest and adoption among the general public.
The adoption rate can significantly influence the THETA price, as a higher adoption rate typically translates into more demand, potentially driving up the price. It’s important to monitor these indicators to have a clear understanding of THETA’s market position and future potential.
Regulatory Developments
Regulatory developments significantly impact the landscape of cryptocurrencies, with THETA being no exception. Regulatory changes, depending on their nature, can either spur growth or stifle progress. Here are a few examples of how these shifts might influence THETA price:
- Regulatory Approval: If a regulatory body, such as the SEC, were to recognize THETA or the overall cryptocurrency industry favorably, this could spur a significant price increase due to boosted investor confidence.
- Ban or Restrictions: On the contrary, if a significant market like China or the U.S imposes a ban or stringent regulations on crypto trading, it could lead to a price drop.
- Tax Laws: Changes in tax laws for cryptocurrencies can influence investment behavior. For instance, stricter tax laws might deter potential investors, affecting price.
- AML and KYC Regulations: Enhancements in Anti-Money Laundering (AML) and Know Your Customer (KYC) procedures can increase trust in the network, potentially pushing prices up.
- Legislation on Security & Privacy: Laws protecting user data and ensuring transaction security could attract more users to THETA, potentially driving prices higher.
- Cross-Border Regulations: Rules that ease or complicate cross-border transactions can directly impact the usage and price of THETA.
- Changes in Legal Status: The transition of THETA’s legal status in significant markets can drastically affect its demand and price.
Given the dynamic regulatory landscape for cryptocurrencies, staying updated with these developments is crucial. It allows investors to anticipate possible price movements and plan their investment strategies accordingly.
Utility
The utility of a cryptocurrency is its real-world applicability and usefulness, which can directly affect its value. THETA, as a decentralized video delivery network, has many use-cases that contribute to its increasing adoption and potential value appreciation. Here are a few examples:
- Decentralized Video Streaming: THETA’s main proposition is to offer a decentralized video streaming service that reduces the cost of content delivery and ensures high-quality video streams, particularly for users in remote areas. This unique offering has the potential to disrupt traditional CDN services, adding significant value to THETA.
- Edge Caching: With THETA’s edge caching, users can earn rewards in the form of THETA tokens by sharing excess bandwidth and computing resources. This feature not only ensures efficient bandwidth usage but also incentivizes user participation.
- End-to-End Decentralization: Unlike many platforms offering partial decentralization, THETA ensures complete decentralization from video ingestion to distribution. This feature enhances the trust and reliability of the network.
- Token Staking: Users can stake THETA tokens to secure the network and earn TFUEL, THETA’s native token, as a reward. This staking mechanism adds value to THETA tokens and encourages long-term holding.
- Integration with Esports and VR Platforms: THETA has potential integrations with Esports and Virtual Reality platforms, giving it access to these burgeoning markets.
- Strategic Partnerships: THETA has formed partnerships with prominent tech firms like Google and Samsung, lending credibility and expanding its potential user base.
- Content Creators and Viewers Rewarding System: THETA’s unique model allows content creators and viewers to earn rewards, making it more attractive for the ever-growing online content community than traditional content delivery networks.
Given these compelling use cases, THETA’s utility goes beyond mere speculation, contributing to its long-term value proposition.
Market Sentiment: How THETA News Prediction Works
Market sentiment plays a critical role in the price movement of a cryptocurrency like THETA. It’s the collective attitude of investors towards the market or a particular asset. Given the highly speculative and volatile nature of crypto markets, sentiment can significantly influence price trends. Here are some factors and tools used to gauge the market sentiment for THETA:
- Social Media Monitoring: Twitter, Reddit, and Telegram are rich sources of data to understand investor sentiment. Tools that track hashtags, mentions, and general discussions about THETA can provide valuable insights into how the community perceives its value.
- News and Announcements: Significant news events, such as partnerships, new features, regulatory changes, or even rumors, can trigger investor sentiment. Monitoring crypto news websites and THETA’s official channels can help track such developments.
- Trading Volume: A sudden increase in trading volume can indicate strong investor sentiment, either positive or negative, depending on the price direction.
- Google Trends: Google Trends data for search terms related to THETA can provide an indication of the wider public interest in the token.
- Sentiment Analysis Tools: There are several crypto-specific sentiment analysis tools that use AI and machine learning to analyze text from various sources and gauge the overall sentiment.
- Market Surveys: Periodic surveys of investors and traders can provide insights into market sentiment. Though not as immediate as other methods, they can still offer valuable long-term sentiment trends.
- Crypto Fear & Greed Index: This index measures the emotions and sentiments from different sources and crunches them into one simple number. It can be a handy tool to understand the overall market sentiment.
Understanding market sentiment can help predict potential price movements. However, it’s essential to remember that while sentiment is a powerful tool, it should not be the sole factor in making good investment decisions. It’s best to combine it with technical and fundamental analysis for a more comprehensive view.
The Bottom Line: Making Your Own Theta Network’s Price Predictions
Wrapping up our exploration into Theta Network price prediction, we have traversed a vast landscape of data, expert opinions, and various analytic techniques. We analyzed the vital tech indicators, considered strong fundamentals, and took into account the market sentiment. Moreover, we delved into expert forecasts and their outlook on THETA’s future.
However, it’s crucial to remember that predicting the price of a cryptocurrency, THETA in this case, isn’t an exact science but a collection of educated guesses. Always consider multiple analysis methods, stay informed, and exercise caution. Happy investing!
FAQ
When Will THETA Network Go Up?
Forecasting specific timelines for price movements is a tricky endeavor, especially in the volatile world of cryptocurrencies. That said, based on our technical and fundamental analyses, we do foresee potential for THETA to appreciate. The actual timing, however, will depend on various factors such as market sentiment, adoption rates, and broader market trends. Always stay updated with the latest data gathered and market signals.
Should I Buy THETA Network?
Whether to invest in THETA or not largely depends on your personal financial goals, risk tolerance, and belief in the project’s future. It’s crucial to do your own thorough research before making any investment decision. While THETA has shown potential with its unique technology and partnerships, it’s essential to note that investing in cryptocurrencies involves risk and volatility.
How High Can THETA Network Go?
Predicting how high THETA can climb is speculative and depends on many variables such as market trends, technological advancements, adoption rates, and regulatory developments. While experts have made certain projections, it’s vital to approach these with caution. Remember, crypto investments carry inherent risks and should only be a part of a well-diversified portfolio.
Will THETA Network Crash Again in 2024?
Cryptocurrencies are notoriously volatile, and price crashes can and do occur. Predicting whether THETA will experience a crash in 2024 is uncertain. Factors such as regulatory changes, market sentiment, or a broader economic downturn could impact THETA price. However, it’s equally possible for THETA to appreciate given its robust technology and growing adoption. As always, investors should stay informed and prepared for all possibilities.