
Hello, dear readers! Welcome to our comprehensive exploration of Neo’s price forecast stretching from 2024 to 2030. Venturing into the world of cryptocurrency can often feel like navigating a labyrinth with its complex twists and turns. That’s precisely why we’ve dedicated today’s article to the Neo (NEO) ecosystem. We understand that pinning down the future value of any digital asset is notoriously challenging, but fret not; we’re here to guide you through the dense fog of crypto predictions.
Our journey today isn’t just a shot in the dark. We’re going to dive into the annals of Neo’s history, touch upon its inception, and unfold the very purpose that drives its existence. By tapping into the arsenal of tools and techniques that seasoned traders employ, we aim to piece together an NEO forecast that’s as informed as it is insightful. After all, understanding where NEO might be headed is no mere crystal ball gazing; it’s a critical component of good investment planning.
Why is predicting NEO’s future price crucial, you ask? Well, envision NEO as a dynamic puzzle within the vast crypto landscape. Each move it makes affects your investment strategy. Gauging its potential highs and lows enables us to make a calculated investment decision, minimize risks, and potentially maximize returns. Simply put, it’s about staying ahead of the game in an unpredictable market.
So, buckle up as we set off on this thrilling odyssey. Keep reading to arm yourself with knowledge and insights that could make a world of difference in your crypto endeavors. Let’s dive in and decrypt the future of NEO together!
Neo (NEO) Overview
| NEO Price | $6.32 |
| NEO Price Change 24h | 7.92% |
| NEO Price Change 7d | 13.49% |
| NEO Market Capitalization (Market Cap) | $445,560,265.76 |
| NEO Circulating Supply | 70,538,831.00 |
| NEO Trading Volume | $55,616,564.63 |
| NEO All-Time High (ATH) | $196.85 |
| NEO All-Time Low (ATL) | $0.07229 |
A Brief History: Neo and Its Purpose
Embarking on a narrative about Neo, we’re not just recounting a tale of another cryptocurrency. This is a story of ambition, innovation, and a steadfast purpose. Neo blockchain, often hailed as the Ethereum of China, was born with the vision to create a smart economy.
It’s an ecosystem where digital assets, digital identities, and smart contracts make for a seamless and futuristic economic model. With the inception of Neo Network came a robust platform for developing decentralized applications (dApps), standing out with its unique delegated Byzantine Fault Tolerance (dBFT) consensus mechanism, which aimed to deliver a more energy-efficient and faster transactional experience.
Neo’s purpose was always clear-cut: to bridge the gap between the traditional economy and the digital one, leveraging the power of blockchain. It’s about more than just creating a cryptocurrency; it’s about fostering a comprehensive framework for the next generation of the internet — the so-called “Web 3.0.” And with that, Neo sought to empower its users with full control over their digital assets, ensuring security, trust, and compliance with local regulations. This dual-token model, with NEO and GAS, further exemplified its unique proposition, offering both a stake in the network and the “fuel” for deploying smart contracts and dApps.
Now, let’s shift gears and look at the historical price movements of NEO with a segment dedicated to its most notable fluctuations.
Noteworthy Fluctuations in Neo’s Price
The valuation of NEO has experienced its fair share of peaks and troughs, embodying the volatile spirit of the crypto market. Here’s an encapsulation of its most remarkable price movements:
- The Initial Surge: Neo made headlines with its meteoric rise in the bull run of late 2017, catapulting its worth to unprecedented heights.
- Correction Waves: Like many of its peers, NEO value wasn’t spared from the massive corrections that swept the crypto landscape in early 2018.
- The Steady Climb: Post-correction, NEO cryptocurrency demonstrated resilience with a steady climb back up the price ladder, albeit with occasional hiccups.
- Market Dynamics: NEO’s journey has been at the mercy of broader market dynamics, feeling the ripples of investor sentiment and regulatory shifts.
- Innovation Peaks: Notable advancements within the Neo ecosystem often translated into spurts of price appreciation, aligning with new feature releases or updates.
Neo – NEO Price Prediction For Today, Tomorrow, This Week, and Next 30 Days
| Date | Price | Change |
|---|---|---|
| July 12, 2025 | 6.28 | -0.68% |
| July 13, 2025 | 6.32 | 0.65% |
| July 14, 2025 | 6.38 | 0.96% |
| July 15, 2025 | 6.41 | 0.54% |
| July 16, 2025 | 6.38 | -0.44% |
| July 17, 2025 | 6.45 | 1.00% |
| July 18, 2025 | 6.48 | 0.56% |
| July 19, 2025 | 6.45 | -0.57% |
| July 20, 2025 | 6.50 | 0.77% |
| July 21, 2025 | 6.52 | 0.33% |
| July 22, 2025 | 6.47 | -0.73% |
| July 23, 2025 | 6.47 | 0.05% |
| July 24, 2025 | 6.54 | 0.98% |
| July 25, 2025 | 6.48 | -0.81% |
| July 26, 2025 | 6.50 | 0.24% |
| July 27, 2025 | 6.46 | -0.61% |
| July 28, 2025 | 6.48 | 0.22% |
| July 29, 2025 | 6.50 | 0.45% |
| July 30, 2025 | 6.45 | -0.79% |
| July 31, 2025 | 6.44 | -0.20% |
| August 01, 2025 | 6.38 | -0.91% |
| August 02, 2025 | 6.37 | -0.18% |
| August 03, 2025 | 6.31 | -0.91% |
| August 04, 2025 | 6.33 | 0.30% |
| August 05, 2025 | 6.36 | 0.42% |
| August 06, 2025 | 6.42 | 0.94% |
| August 07, 2025 | 6.47 | 0.83% |
| August 08, 2025 | 6.41 | -0.91% |
| August 09, 2025 | 6.47 | 0.95% |
| August 10, 2025 | 6.51 | 0.53% |
Neo Price Prediction 2024
After a meticulous examination of the projected price data for NEO in 2024, we’ve arrived at some intriguing insights. Our analysis indicates a potential minimum price of $5.68. Conversely, NEO average price is anticipated to stabilize around $6.63. Should the market lean towards a bullish stance, we could witness highs soaring up to $7.58.
Looking at the current landscape, NEO’s prospects for 2024 appear promising and exhibit signs of a stable growth pattern. This comparatively steady price prediction hints that we may be fortunate enough to avoid the extremes of market volatility. However, for those who favor a dash of daring in their investments, this could present a prime opportunity for significant returns, especially when you consider NEO’s inherent market fluctuations.
Here’s a piece of investing advice for our cryptocurrency aficionados: proceed with caution. It’s crucial to prioritize thorough research and exhaustive due diligence before diving into any investment, especially in the capricious realm of digital currencies.
| Month | Minimum Price | Average Price | Maximum Price |
|---|---|---|---|
| February 2024 | 10.40 | 10.80 | 11.25 |
| March 2024 | 10.69 | 11.10 | 11.55 |
| April 2024 | 10.97 | 11.40 | 11.86 |
| May 2024 | 11.27 | 11.70 | 12.18 |
| June 2024 | 11.57 | 12.02 | 12.51 |
| July 2024 | 11.89 | 12.34 | 12.85 |
| August 2024 | 12.21 | 12.68 | 13.20 |
| September 2024 | 12.54 | 13.02 | 13.55 |
| October 2024 | 12.88 | 13.37 | 13.92 |
| November 2024 | 13.22 | 13.73 | 14.29 |
| December 2024 | 13.58 | 14.10 | 14.68 |
| January 2025 | 13.95 | 14.48 | 15.08 |
January 2024: Neo Price Forecast
As we embark on a new year, the forecasting models suggest a sturdy beginning for Neo with a minimal price of $9.44, an average hovering around $10.40, and a potential spike to a maximum price of $10.80. This indicates a bullish outset for investors, suggesting that NEO’s fundamentals are gaining solid ground within the crypto community.
NEO Price Forecast for February 2024
In the brisk winter of February, crypto enthusiasts are seeing a warming trend in the Neo market. Based on the price fluctuations of Neo, the forecasted minimum price is $10.40, signaling a solid base for investors to consider. The average price hovers at a comfortable $10.80, offering a middle ground for those playing the long game. Those with an eye for peaks might be intrigued by the maximum price point of $11.25, hinting at potential spikes in the trading landscape.
March 2024: Neo Price Forecast
As March ushers in the first hints of spring, cryptocurrency experts are ready to announce their forecast for Neo. The growth continues with a minimum price of $10.69, reflecting a steady ascent in investor confidence. The average price climbs to $11.10, suggesting a robust market performance. Meanwhile, the maximum price reaches $11.55, providing traders with a glimpse of the possible highs to aim for.
NEO Price Forecast for April 2024
April’s showers bring forth a flourish in the Neo market, as evidenced by the uptick in its valuation. Crypto analysts have checked the price fluctuations of Neo in 2024, and April looks promising with a minimum price of $10.97. The average price is expected to sprout to $11.40, while the maximum price could blossom to $11.86, painting a bullish picture for the month.
May 2024: Neo Price Forecast
In the heart of spring, May’s Neo price forecast reflects the season’s vibrancy. The minimum price is projected at $11.27, indicative of the strong support levels in the market. The average price is anticipated to be $11.70, providing a hopeful outlook for consistent growth. Additionally, a maximum price of $12.18 could be on the horizon, showcasing the potential for notable gains.
NEO Price Forecast for June 2024
As we dive into the summer months, June’s forecast for Neo prices is as bright as the sun. Crypto experts have analyzed Neo prices in 2024, estimating a minimum price of $11.57. This suggests a continued upward trend with the average price expected at $12.02. Investors could also see a maximum price soaring to $12.51, offering a glimpse of summer sizzle in the market.
July 2024: Neo Price Forecast
July’s Neo price forecast brings the heat with predictions of rising figures. According to the latest data gathered, a minimum price of $11.89 could be expected, showing no signs of the market cooling down. The average price is set to climb to $12.34, while the maximum price could reach a fiery $12.85, possibly setting off fireworks in the trading world.
NEO Price Forecast for August 2024
August’s Neo price prediction continues the summer trend with positive growth. According to the technical analysis of Neo prices expected, a sturdy minimum price of $12.21 sets the stage. The average price is seen at $12.68, offering a steady climb for mid-summer investments. The maximum price is predicted to hit $13.20, hinting at the potential for lucrative peaks during this period.
September 2024: Neo Price Forecast
As the leaves begin to turn, September’s Neo price forecast reflects a season of change with upward momentum. The minimum price is set to rise to $12.54, showcasing a solid foundation. The average price is expected to increase to $13.02, mirroring the gradual shift in seasons. With a maximum price of $13.55, the potential for growth remains strong as the year progresses.
NEO Price Forecast for October 2024
October’s forecast for Neo is as crisp as the autumn air, with numbers that promise a harvest of opportunities. Crypto experts expect the average price to be around $13.37, nestled comfortably between a minimum price of $12.88 and a potential maximum of $13.92. This suggests a stable yet ascending market that could yield fruitful returns.
November 2024: Neo Price Forecast
Diving into the numbers for November 2024, our research suggests NEO could have quite the dynamic month. We’re looking at a minimal price of $13.22, which could be the floor for traders looking to get in. The average trading price, however, is expected to float around $13.73, suggesting that NEO might see steady mid-month trading. For those with an eye on the prize, the maximum price might just touch an impressive $14.29, painting a bullish end to the month for this digital asset.
NEO Price Forecast for December 2024
As 2024 winds down, the momentum behind NEO seems to be gearing up, according to our analyses. December could welcome a minimal price point of $13.58, offering a slightly higher threshold than the previous month. On average, we’re looking at figures around $14.10, indicating consistent growth as the year closes. And if the bulls have their way, we might see a maximum price surge up to $14.68, which could set a festive mood for savvy investors.
Neo Price Prediction 2025
Looking ahead to 2025, our trend lines suggest a slight uptick in NEO’s financial thermometer. The minimal price forecast sits at $16.79, suggesting a gentle climb from the previous year’s floor. The heart of the market might beat at an average price of $19.92, likely reflecting a calm ascent in investor confidence. And should the winds favor NEO’s sails, we may witness a maximum price peak at $23.70, giving traders a reason to stay glued to their screens.
| Month | Minimum Price | Average Price | Maximum Price |
|---|---|---|---|
| February 2025 | 16.79 | 17.44 | 18.15 |
| March 2025 | 17.25 | 17.91 | 18.64 |
| April 2025 | 17.71 | 18.39 | 19.15 |
| May 2025 | 18.19 | 18.89 | 19.66 |
| June 2025 | 18.68 | 19.40 | 20.19 |
| July 2025 | 19.19 | 19.92 | 20.74 |
| August 2025 | 19.70 | 20.46 | 21.30 |
| September 2025 | 20.24 | 21.01 | 21.88 |
| October 2025 | 20.78 | 21.58 | 22.47 |
| November 2025 | 21.34 | 22.16 | 23.07 |
| December 2025 | 21.92 | 22.76 | 23.70 |
| January 2026 | 22.51 | 23.38 | 24.34 |
Neo Price Prediction 2026
For 2026, the digits lining our charts paint an intriguing picture for NEO. With a minimal price pegged at $22.26, it’s a number that might just become the year’s springboard for higher leaps. The average price is calculated to hover around $26.41, possibly mirroring a year of incremental, yet solid gains. Meanwhile, the maximum price is anticipated to reach $31.41, possibly presenting a ceiling that only the most bullish market days will touch.
| Month | Minimum Price | Average Price | Maximum Price |
|---|---|---|---|
| February 2026 | 22.26 | 23.12 | 24.07 |
| March 2026 | 22.86 | 23.74 | 24.72 |
| April 2026 | 23.48 | 24.38 | 25.38 |
| May 2026 | 24.11 | 25.04 | 26.07 |
| June 2026 | 24.77 | 25.72 | 26.77 |
| July 2026 | 25.43 | 26.41 | 27.49 |
| August 2026 | 26.12 | 27.12 | 28.24 |
| September 2026 | 26.83 | 27.86 | 29.00 |
| October 2026 | 27.55 | 28.61 | 29.78 |
| November 2026 | 28.29 | 29.38 | 30.59 |
| December 2026 | 29.06 | 30.18 | 31.41 |
| January 2027 | 29.84 | 30.99 | 32.26 |
Neo Price Prediction 2027
When we tunnel through the data towards 2027, NEO’s price journey appears to continue its steady climb. The minimal price could potentially firm up at $29.51, a number that may well serve as a strong support level for the year. An average price of $35.01 could be the norm, indicating a continued maturation of the market’s view of NEO. And for those chasing the highs, a maximum price of $41.64 might just be on the horizon, offering lofty goals for the eagle-eyed trader.
| Month | Minimum Price | Average Price | Maximum Price |
|---|---|---|---|
| February 2027 | 29.51 | 30.65 | 31.90 |
| March 2027 | 30.31 | 31.47 | 32.76 |
| April 2027 | 31.13 | 32.32 | 33.65 |
| May 2027 | 31.97 | 33.20 | 34.56 |
| June 2027 | 32.83 | 34.09 | 35.49 |
| July 2027 | 33.72 | 35.01 | 36.45 |
| August 2027 | 34.63 | 35.96 | 37.43 |
| September 2027 | 35.56 | 36.93 | 38.44 |
| October 2027 | 36.52 | 37.93 | 39.48 |
| November 2027 | 37.51 | 38.95 | 40.55 |
| December 2027 | 38.52 | 40.00 | 41.64 |
| January 2028 | 39.56 | 41.08 | 42.77 |
Neo Price Prediction 2028
Forecasting into 2028, the numbers indicate that NEO could be setting its sights higher on the price ladder. The minimal price is projected to notch up to $39.12, perhaps reflecting a growing floor of investor trust. With an average price earmarked at $46.42, it suggests a year where stability becomes synonymous with NEO. And should market sentiment soar, a maximum price of $55.21 could be the year’s crowning glory, tantalizing the ambitions of crypto enthusiasts.
| Month | Minimum Price | Average Price | Maximum Price |
|---|---|---|---|
| February 2028 | 39.12 | 40.63 | 42.29 |
| March 2028 | 40.18 | 41.73 | 43.44 |
| April 2028 | 41.27 | 42.85 | 44.61 |
| May 2028 | 42.38 | 44.01 | 45.81 |
| June 2028 | 43.52 | 45.20 | 47.05 |
| July 2028 | 44.70 | 46.42 | 48.32 |
| August 2028 | 45.91 | 47.67 | 49.62 |
| September 2028 | 47.15 | 48.96 | 50.96 |
| October 2028 | 48.42 | 50.28 | 52.34 |
| November 2028 | 49.73 | 51.64 | 53.75 |
| December 2028 | 51.07 | 53.03 | 55.21 |
| January 2029 | 52.45 | 54.46 | 56.70 |
Neo Price Prediction 2029
As we zoom into 2029, the financial contours of NEO seem etched with optimistic strokes. The minimal price stands at $51.87, possibly signaling that NEO’s value proposition remains robust in the face of changing tides. The average price, standing proud at $61.54, may indicate a year of healthy trading volumes and investor engagement. The maximum price aim is at a robust $73.19, offering a glimpse of what peak performance could look like in the year.
| Month | Minimum Price | Average Price | Maximum Price |
|---|---|---|---|
| February 2029 | 51.87 | 53.87 | 56.07 |
| March 2029 | 53.27 | 55.32 | 57.59 |
| April 2029 | 54.71 | 56.81 | 59.14 |
| May 2029 | 56.19 | 58.35 | 60.74 |
| June 2029 | 57.71 | 59.92 | 62.38 |
| July 2029 | 59.26 | 61.54 | 64.06 |
| August 2029 | 60.86 | 63.20 | 65.79 |
| September 2029 | 62.51 | 64.91 | 67.57 |
| October 2029 | 64.20 | 66.66 | 69.40 |
| November 2029 | 65.93 | 68.46 | 71.27 |
| December 2029 | 67.71 | 70.31 | 73.19 |
| January 2030 | 69.54 | 72.21 | 75.17 |
Neo Price Prediction 2030
The turn of the decade could herald a new chapter for NEO, with our sights set on a minimal price of $68.78, a testament to the asset’s potential enduring appeal. The market’s pulse is expected to beat at an average price of $81.59, perhaps mirroring a decade of accumulated wisdom and market maturity. On the upper end, a maximum price of $97.04 could be within reach, sparking dreams of what a well-timed investment could yield.
| Month | Minimum Price | Average Price | Maximum Price |
|---|---|---|---|
| February 2030 | 68.78 | 71.42 | 74.35 |
| March 2030 | 70.63 | 73.35 | 76.35 |
| April 2030 | 72.54 | 75.33 | 78.41 |
| May 2030 | 74.50 | 77.36 | 80.53 |
| June 2030 | 76.51 | 79.45 | 82.71 |
| July 2030 | 78.57 | 81.59 | 84.94 |
| August 2030 | 80.70 | 83.80 | 87.23 |
| September 2030 | 82.88 | 86.06 | 89.59 |
| October 2030 | 85.11 | 88.38 | 92.01 |
| November 2030 | 87.41 | 90.77 | 94.49 |
| December 2030 | 89.77 | 93.22 | 97.04 |
| January 2031 | 92.19 | 95.74 | 99.66 |
Neo Price Prediction 2031
Projecting forward to 2031, NEO’s value trajectory appears to be on an upward trend, with a minimal price forecast of $91.18, which could solidify its status as a mature asset. The average price is anticipated to be a stable $108.17, perhaps reflective of a market that values consistency. The top-tier potential for the year places the maximum price at $128.65, a figure that could satiate the appetites of high-stakes traders.
| Month | Minimum Price | Average Price | Maximum Price |
|---|---|---|---|
| February 2031 | 91.18 | 94.68 | 98.56 |
| March 2031 | 93.64 | 97.24 | 101.22 |
| April 2031 | 96.17 | 99.86 | 103.96 |
| May 2031 | 98.76 | 102.56 | 106.76 |
| June 2031 | 101.43 | 105.33 | 109.64 |
| July 2031 | 104.17 | 108.17 | 112.60 |
| August 2031 | 106.98 | 111.09 | 115.65 |
| September 2031 | 109.87 | 114.09 | 118.77 |
| October 2031 | 112.84 | 117.17 | 121.97 |
| November 2031 | 115.88 | 120.33 | 125.27 |
| December 2031 | 119.01 | 123.58 | 128.65 |
| January 2032 | 122.22 | 126.92 | 132.12 |
Neo Price Prediction 2032
Peering into the crystal ball for 2032, NEO’s fiscal forecast appears sunny. The minimal price is estimated to edge up to $120.88, potentially indicating a base level of unwavering investor support. With the average price predicted at $143.41, the narrative for NEO could be one of steadfast progress. And with a maximum price of $170.56, the horizon for NEO might just be gleaming with a promise for those who’ve buckled in for this long-term ride.
| Month | Minimum Price | Average Price | Maximum Price |
|---|---|---|---|
| February 2032 | 120.88 | 125.52 | 130.67 |
| March 2032 | 124.14 | 128.91 | 134.19 |
| April 2032 | 127.49 | 132.39 | 137.82 |
| May 2032 | 130.93 | 135.96 | 141.54 |
| June 2032 | 134.47 | 139.64 | 145.36 |
| July 2032 | 138.10 | 143.41 | 149.28 |
| August 2032 | 141.83 | 147.28 | 153.32 |
| September 2032 | 145.66 | 151.25 | 157.46 |
| October 2032 | 149.59 | 155.34 | 161.71 |
| November 2032 | 153.63 | 159.53 | 166.07 |
| December 2032 | 157.78 | 163.84 | 170.56 |
| January 2033 | 162.04 | 168.26 | 175.16 |
The Main Questions Of Critical Thinking When We Talk About Neo Price Forecast
In the speculative landscape of cryptocurrency investment, critical thinking is our compass. This is especially true for NEO, where price forecasts are as dynamic as they are uncertain. Before we dive into the depths of NEO’s future value, let’s arm ourselves with pivotal questions that cut through the complexities of market predictions, ensuring our decisions are informed and our strategies sound.
- What historical data and trends are being used to inform the NEO price forecast?
- How have similar cryptocurrencies behaved in the market, and can this be a reliable indicator for NEO’s future?
- What external factors, such as market sentiment or global economic events, could impact the NEO price prediction?
- How does the technology behind NEO compare to other blockchain platforms, and could this influence its value?
- What are the potential risks associated with NEO that could adversely affect its price?
- How might regulatory changes in major cryptocurrency markets affect the price of NEO?
- What volume of NEO is currently being traded, and how does market liquidity affect price volatility?
- Are there any upcoming NEO developments or updates that could potentially alter its price trajectory?
- How do the supply dynamics, such as the total and circulating supply of NEO, play into price predictions?
- What role do institutional investors play in the NEO market, and how might their actions influence long-term forecasts?
- How do we account for the impact of market manipulation or “whales” in the NEO price forecasts?
- In what ways could advancements in quantum computing affect the security of NEO and its market price?
- How does the NEO community’s strength and engagement impact the long-term value of the cryptocurrency?
- What are the technological scalability prospects for NEO, and how could this affect future price?
- How does the price prediction account for the competition from newer or more advanced blockchain platforms?
- What is the level of developer activity on the NEO platform, and how could this correlate with its market price?
- How might changes in user adoption rates impact the demand and price forecast for NEO?
- Are there correlations between NEO’s price movements and those of major cryptocurrencies like Bitcoin and Ethereum?
- How could potential partnerships or collaborations with other companies or blockchains affect NEO’s price?
- What contingency plans exist for NEO in the face of a major cybersecurity breach, and how could this influence investor confidence and price?
The questions presented are not mere curiosities but essential tools for investors aiming to navigate the cryptic waters of cryptocurrency valuations. They compel us to look beyond the numbers and consider the broader market narrative, thus paving the way for more thoughtful and resilient investment choices.
Neo (NEO) Future Price Predictions by Experts
Exploring insights from industry experts and analysts provides a glimpse into the potential future price of NEO. While these multiple viewpoints come from experienced professionals, it’s important to remember that they should not be taken as investment advice.
- WalletInvestor: According to WalletInvestor’s analysis, NEO coin is predicted to be a poor long-term investment with a price forecast of $0.54 by the end of 2024. They suggest that a 5-year investment could potentially see a decrease in value.
- Digital Coin Price: Digital Coin Price’s NEO price prediction indicates that the coin’s value is anticipated to reach approximately $34.81 by the end of 2025.
- Long Forecast: Long Forecast has projected that NEO’s price may face a downturn, with an expected correction to around $10.27 by the end of 2024.
- GOV Capital: GOV Capital’s NEO prediction estimates that the coin’s price is likely to stabilize at about $16.11 by the end of 2024.
Decoding the Charts: NEO Technical Price Analysis
Let me take you through a little journey across the landscape of charts and graphs where the heartbeat of NEO’s price can be seen through the lens of technical analysis. For those of you with a keen eye for detail, this is where the action happens – in the squiggles, the peaks, and troughs of price movements. Here’s a handy list of concepts and tools that chart enthusiasts use to divine the possible paths of NEO:
- Price Charts: Indispensable to technical analysts, the NEO price chart is available in various forms, including line, bar, and the more intricate candlestick patterns. They offer a visual history of price action, shedding light on potential market direction and trends.
- Trend Analysis: The crux of technical analysis lies in determining the prevailing trend. Uptrends are typified by consistently higher highs and lows, while downtrends are distinguished by lower highs and lows. Identifying these patterns is essential for understanding market sentiment.
- Support and Resistance Levels: Support levels serve as a floor that prices tend to bounce off of, while resistance levels act as ceilings that prices struggle to break through. These key levels are instrumental for traders to determine strategic trading positions.
- Technical Indicators: These are crucial mathematical instruments utilized by analysts to decipher market trends and momentum. Renowned indicators include moving averages, the Relative Strength Index (RSI), the Moving Average Convergence Divergence (MACD), and Bollinger Bands, among others.
- Price Chart Patterns: Technical analysts scrutinize the charts for distinct patterns, much like detectives seeking clues. Recognizable patterns such as head and shoulders, double tops and bottoms, triangles, and flags are considered harbingers of potential price movements.
- Volume Analysis: The examination of trading volume provides insights into the strength of price trends. An uptick in volume accompanying a price rise suggests a bullish trend, while a decrease in volume during a price drop may indicate a weakening bearish trend.
- Timeframes: Technical analysis is adaptable to various timeframes, which allows analysts to scale their methods to suit short-term intraday charts or broader weekly or monthly perspectives, aligning with their strategic goals.
Technical Indicators: Origin and Purpose
Technical indicators, those quintessential tools of market analysis, were born out of a need to transform raw, chaotic market data into a form that’s palatable for strategy and decision-making. Their development was pioneered for stock markets but their versatility allowed them to seep into the realm of commodities, forex, and of course, our digital currency waters – including NEO. These indicators serve as the alchemists of the trading world, attempting to transmute historical price data and volume into golden predictions of future market activity.
In the context of NEO, these indicators aren’t just mere tools but are often the lifeline for traders looking to ride the waves of this volatile market. They act as both the map and compass – where the map is the historical price action of NEO, and the compass, the indicators that suggest where the price might head next. It’s a blend of art and science, interpreting what these indicators are signaling, and while they aren’t foolproof prophecies, they are invaluable in the hands of those who can read them well.
The Role of Technical Indicators in Financial Markets
Technical indicators play a pivotal role in the arsenal of traders and analysts. By transforming price action into accessible signals, these indicators inform decisions on when to buy, sell, or hold an asset. In the fast-paced world of cryptocurrency trading, they are particularly valuable in discerning the probable movements in the prices of digital assets, such as NEO.
Whether it’s a moving average that smooths out price fluctuations to identify trends, or oscillators that help pinpoint overbought or oversold conditions, technical indicators are the compasses by which traders navigate the tumultuous sea of the markets.
How Technical Indicators Can Help Predict Neo Price
Now, when it comes to NEO, these indicators can be akin to a crystal ball. By analyzing past price actions and volumes, they help form a picture of what might come next. For instance, if NEO’s RSI is soaring high, it might be time to buckle up for a potential price drop. Conversely, if NEO is bottoming out on the RSI, it might just be getting ready to take us to the moon.
Gaining a solid understanding of the primary tech indicators is crucial, especially when diving into NEO price analysis and forecasting NEO’s potential value. In this section, I’ll outline the fundamental indicators that have profoundly impacted my trading journey. Furthermore, I’ll provide practical examples to demonstrate their effective application in predicting NEO’s price movements.
Moving Averages (MAs) for Neo Price Prediction
Moving Averages (MAs) are pivotal in technical analysis for identifying trends in NEO’s price. By averaging out NEO’s price over a set period, MAs can show a smoothed trend line, mitigating the impact of random price spikes. Traders often watch for the crossover of a short-term MA above a long-term MA as a bullish sign, or the crossover below as a bearish sign.
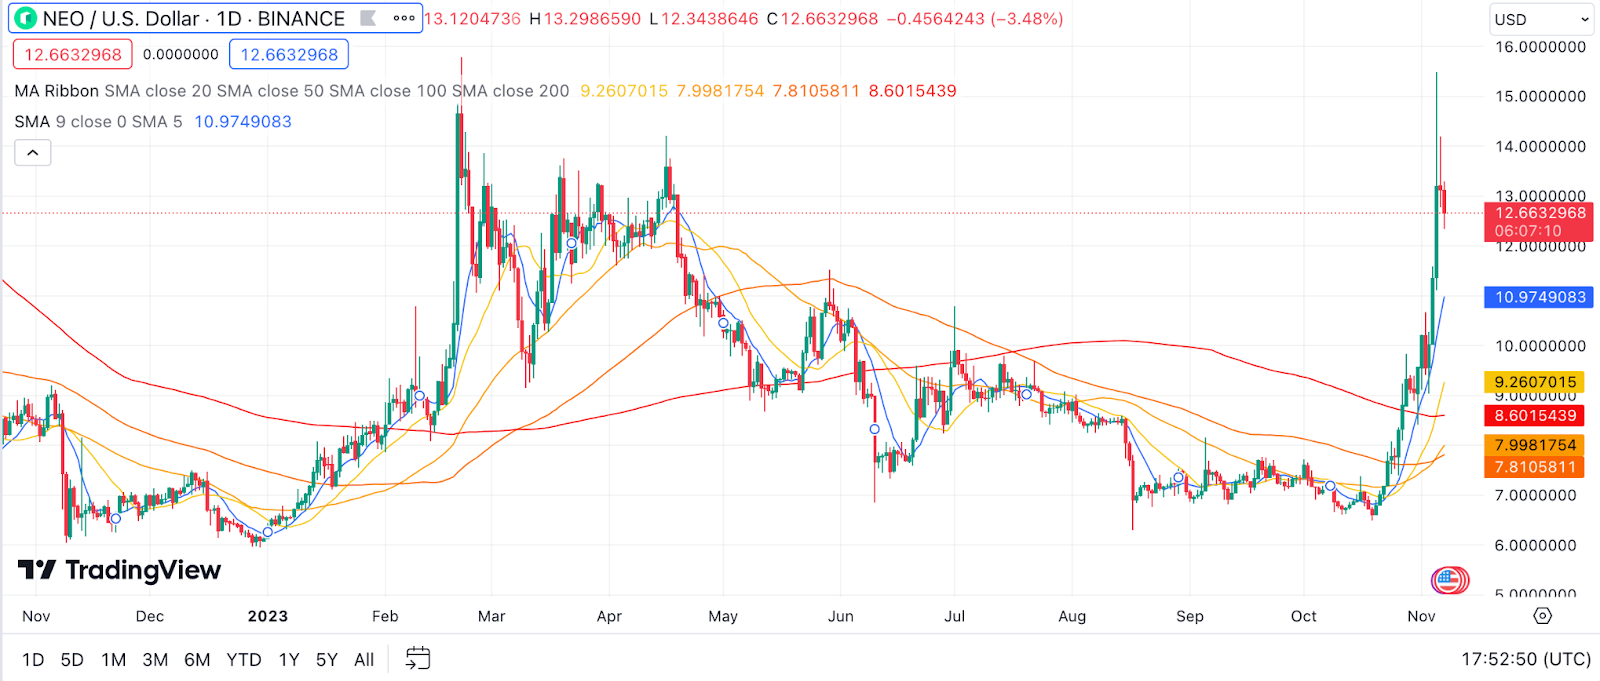
Example: When NEO’s 20-day MA crosses above the 100-day MA, it is often interpreted as a bullish signal, suggesting that the short-term momentum is rising above the longer-term trend, indicating a potential increase in NEO opening price.
Relative Strength Index (RSI) for Neo Price Prediction
The Relative Strength Index (RSI) is a momentum oscillator that measures the extent of recent price changes to evaluate overbought or oversold conditions. It is a bounded indicator, moving between 0 and 100, with levels typically set at 70 for overbought and 30 for oversold.
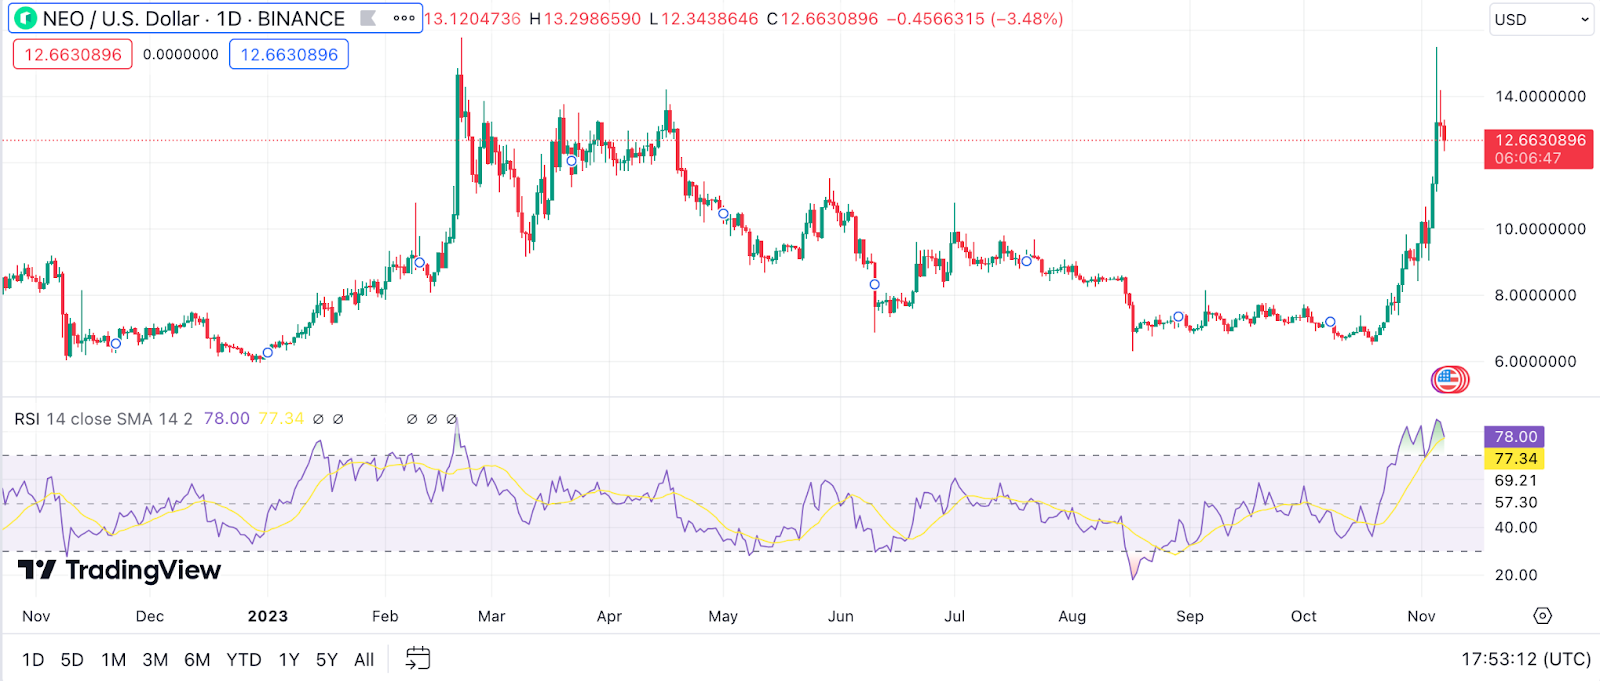
Example: If NEO’s RSI drops below 30, it might indicate that the asset is oversold and could be due for a reversal or corrective rally. This could be a signal to consider a trade NEO position if other factors align.
Moving Average Convergence Divergence (MACD) for Neo Price Prediction
The Moving Average Convergence Divergence (MACD) is a trend-following momentum indicator that shows the relationship between two moving averages of an asset’s price. The MACD is calculated by subtracting the 26-period Exponential Moving Average (EMA) from the 12-period EMA.
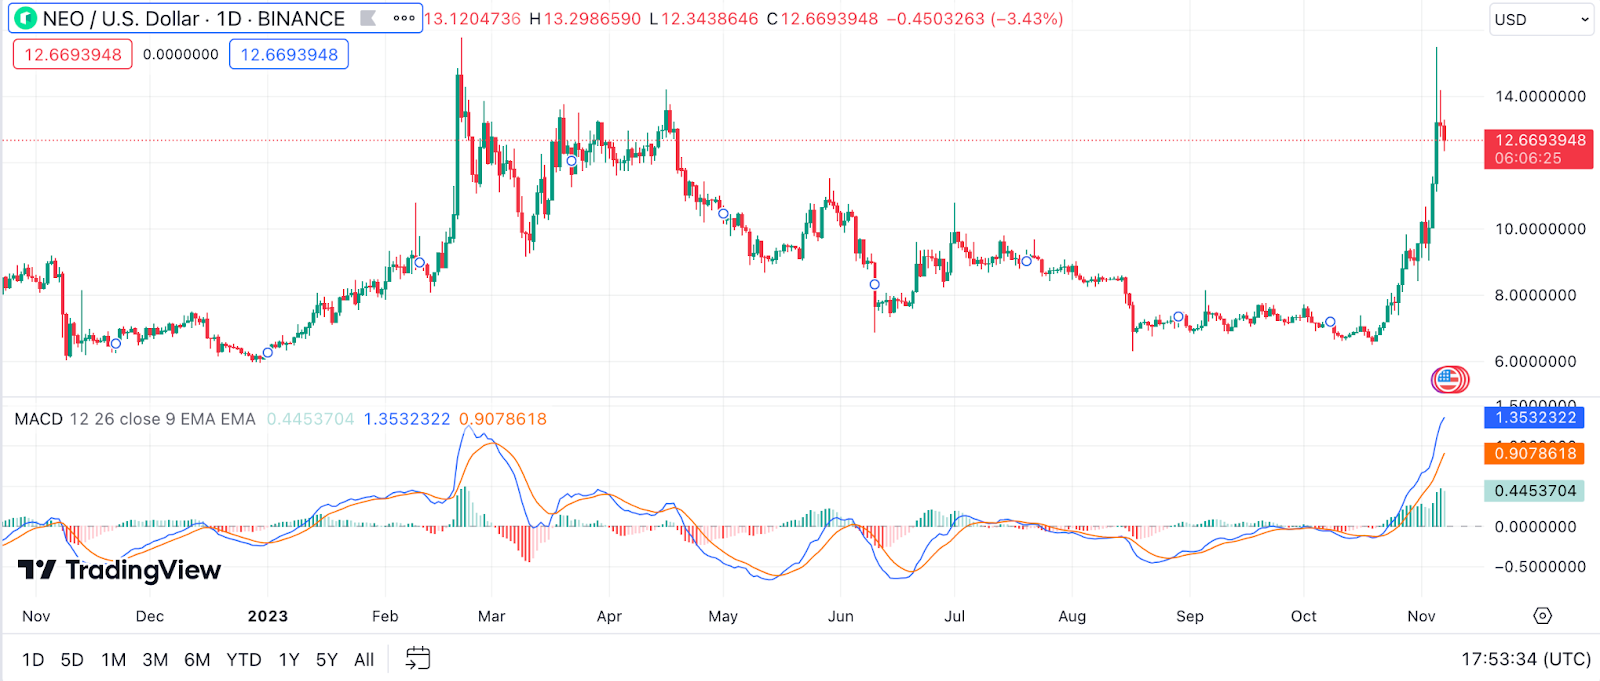
Example: When the MACD line crosses above the signal line, it is taken as a bullish sign for NEO, suggesting it might be time to buy. Conversely, a cross below could be a bearish signal, indicating a possible sell-off or the need for caution among holders.
Bollinger Bands for Neo Price Prediction
Bollinger Bands are a technical analysis tool defined by a set of trendlines plotted two standard deviations (positively and negatively) away from a simple moving average (SMA) of a cryptocurrency’s price, but they can be adjusted to user preferences for more sensitivity or less. These bands not only indicate volatility—the wider the bands, the higher the volatility—but they also often indicate overbought or oversold conditions.
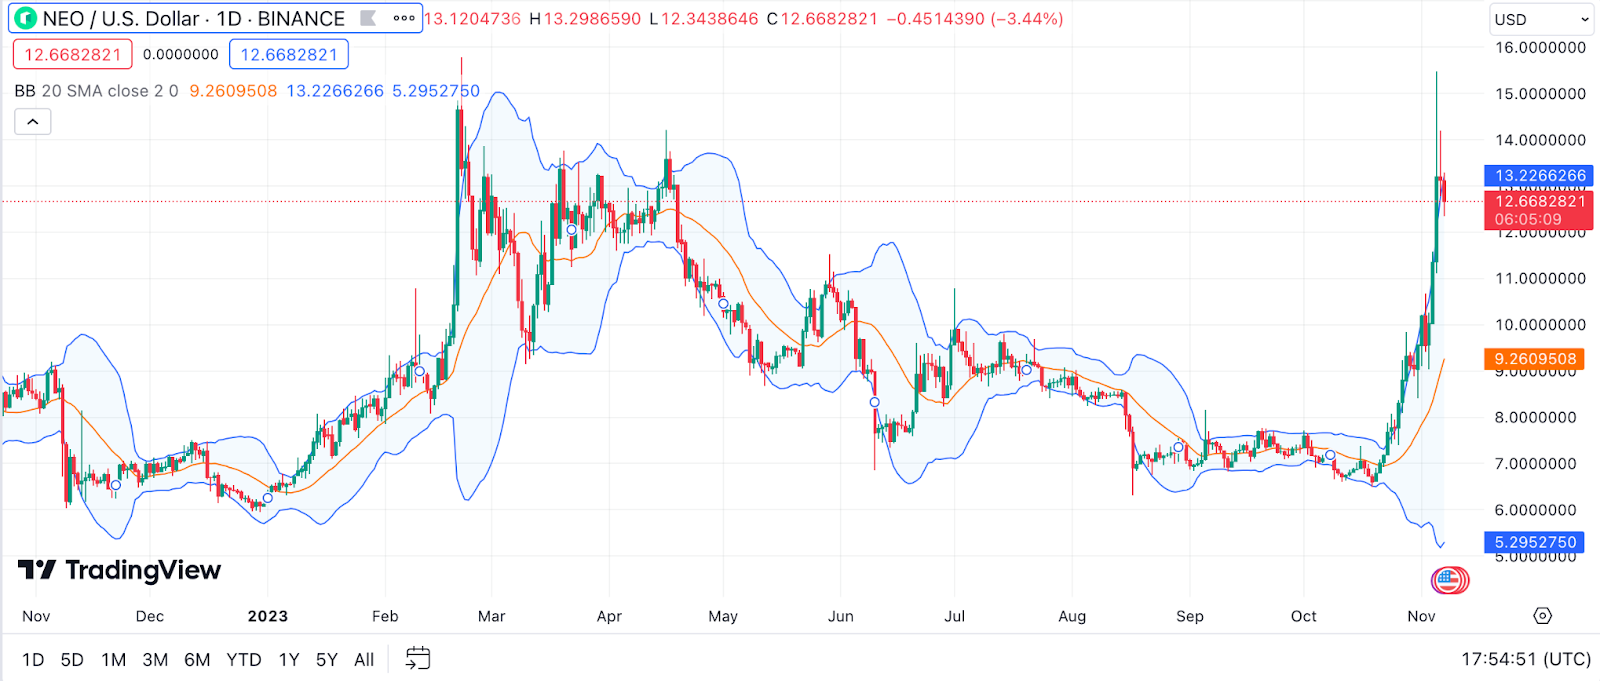
Example: If NEO’s price touches the upper Bollinger Band, it might be considered overbought, and hence it could be a signal to sell or at least be prepared for a potential pullback. Conversely, if the price hits the lower band, it could indicate that NEO is oversold and might soon rebound.
Stochastic Oscillator for Neo Price Prediction
The Stochastic Oscillator is a momentum indicator comparing a particular closing price of NEO to a range of its prices over a certain period of time. The sensitivity of the oscillator to market movements can be reduced by adjusting that time period or by taking a moving average of the result. It is used to generate overbought and oversold trading signals, utilizing a 0-100 bounded range of values.
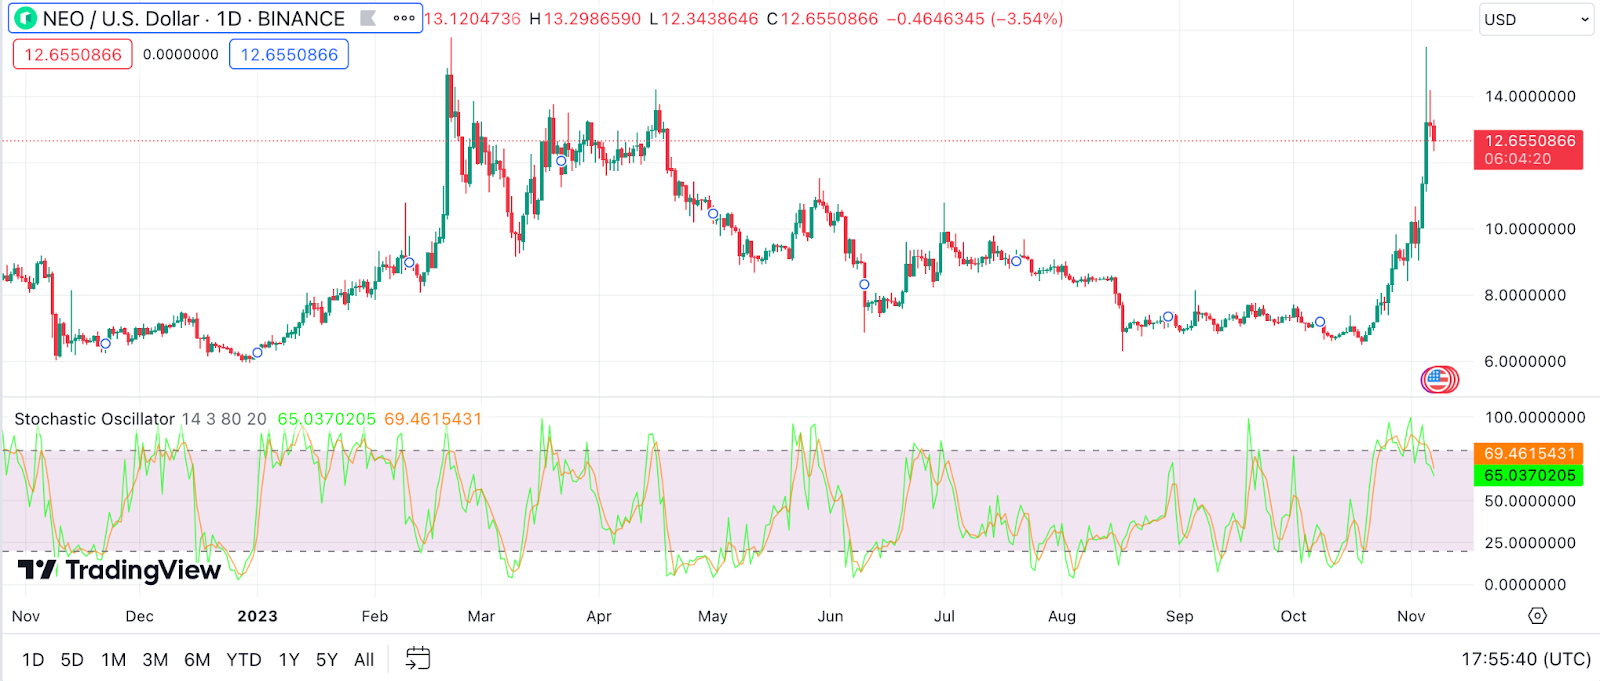
Example: Consider NEO’s Stochastic Oscillator reading is above 80, which is commonly considered overbought. This suggests that NEO could be due for a correction or pullback in price. Conversely, a reading below 20 indicates an oversold condition and could mean a price increase is forthcoming.
Parabolic SAR (Stop and Reverse) for Neo Price Prediction
The Parabolic SAR (Stop and Reverse) is a system that sets trailing price stops for long or short positions and is quite effective in markets that trend well. The SAR is a series of dots placed above or below the price bars. A dot below the price is bullish, and one above is bearish.
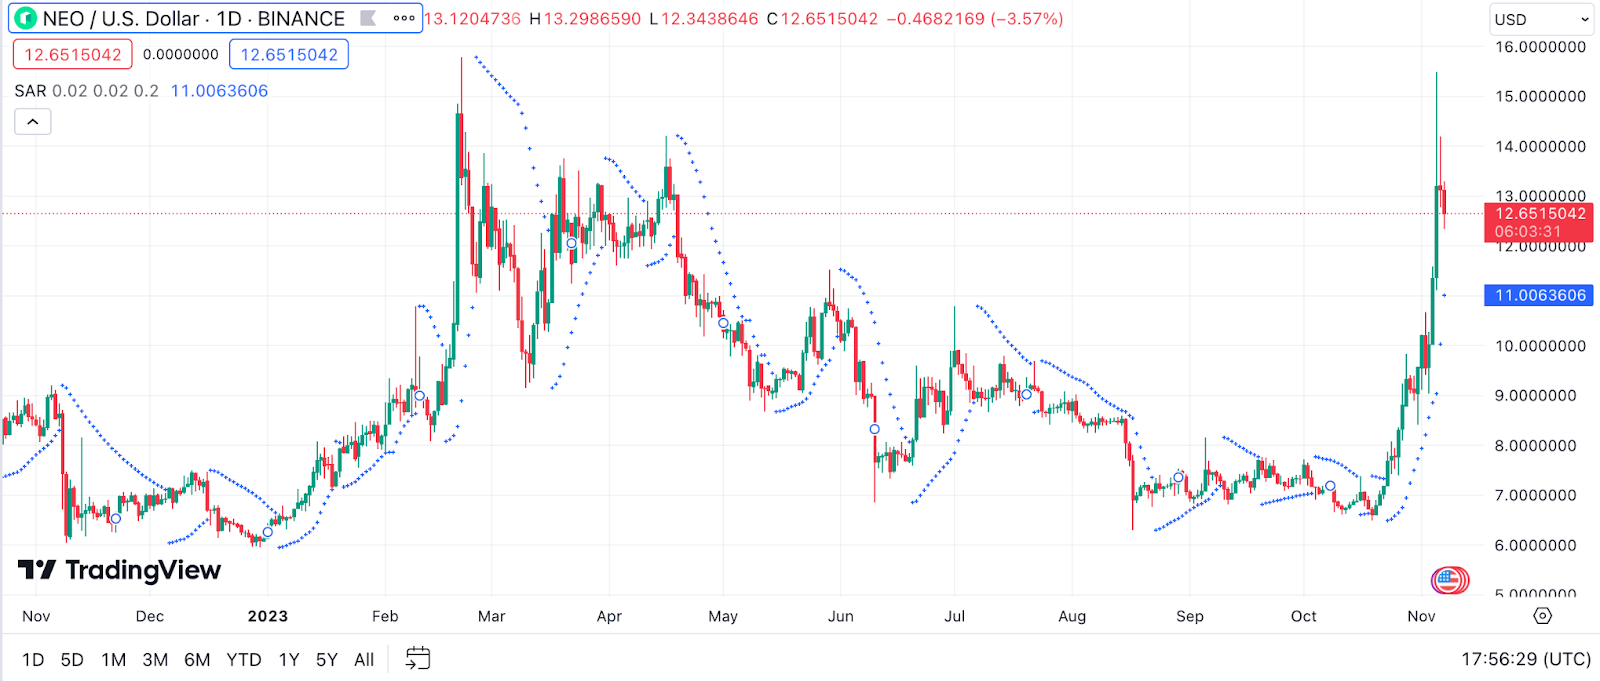
Example: For NEO, if the price is trending upwards and the dots are below the candles, it suggests a bullish trend. Should the price dip and the dots flip to above the price bars, this indicates a potential trend reversal to bearish. Traders might take this as a signal to sell or to prevent entering long positions until the trend confirms its direction.
Ichimoku Cloud for Neo Price Prediction
The Ichimoku Cloud, or Ichimoku Kinko Hyo, is a comprehensive indicator that defines support and resistance, identifies trend direction, gauges momentum, and provides trading signals for traders. It is made up of five lines, each telling its own story about the price action.
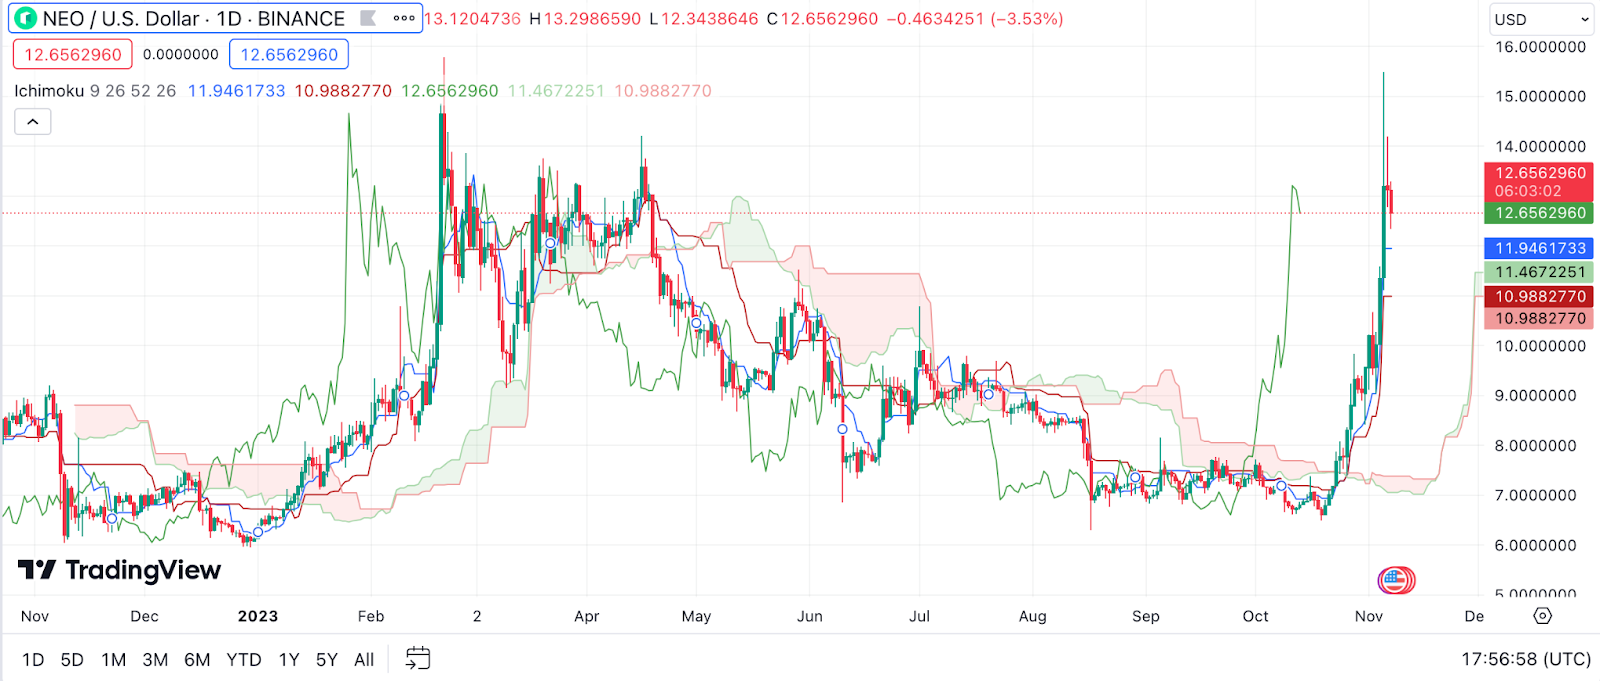
Example: If NEO’s price is above the Ichimoku Cloud, this is traditionally seen as bullish, and thus, it might be a good time to hold or enter a long position. Conversely, if NEO is trading below the cloud, it’s considered bearish, and caution or a short position might be advised.
Fibonacci Retracement for Neo Price Prediction
Fibonacci Retracement levels are horizontal lines that indicate where support and resistance are likely to occur. They are based on Fibonacci numbers. Each level is associated with a percentage that represents how much of a prior move the price has retraced. The Fibonacci Retracement levels most commonly used in trading are 23.6%, 38.2%, 61.8%, and sometimes 50%.
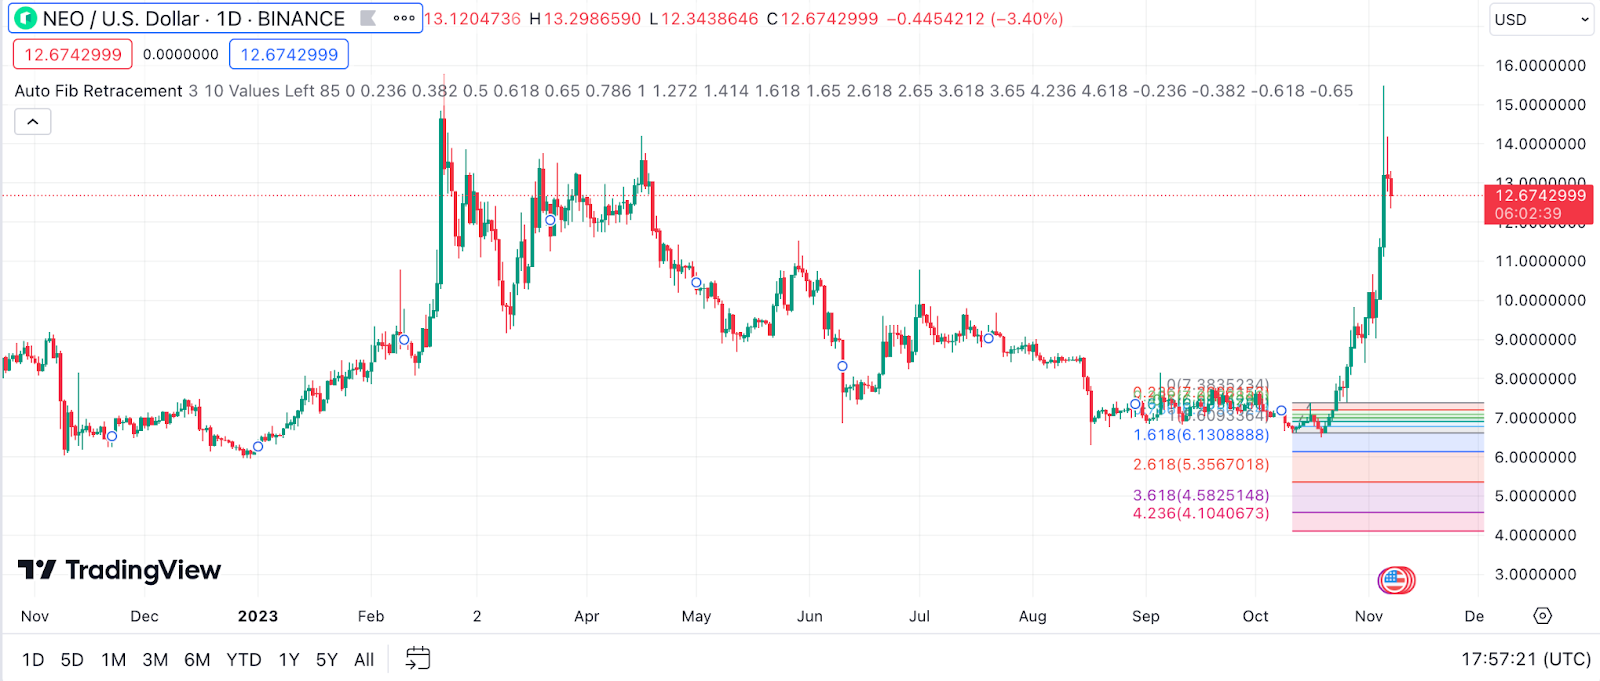
Example: If NEO experiences a significant rally or drop, traders will draw Fibonacci lines on the chart. If the price retraces to one of these levels and stabilizes, it may be an opportunity to enter a trade in the direction of the original trend.
Average Directional Index (ADX) for Neo Price Prediction
The Average Directional Index (ADX) is an indicator used to quantify trend strength. The ADX is part of the Directional Movement System developed by Welles Wilder and includes the positive directional indicator (+DI) and negative directional indicator (-DI). Values above 25 usually indicate a strong trend.
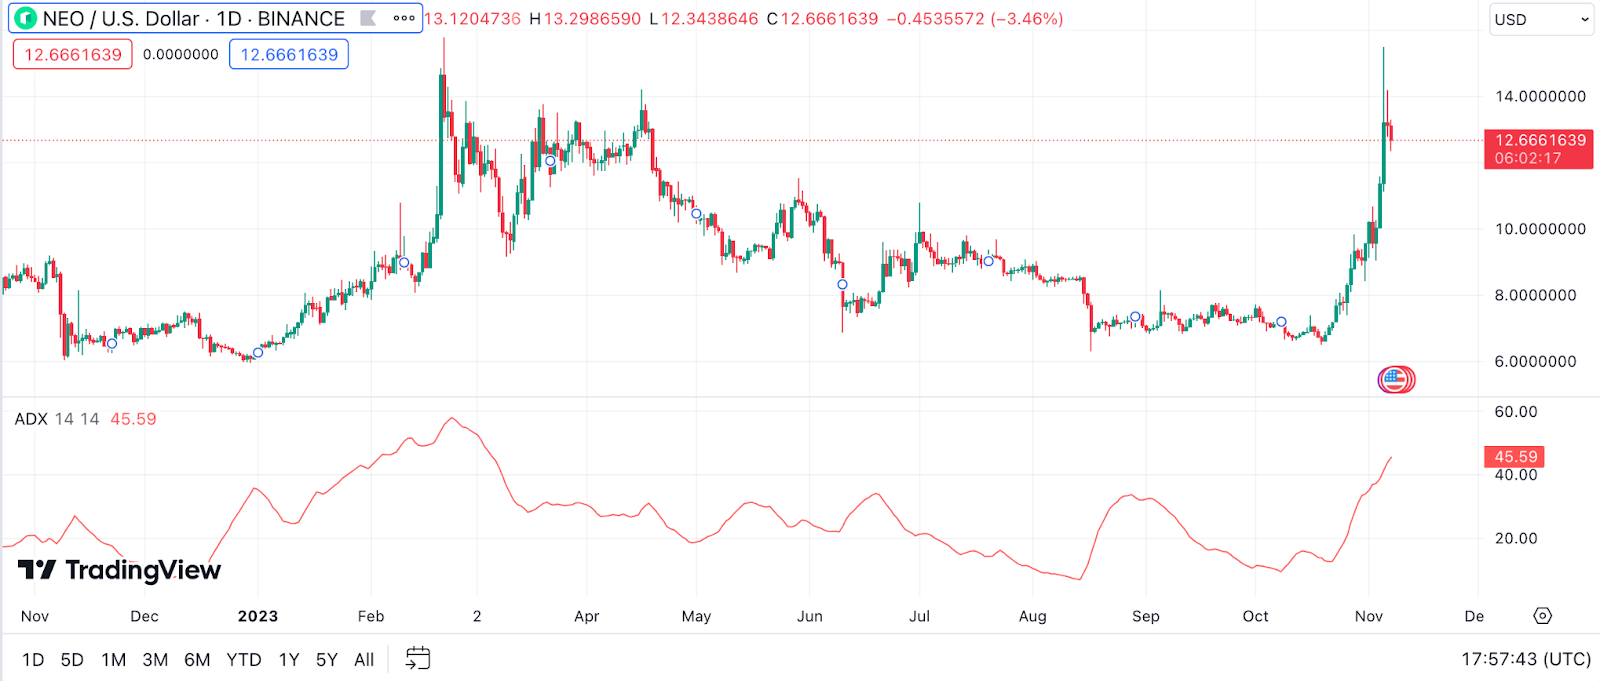
Example: If NEO’s ADX value is above 25 and the +DI is above the -DI, the market is showing a strong bullish trend, suggesting that it may be a good time to buy. If the ADX is above 25 and the -DI is above the +DI, a strong bearish trend is indicated, and it may be time to sell or short.
On Balance Volume (OBV) for Neo Price Prediction
On Balance Volume (OBV) is a technical trading momentum indicator that uses volume flow to predict changes in stock price. The theory behind OBV is based on the distinction between smart money – namely, institutional investors – and less sophisticated retail investors.
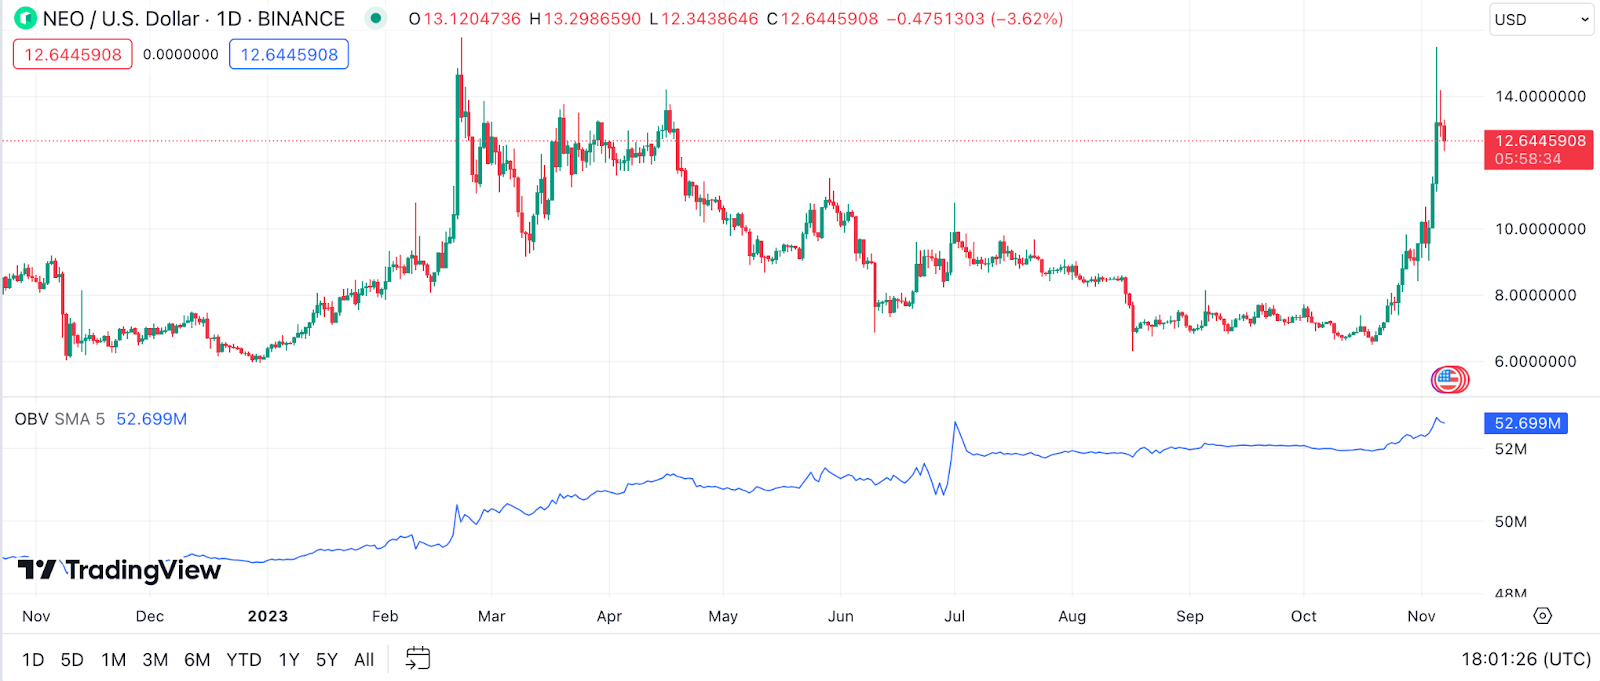
Example: In the context of NEO, if the currency closes higher than the previous day, all of the day’s volume is considered up-volume. Conversely, if it closes lower, all of the volume is considered down-volume. An increasing OBV suggests that buyers are willing to step in and push the price higher. If NEO’s price is rising but OBV is flat-lining or falling, the price may be nearing a top. If the price is falling and OBV is flat or rising, the price could be nearing a bottom.
Rate of Change (ROC) for Neo Price Prediction
The Rate of Change (ROC) is a momentum oscillator, which measures the percentage change between the current price and the price a certain number of periods ago. The ROC calculation compares the current price with the price “n” periods ago.
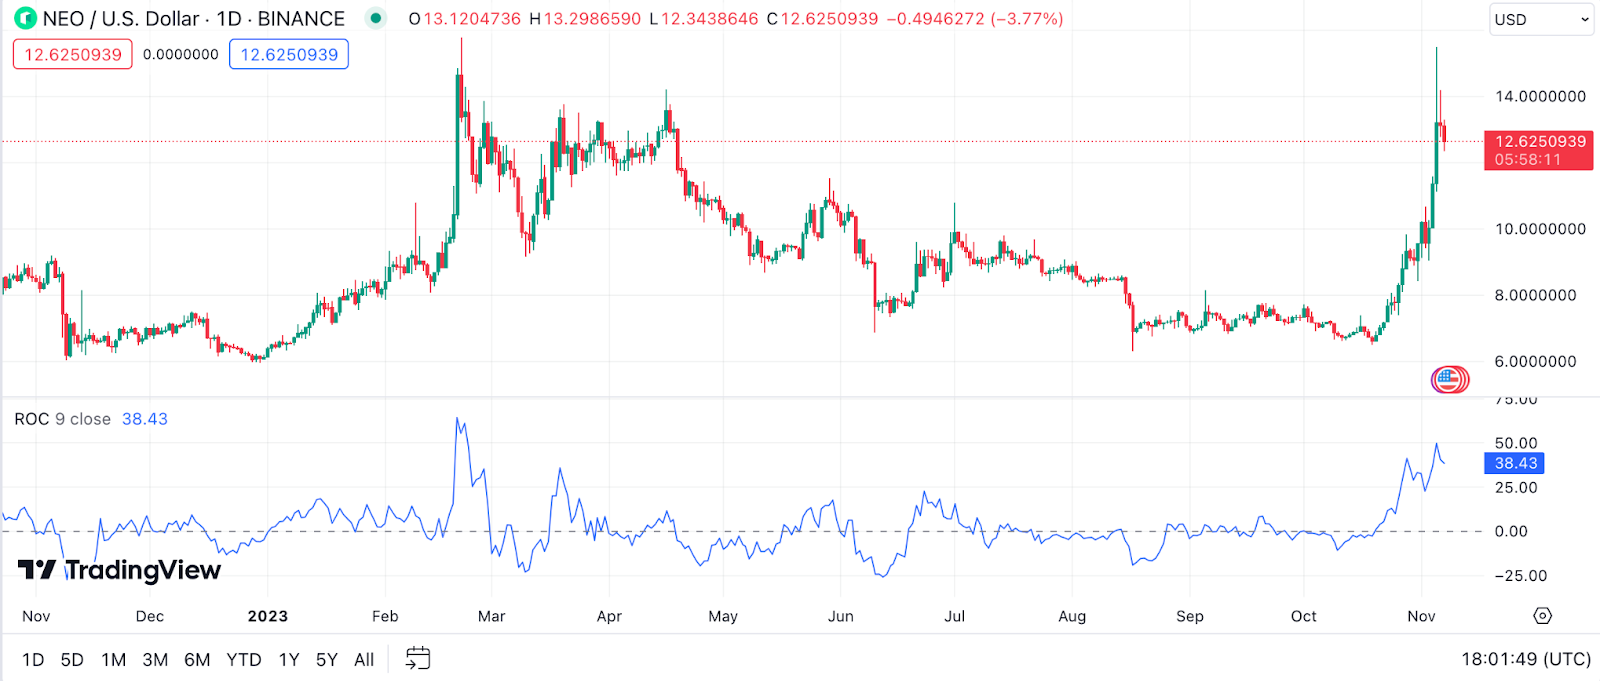
Example: For NEO, if the ROC is rising, it indicates that the uptrend is getting stronger. A falling ROC indicates a lessening momentum or a potential bearish reversal. If NEO’s price moves rapidly in either direction, the ROC will reflect this jump with a similar move. Traders often watch for divergences between ROC and price to warn of potential price reversals.
Commodity Channel Index (CCI) for Neo Price Prediction
The Commodity Channel Index (CCI) is an oscillator introduced by Donald Lambert in 1980. It measures the variation of a cryptocurrency’s price from its statistical mean. High values show that prices are unusually high compared to average prices whereas low values indicate that prices are unusually low.
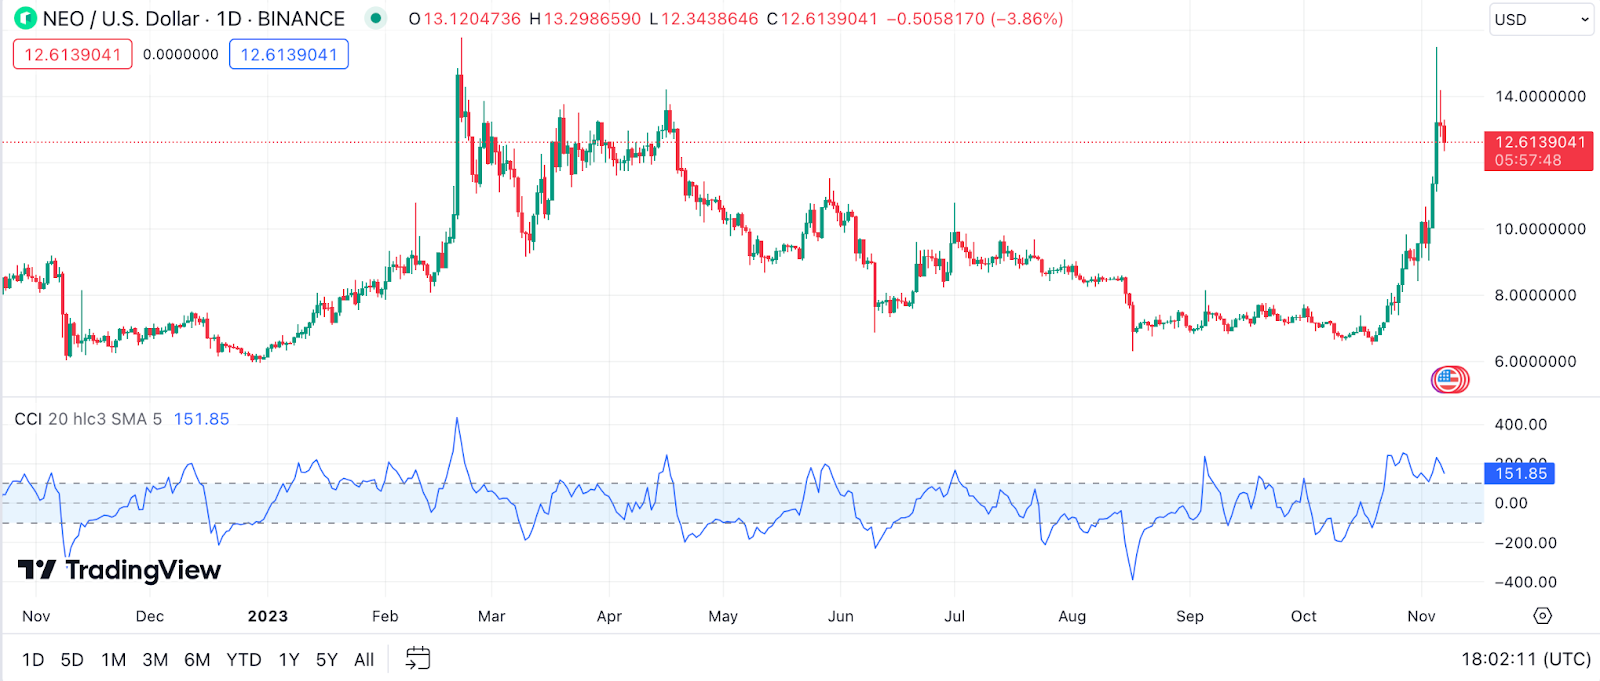
Example: If NEO’s CCI is above +100, this indicates a strong upward trend and a signal that prices may continue to rise. Conversely, if NEO’s CCI is below -100, this could signal that the trend is down and may persist in that direction. However, a lot of traders use the CCI more cautiously, watching for the indicator to move back from extreme values before initiating a trade.
Accumulation/Distribution Line (A/D Line) for Neo Price Prediction
The Accumulation/Distribution Line (A/D Line) is a volume-based indicator designed to measure the cumulative flow of money into and out of a security. It’s a reflection of whether a cryptocurrency is in an accumulation phase or a distribution phase.
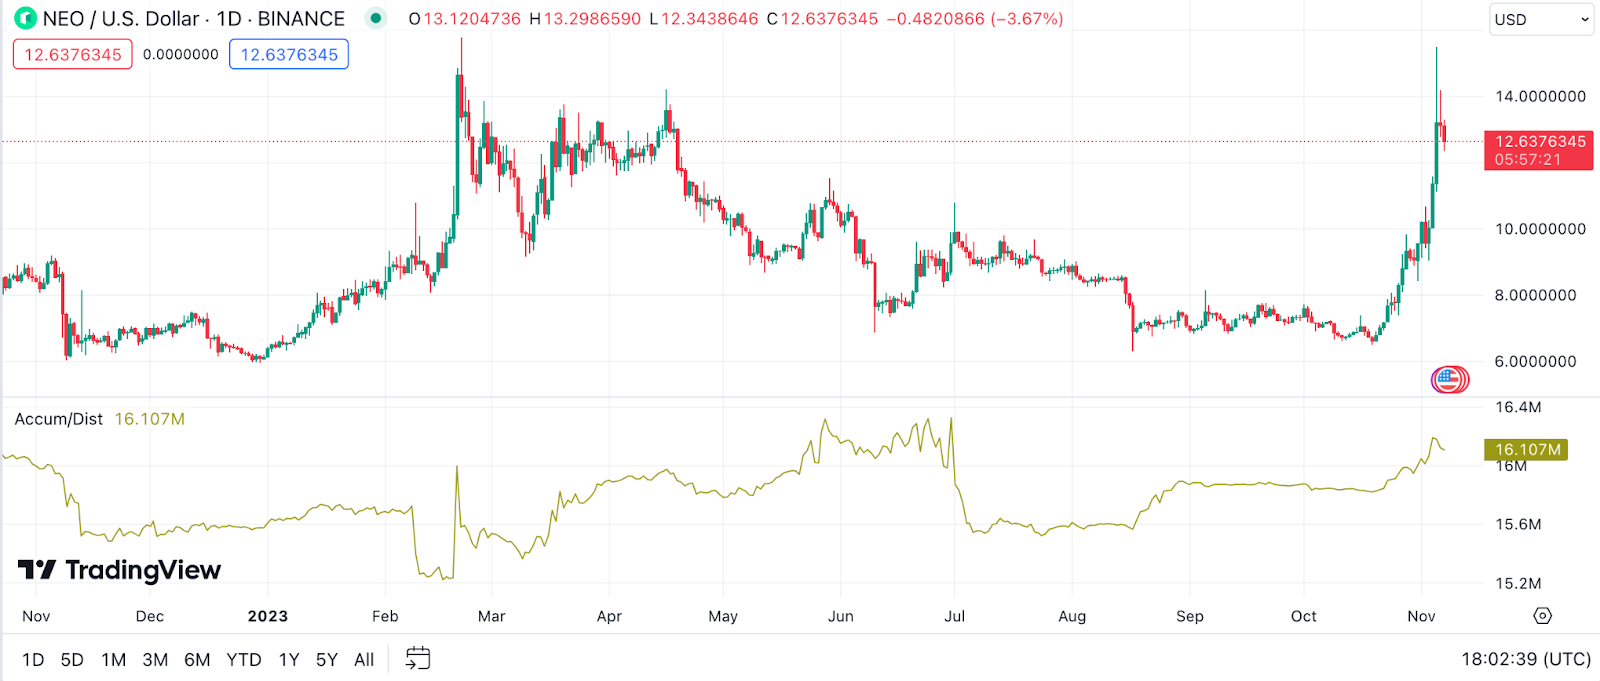
Example: For the current NEO price, if you observe that the A/D line is trending upwards, it suggests that the cryptocurrency is being accumulated, as most trades are occurring near the ask price, which could potentially indicate bullish momentum. Conversely, a downward trend in the A/D line might signal that NEO is being distributed by the market participants, possibly indicating bearish momentum.
Pivot Points for Neo Price Prediction
Pivot points are a technical analysis tool used to determine the overall trend of the market over different time frames. They are calculated using the previous trading session’s high, low, and closing prices.
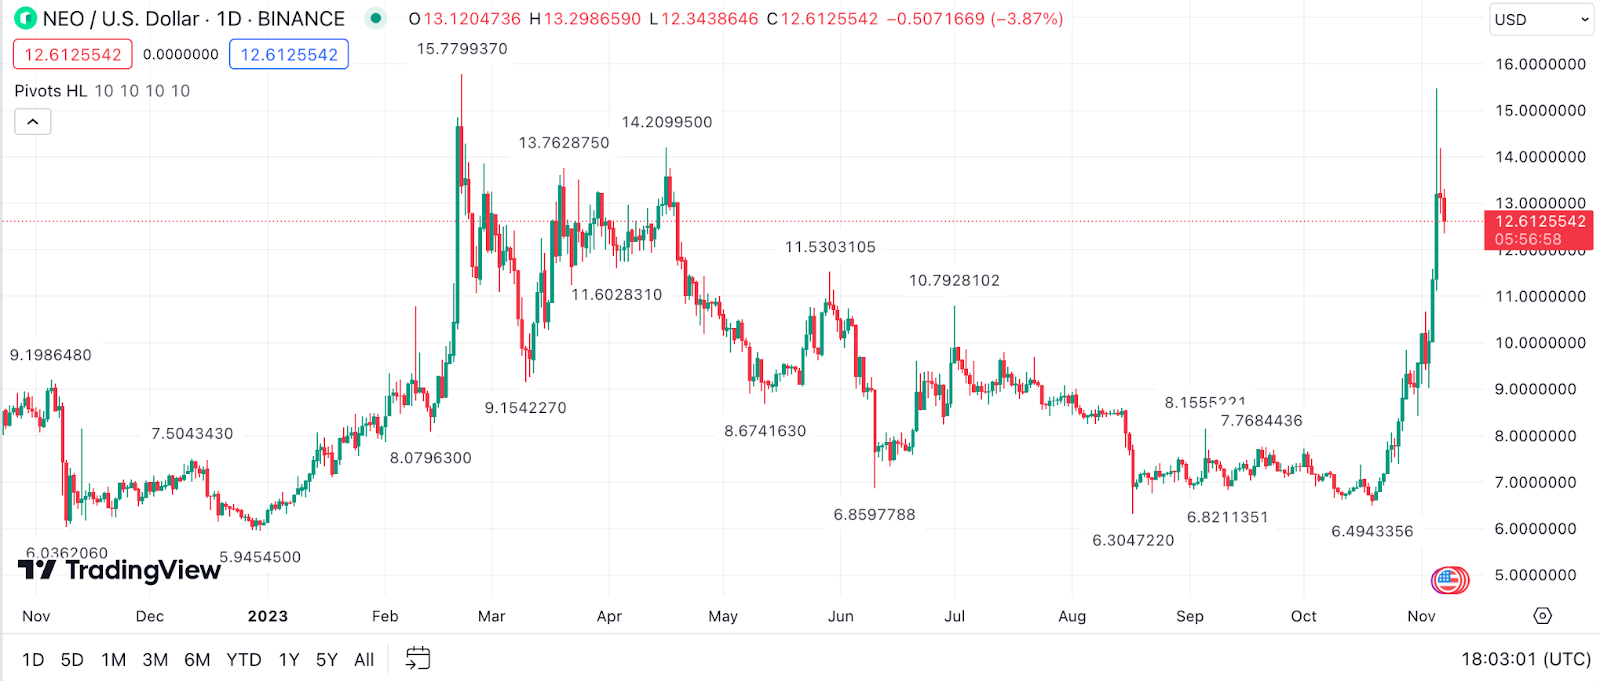
Example: If NEO’s price is trading above the calculated pivot point, this serves as an indication that the overall sentiment is bullish. Should NEO trade below, it’s seen as bearish. Day traders might use pivot points to identify possible support and resistance levels, where they could potentially make trades based on NEO’s reaction to these price levels.
Chaikin Money Flow (CMF) for Neo Price Prediction
The Chaikin Money Flow (CMF) is an oscillator that fluctuates between -1 and +1, designed to measure the buying and selling pressure over a set period of time. It combines both price and volume to gauge the market sentiment behind price movements.
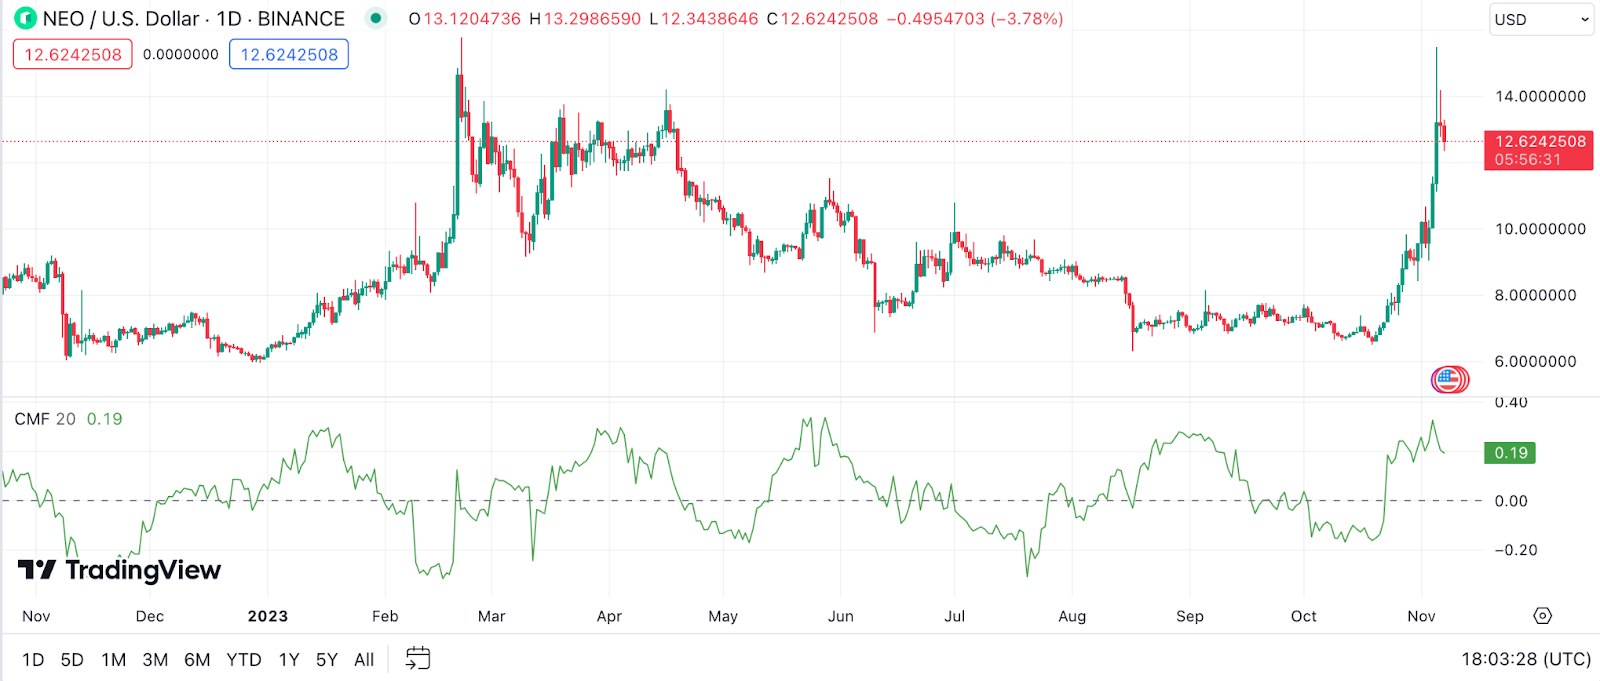
Example: When NEO’s price is accompanied by a rising CMF, it indicates strength and suggests that prices could keep climbing as buying pressure is high. If NEO’s CMF is falling while the price is rising, this could be a sign that the uptrend is not supported by volumes and could be due for a reversal. A negative CMF would indicate selling pressure, which might result in downward price movement for NEO.
Aroon Indicator for Neo Price Prediction
The Aroon Indicator is a tool used to identify trend changes and the strength of a trend by measuring the time it takes for the price to reach the highest and lowest points over a given time period, typically 14 days.
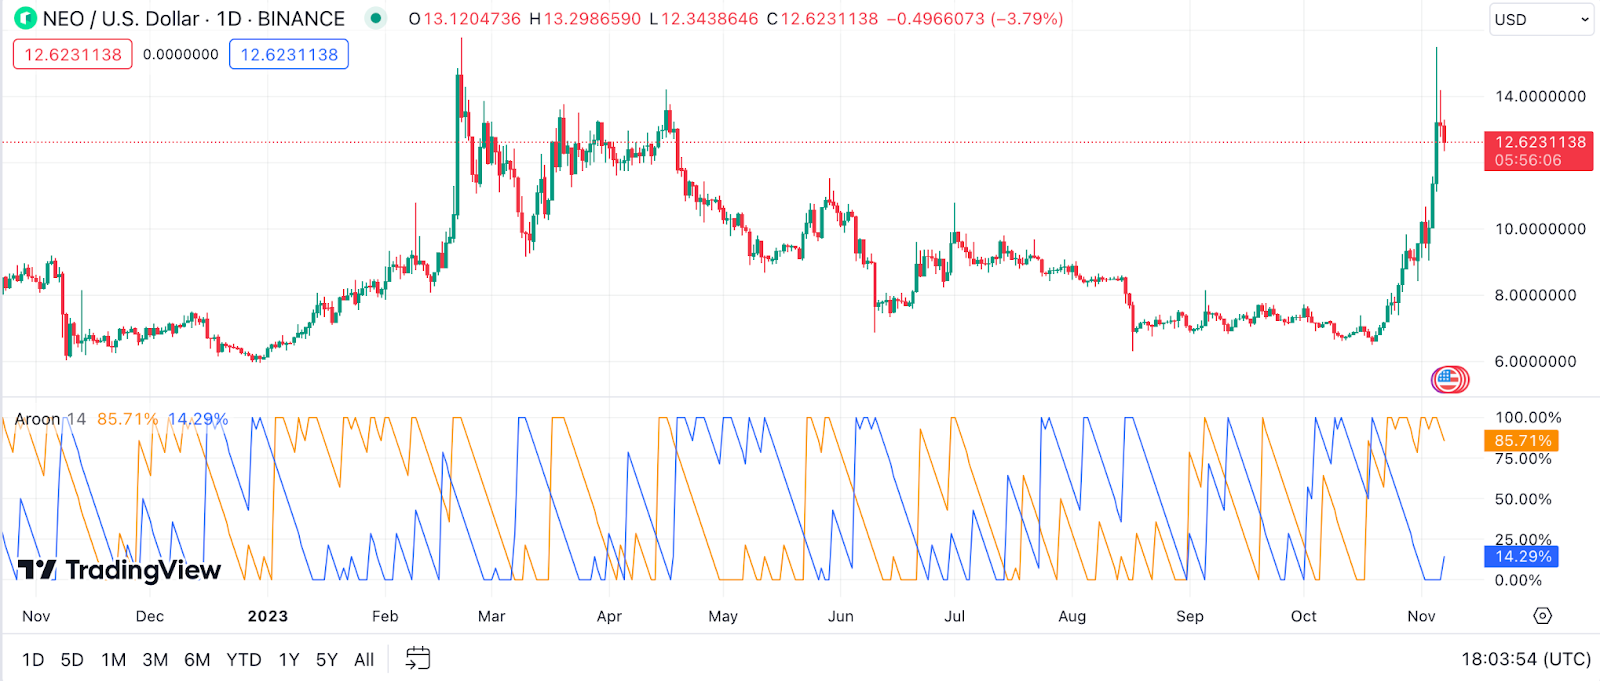
Example: If NEO’s price hits a new high for the 14-day period, the Aroon Up will be close to 100, indicating a strong uptrend. Conversely, if NEO hits a new low, the Aroon Down will approach 100, signifying a strong downtrend. A crossover of Aroon Up and Aroon Down can signal a potential change in the trend of NEO’s price.
Gann Fan for Neo Price Prediction
The Gann Fan is an analytical tool created by W.D. Gann, which is used to understand the different price movements in the market through the use of angles and geometric shapes, suggesting that certain angles can predict price action.
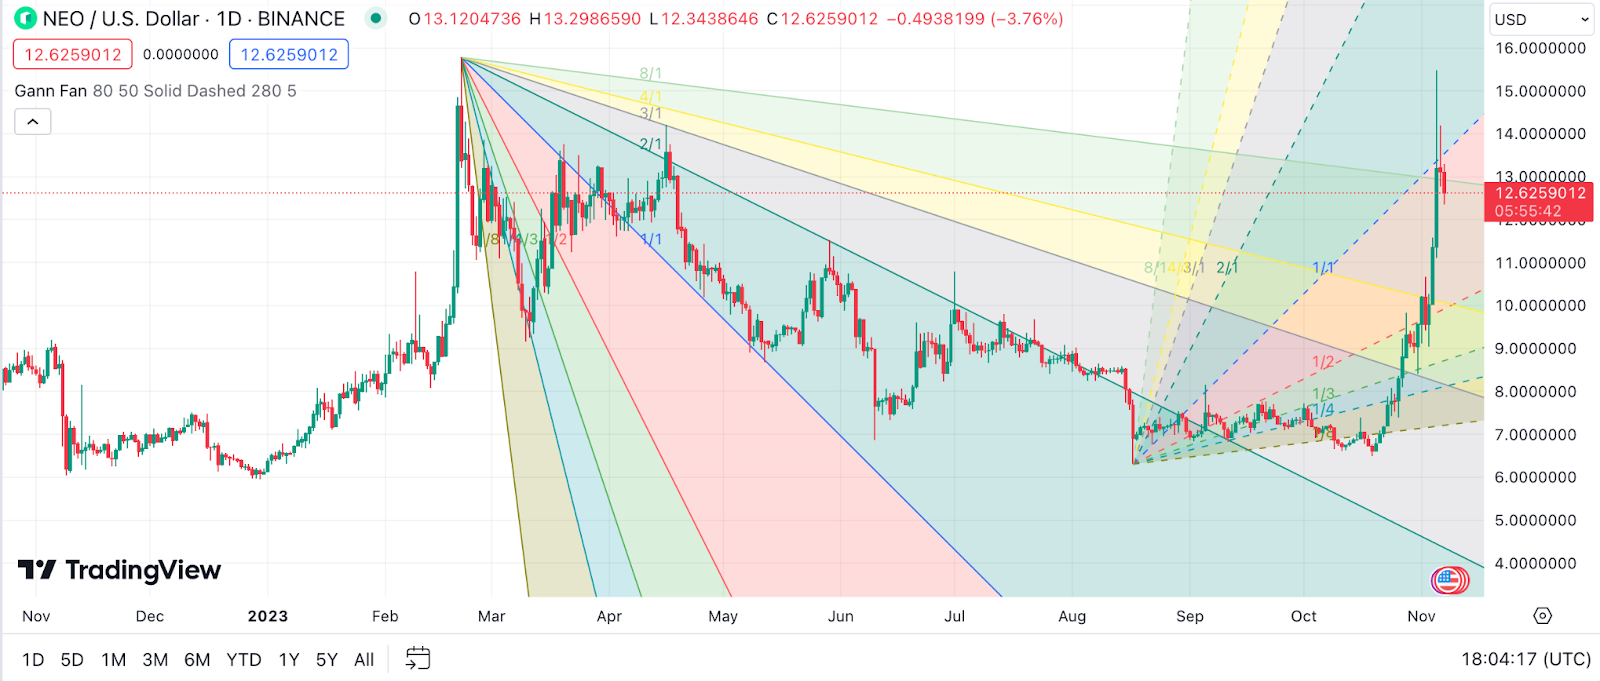
Example: If NEO’s price moves above one of the upward angles, it suggests that the market is bullish and traders might expect NEO to continue rising. If the price drops below a descending angle, this could be an indication of a bearish market for NEO, hinting at potential selling opportunities.
Keltner Channel for Neo Price Prediction
Keltner Channels are volatility-based envelopes set above and below an exponential moving average. This indicator is similar to Bollinger Bands, with the primary difference being the use of the average true range (ATR) to set channel distance, instead of the standard deviation.
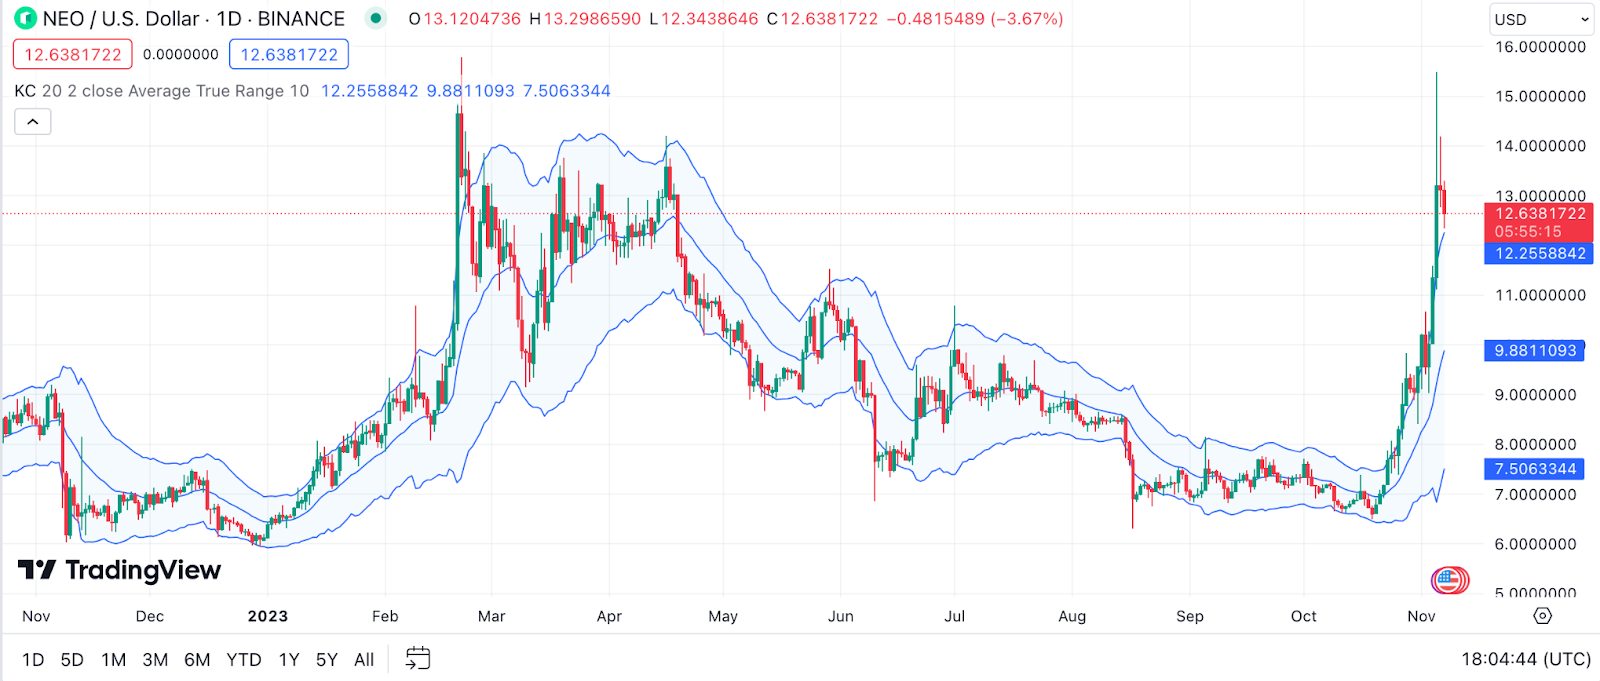
Example: When NEO’s price breaks above the upper Keltner Channel, it indicates the possibility of an overbought condition and may signal a reversal or pullback. Conversely, a drop below the lower channel could signal an oversold condition, potentially followed by a price increase if buyers step in. It’s important to watch for the price to stabilize or follow through before making a trade based on these signals.
Money Flow Index (MFI) for Neo Price Prediction
The Money Flow Index (MFI) is a momentum indicator that integrates price and volume data to identify overbought or oversold conditions for an asset. It compares the “money flow” on up days to that on down days and is often referred to as the volume-weighted RSI.
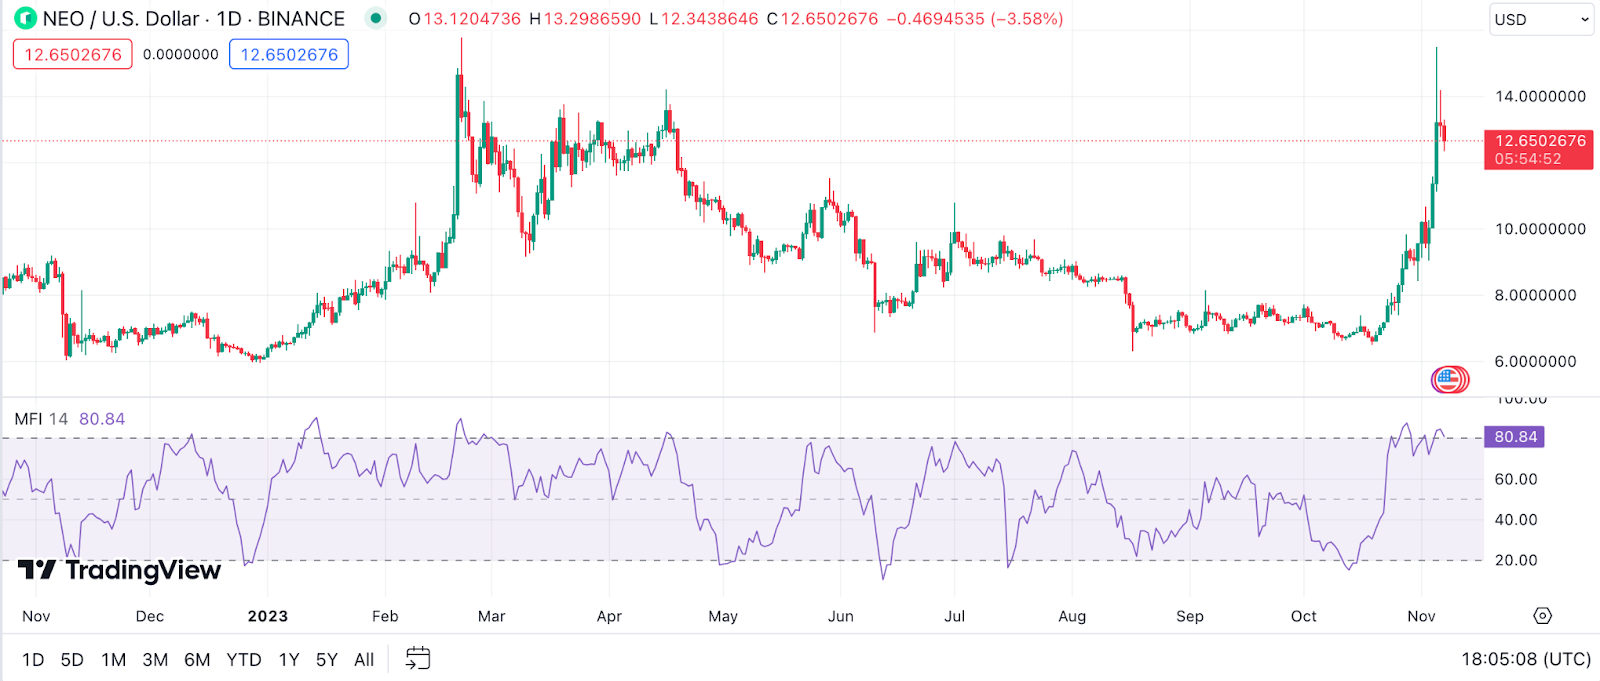
Example: Suppose NEO’s price sees a period of consistent closing prices above previous days’ close, accompanied by increasing volume. The MFI may rise above 80, suggesting NEO is overbought. If it starts to diverge by falling while price climbs, it could signal a potential price correction.
TRIX for Neo Price Prediction
TRIX is a momentum oscillator that shows the rate of change of a triple exponentially smoothed moving average. It helps filter out insignificant price movements and highlights the underlying trend of the asset’s price.
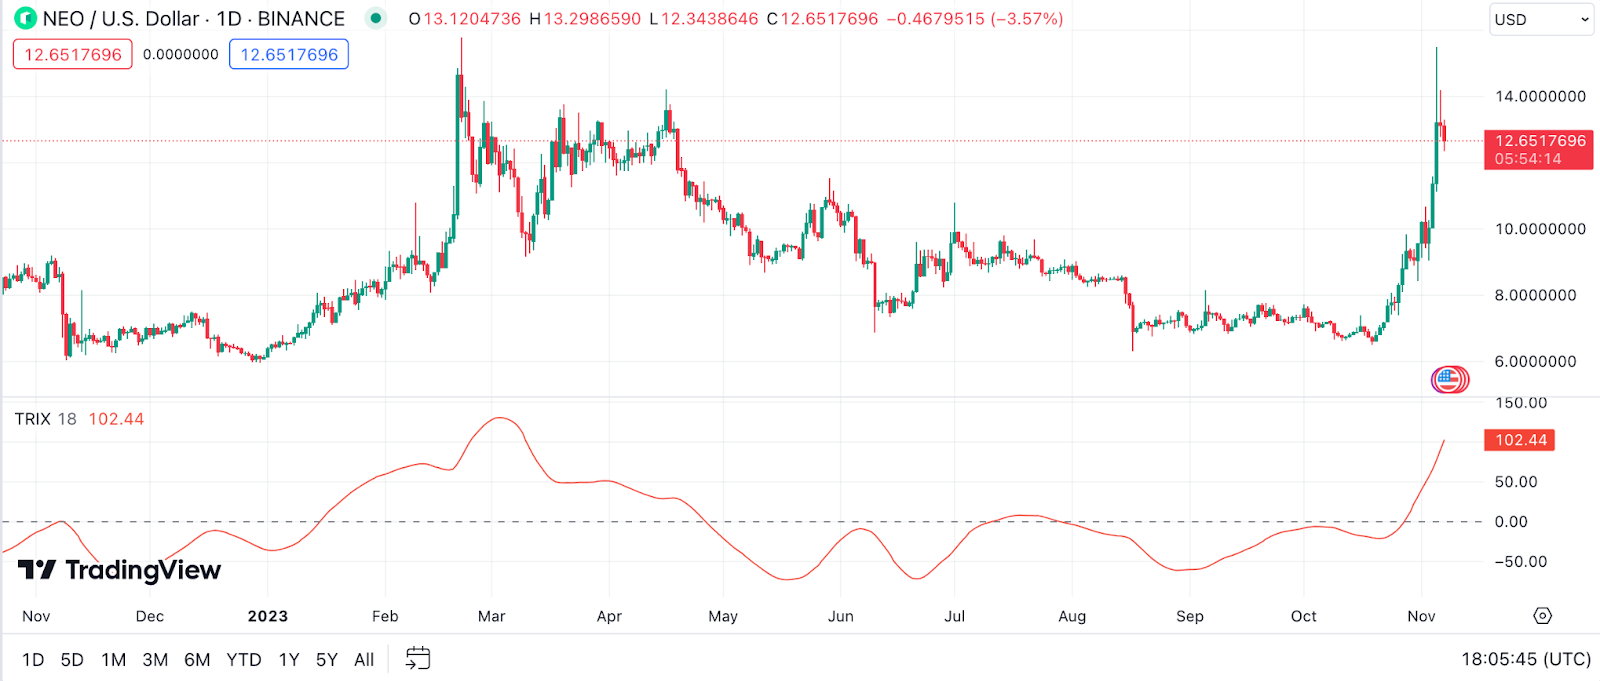
Example: A positive TRIX reading suggests upward momentum, while a negative value indicates downward momentum. For NEO, if the TRIX crosses above its signal line, it could be a bullish signal, prompting a closer look for a buying opportunity. Conversely, a cross below might indicate bearish momentum and a possible selling point.
The Zig Zag Indicator for Neo Price Prediction
The Zig Zag indicator simplifies price movements by filtering out smaller price changes and highlighting significant trends and changes in market prices.
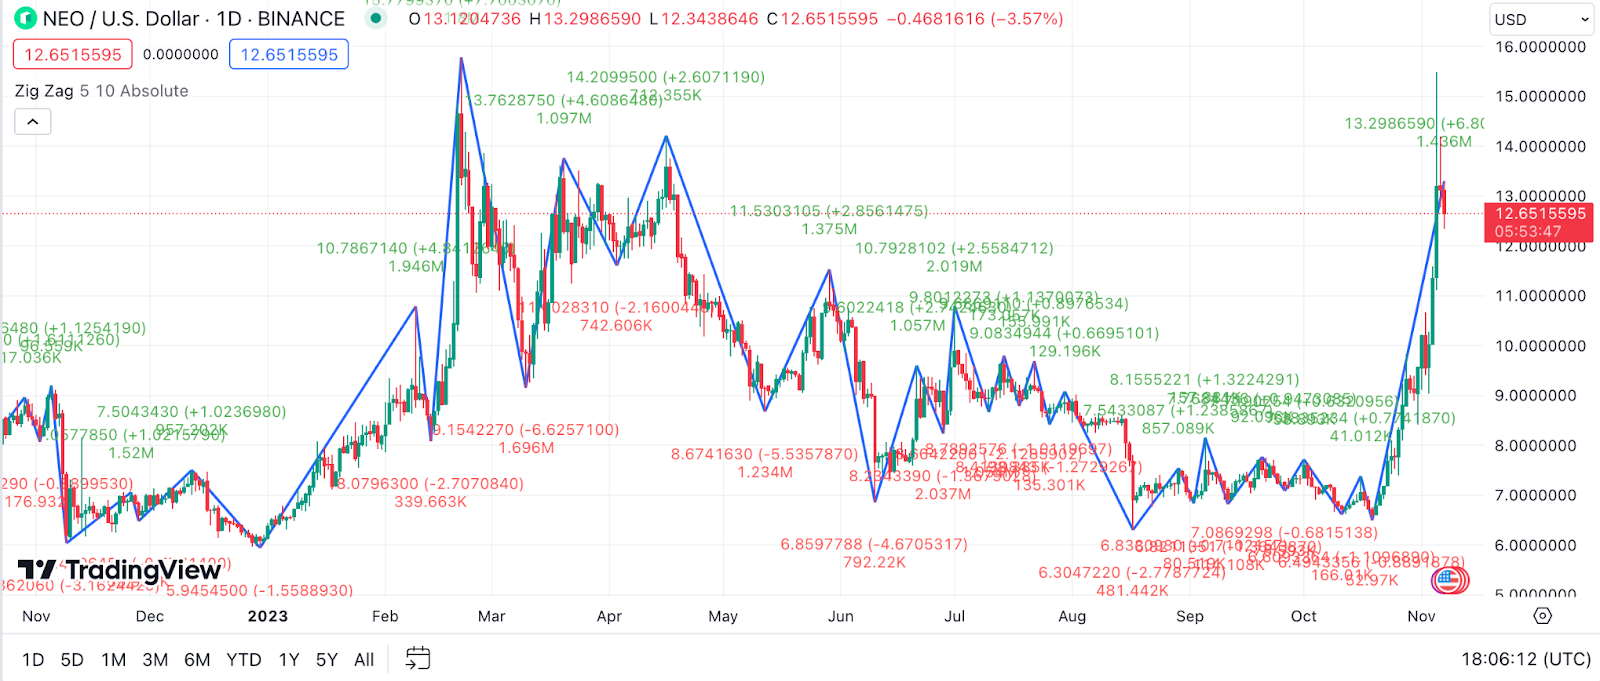
Example: If NEO has been experiencing minor fluctuations, the Zig Zag indicator helps to clear out the noise, making it easier to observe significant trends. If the indicator shows a recent bottom followed by a significant top, it could signal an upward trend, inviting consideration for a long position. If it displays a top followed by a significant lower bottom, a downtrend might be underway, potentially signaling a selling opportunity.
Detrended Price Oscillator (DPO) for Neo Price Prediction
The Detrended Price Oscillator (DPO) is an indicator designed to remove the influence of long-term trends from the price action to focus on the short-term fluctuations. It helps identify cycles and overbought or oversold conditions.
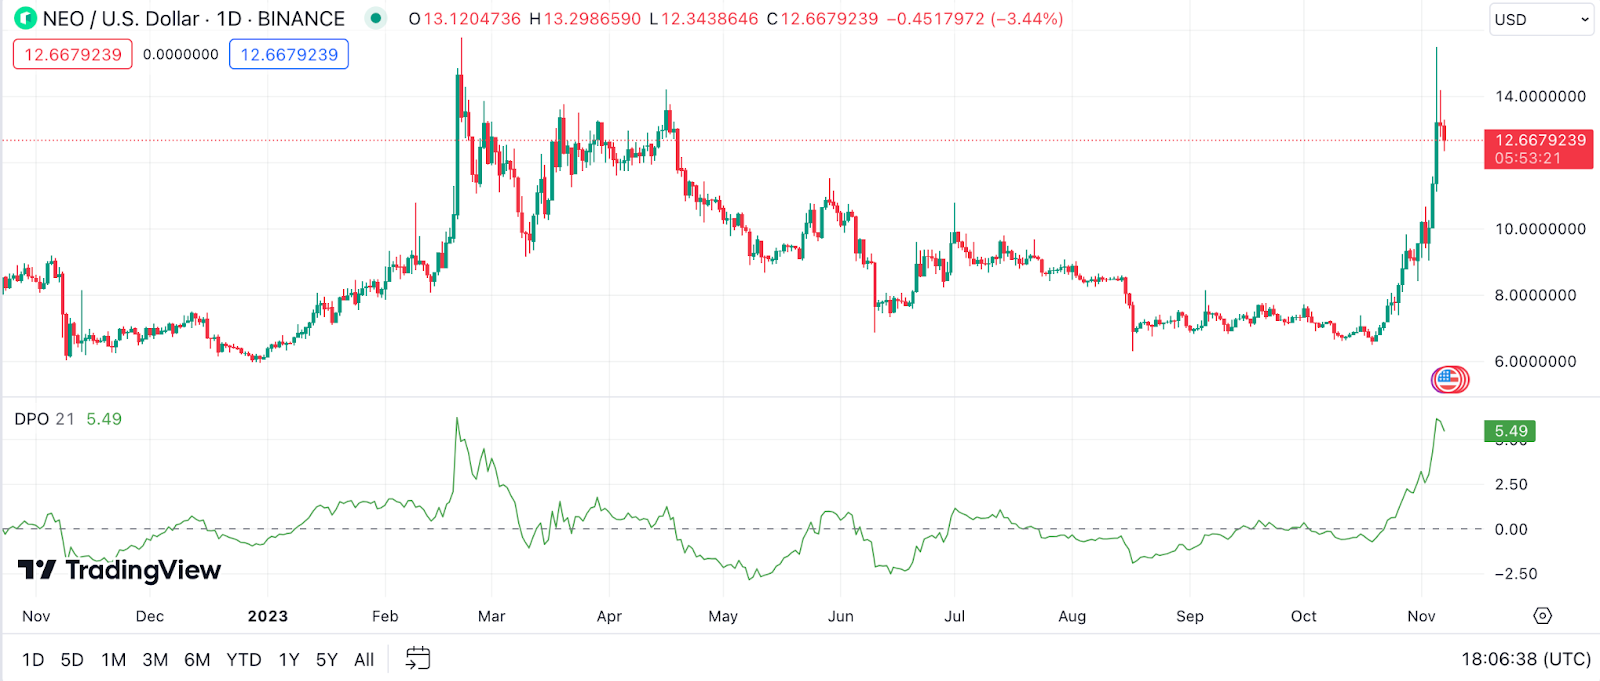
Example: For NEO, if the DPO peaks above the zero line and begins to turn down, this might indicate that short-term prices are falling and that a short-term high has possibly been reached. Conversely, if the DPO dips below the zero line and starts to ascend, it could suggest that prices are recovering from a short-term low.
Vortex Indicator (VI) for Neo Price Prediction
The Vortex Indicator (VI) is used to identify the start of a new trend or the continuation of an existing trend within price data. It’s composed of two lines: VI+ and VI- that capture positive and negative trend movements.
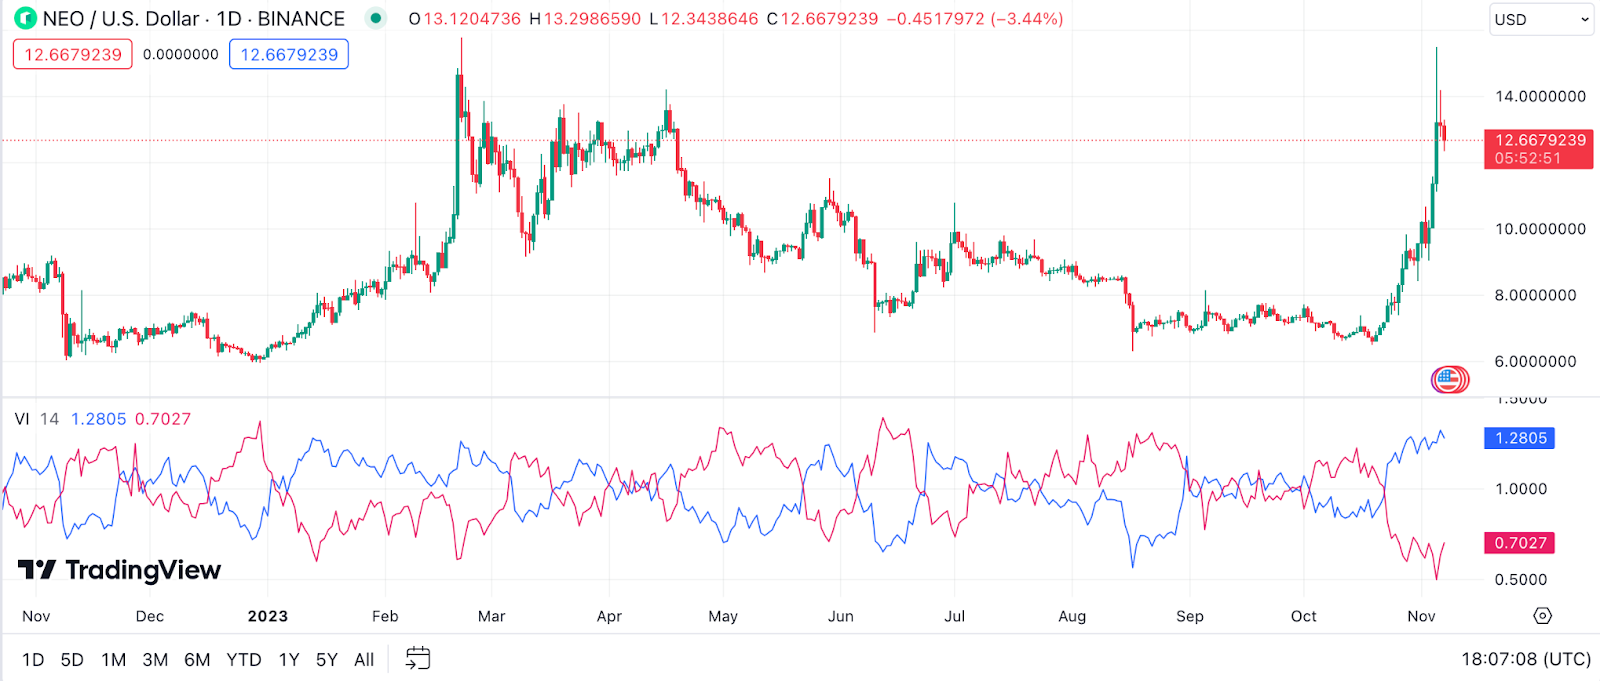
Example: If the VI+ line crosses above the VI- line while analyzing NEO, it could be interpreted as a bullish trend reversal or strengthening. In contrast, if VI- crosses over VI+, it could indicate a bearish trend reversal or downward trend strengthening.
Elder’s Force Index (EFI) for Neo Price Prediction
Elder’s Force Index (EFI) combines price and volume to measure the strength of bulls and bears in the market. It can be used to identify potential reversals and price corrections.
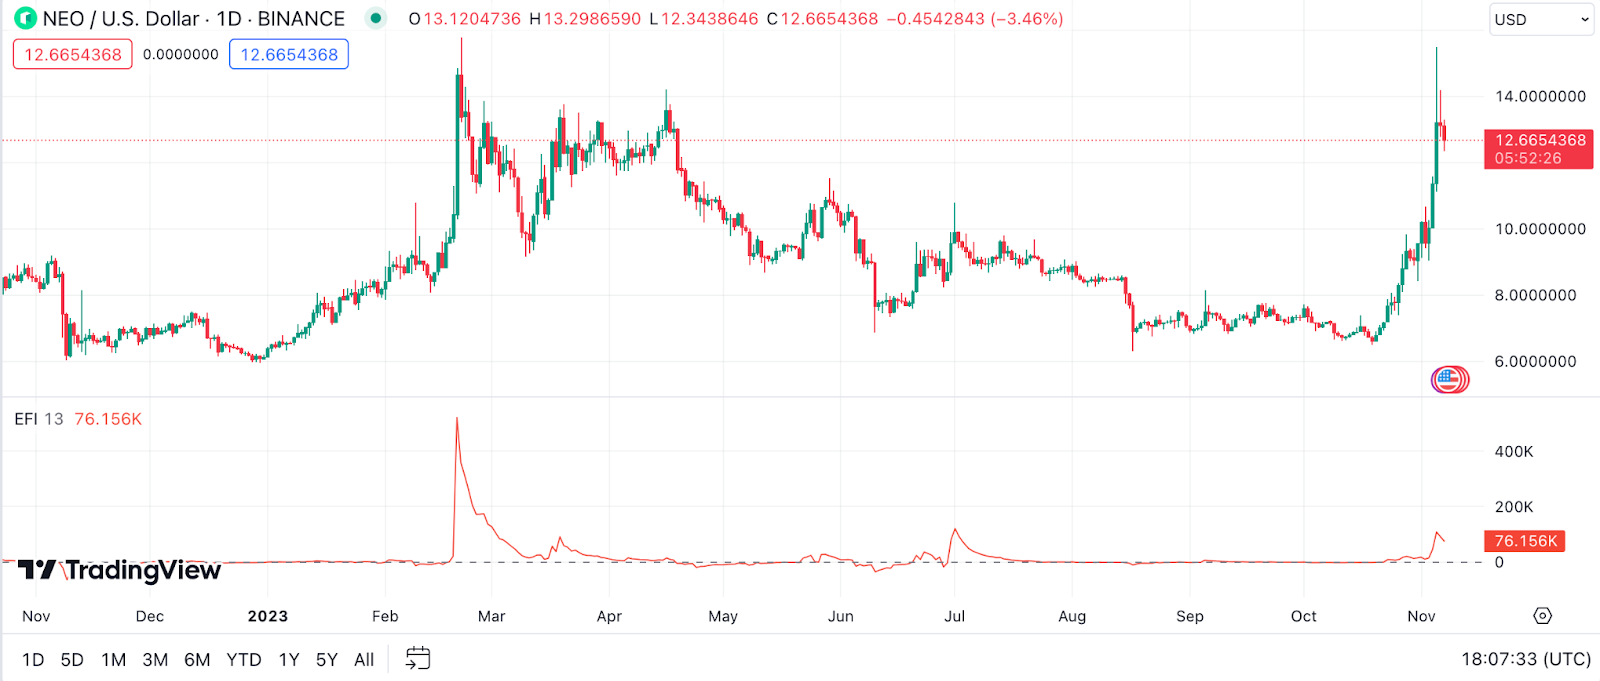
Example: If NEO’s price makes a higher high while the EFI is making a lower high, this negative divergence can be a warning sign that the bullish trend is losing force. Conversely, if NEO’s price makes a new low, but EFI is making a higher low, the bears might be losing control, indicating a potential reversal to the upside.
Williams %R for Neo Price Prediction
The Williams %R, also known as the Williams Percent Range, is a momentum indicator that compares a cryptocurrency’s closing price to the high-low range over a specified period, typically 14 days. It’s used to identify overbought or oversold conditions.
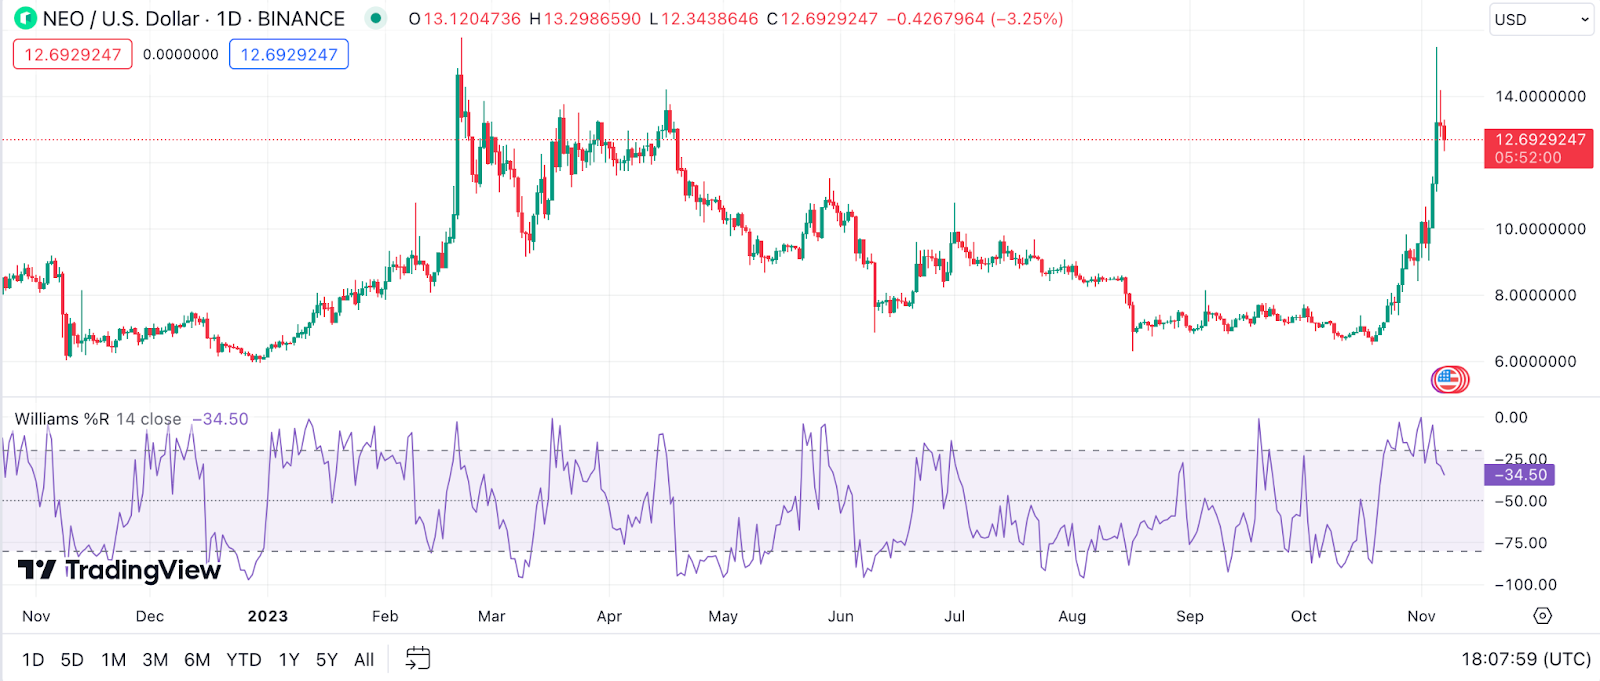
Example: When analyzing NEO, if the Williams %R value falls below -80, it suggests that NEO might be oversold and could be setting up for a reversal or corrective rally. On the flip side, if the indicator rises above -20 and starts to turn down, NEO might be overbought, indicating that a price pullback could be on the horizon.
Combining Technical Indicators for Accurate Neo Price Prediction
When it comes to the nuanced world of crypto price forecasting, one can’t simply throw a dart in the dark and hope for the best. For those of us keen on NEO, combining various technical indicators isn’t just a good idea—it’s essential. Each indicator shines a light on different facets of the market’s behavior, and together, they can illuminate the path NEO’s price might take.
The Importance of Using Multiple Technical Indicators
The markets speak a complex language, and using multiple indicators is akin to having a diversified vocabulary. One indicator might catch the general trend, but it’s the convergence of signals from several indicators that helps filter out the noise, giving us a clearer signal. For NEO, this could mean looking at a combination of short-term and long-term moving averages to grasp both immediate and overarching trends. Adding RSI into the mix could help confirm if the trend is running out of steam or if it still has the gusto to continue.
How to Combine Various Indicators for a Comprehensive Analysis
Combining indicators doesn’t have to be a daunting task. Here’s a refined approach to crafting a well-rounded analysis:
- Correlate Indicators to Market Phases: Some indicators work best in trending markets, others in ranging markets. For NEO, use trend-following indicators like MAs during strong trends, and oscillators like RSI during sideways movements.
- Confirm with Volume: Volume should confirm price action. A rising NEO price should be accompanied by rising volume for a true bullish signal.
- Time Your Entries and Exits: Use indicators like MACD for timing your entries and the Parabolic SAR to set exit points or trailing stop losses.
- Avoid Redundancy: Combining indicators that tell you the same thing might lead to overconfidence in weak signals. Pick indicators that complement rather than repeat each other.
- Adapt and Evolve: The cryptocurrency market is dynamic. An approach that works today may not work tomorrow. Keep testing and tweaking your combination of indicators to stay aligned with market conditions.
Blending the right mix of indicators for NEO involves an understanding that the market is a living ecosystem. Just like a chef adjusts a recipe to the taste of their patrons, a trader should adjust their tools to the rhythms of the market.
The Pillars of Neo Prediction: Fundamental Factors
Cracking the code to NEO’s future price requires more than just reading the charts; it’s about understanding the very pillars that support its value in the marketplace. Here, I’ll guide you through the undercurrents that sway the price of NEO, beyond the technicalities and into the core drivers of its ecosystem.
Adoption Rate
When we speak of adoption, we’re not just counting users, we’re witnessing the unfolding story of NEO’s integration into the fabric of the digital economy. Here’s a closer look at the intricacies of this narrative:
- Network Growth: An expanding network implies more nodes, which enhances security and decentralization, two core tenets that can attract users and developers alike.
- DApp Ecosystem: The number and quality of decentralized applications on the NEO platform can serve as a thermometer for adoption—more and better dApps often mean a thriving ecosystem.
- NEO as a Payment Method: Adoption isn’t just about who’s buying NEO as an investment; it’s also about who’s using NEO to buy goods and services. Increasing merchant acceptance is a significant indicator.
- Educational Initiatives: Efforts by the NEO community to educate the public about its blockchain’s capabilities can foster a knowledgeable base of users and developers, paving the way for wider adoption.
- Community Engagement: An active and engaged community can lead to a network effect, where each new member increases the value of the network for all others.
- Benchmarking Against Competitors: Understanding NEO’s position relative to similar platforms can provide insights into its market penetration and growth potential.
- International Expansion: The adoption of NEO in diverse geographic regions can be a sign of its resilience and adaptability, key traits for long-term viability.
As we track these adoption metrics, we’re not just crunching numbers; we’re mapping the journey of NEO as it carves out its place in the blockchain world. Each new user, each transaction, and each smart contract is a vote of confidence, a building block in NEO’s growing infrastructure.
Regulatory Developments
The winds of regulation can shift the trajectory of any cryptocurrency, and NEO is no exception. Here’s a more detailed examination of how regulatory developments can sway NEO’s course:
- Legislation Changes: New laws around blockchain and cryptocurrency can have a dual impact. Positive regulations may lead to an influx of institutional investors, while restrictive ones can cause prices to tumble.
- Global Standards: As countries work towards global standards for crypto operations, NEO’s adherence to these regulations can make it a prime candidate for international investors seeking compliant assets.
- Compliance Protocols: NEO’s own efforts to stay ahead of regulatory demands, such as implementing KYC (Know Your Customer) and AML (Anti-Money Laundering) protocols, can foster trust and attract cautious capital.
- Cross-border Regulations: How NEO navigates the variegated landscape of international regulations can affect its liquidity and the ease with which it can enter new markets.
- Regulatory Announcements: Even before laws are passed, announcements and guidance from regulatory bodies can cause significant price volatility as the market anticipates future changes.
- Partnerships with Regulated Institutions: Collaborations between NEO and regulated financial institutions can enhance its legitimacy and open up avenues for new utility and adoption.
By staying attuned to these regulatory pulses, one can often anticipate the ebb and flow of NEO’s valuation in the market. It’s a delicate dance between innovation and compliance, with NEO’s price often hanging in the balance.
Utility
NEO’s value is tightly knit with its real-world applications. Here are some expanded thoughts on how NEO’s utility shapes its market position:
- Smart Economy: NEO’s vision of a smart economy integrates digital assets, digital identities, and smart contracts. By facilitating the digitization of assets, NEO enables a more secure and transparent economic transaction system.
- Digital Identity: Through the utilization of blockchain technology, NEO aims to create a universal digital identity system. This can revolutionize how we perform online identity verification, enhancing security for online transactions and services.
- Decentralized Applications (dApps): NEO supports the development of dApps. These applications can range from games to financial tools, and their performance and adoption rates directly influence NEO’s relevance and price.
- Initial Coin Offerings (ICOs): NEO’s platform has been used to launch ICOs, providing startups with a means to raise capital. The success of these ventures contributes to the ecosystem’s growth and, by extension, NEO’s valuation.
- Interoperability: NEO’s focus on interoperability with other blockchains enhances its utility by enabling seamless transactions across different networks, potentially increasing its adoption.
- NeoFS: NEO offers decentralized storage solutions (NeoFS) that incentivize users to share their spare storage capacity, competing with traditional cloud services and adding another layer of utility to the NEO token.
- NeoID: This service provides users with a way to control their identity and personal information, a significant step towards a secure and trustless digital identity system, which can be especially useful in online verification processes.
NEO’s utility is not just a theoretical proposition; it’s about practical and actionable capabilities that push the envelope on what blockchain technology can do for society.
Market Sentiment: How NEO News Prediction Works
Understanding the pulse of the market is akin to a sixth sense in cryptocurrency trading, especially for NEO. Here’s a deeper look into how market sentiment can guide us in NEO news prediction:
- Social Media Analysis: Platforms like Twitter, Reddit, and specialized crypto forums are goldmines for sentiment analysis. Advanced tools and algorithms can now quantify the buzz around NEO, offering insights into whether the crowd is bullish or bearish.
- News Aggregators: Crypto-specific news aggregators compile NEO-related news from various sources, providing a snapshot of the current narrative that can sway investor sentiment. Keeping a tab on these can help you anticipate market reactions to new developments.
- Sentiment Indicators: Tools like the Fear and Greed Index apply to NEO as well. These indicators take multiple data points into account, providing a numerical value to the market’s emotional state, which can signal potential price movements.
- Trading Volume: A sudden spike or drop in trading volume for NEO can reveal shifts in market sentiment even before prices fully reflect it. Observing this can give you a head start in predicting where the market might be heading.
- Influencer Opinion: High-profile cryptocurrency influencers can sway the sentiment dramatically with just a single statement. Monitoring their opinions can offer early signs of a shift in market mood.
- Technical Analysis Correlation: Combining sentiment analysis with technical indicators provides a more rounded perspective. For instance, if the sentiment is bullish but the NEO technical analysis forecasts a correction, it may signal a short-term hype followed by a potential sell-off.
- News Events and Announcements: Upcoming events like NEO conferences, updates, or partnership announcements can greatly affect sentiment. An investor who is tuned into the NEO ecosystem’s calendar will be better equipped to predict how these events might impact market sentiment.
Staying ahead in the NEO market is not just about reading the news. It’s about interpreting the collective emotional response to that news and understanding how it might translate into buying or selling pressure.
The Bottom Line: Making Your Own NEO Price Predictions
As we pull together the threads of expert insights, the meticulous craft of technical analysis, and the foundational bedrock of fundamental evaluation, our journey through the landscape of Neo price prediction comes to a close. It’s been a deep dive, not just into charts and figures, but into the very psyche of the market itself. Through the collective wisdom of many traders and the nuanced interpretation of emerging trends, we’ve aimed to equip you with a multifaceted view of Neo’s potential path.
Remember, the crypto horizon is perpetually changing, and while predictions can give us a compass, they’re not a map to buried treasure. Invest with caution, blend analysis with instinct, and may your digital currency endeavors be as dynamic and promising as the market itself.
FAQ
When Will NEO Go Up?
Predicting the exact timing of NEO’s price increase is like trying to catch lightning in a bottle—thrilling, but wildly unpredictable. Markets move on a cocktail of factors—news, sentiment, and technical triggers. If NEO continues to innovate and gets more adoption, it could see an uptick. However, always keep an eye on the overall market trend—it’s your best clue for timing.
Should I Buy NEO?
Whether NEO deserves a spot in your portfolio depends on your appetite for risk and belief in the project. NEO’s unique features and active development team give it an edge, but it’s not without its share of high volatility. Do your own research, consider diversification, and never invest more than you can afford to lose.
How High Can NEO Go?
Sky’s the limit—or so the optimists say. NEO has potential, especially with its smart economy concept. But in the stratosphere of NEO prices, there are many variables at play. Keep a close watch on adoption rates and the platform’s updates. These could fuel its engine to soar high or could just simmer without takeoff.
Will NEO Crash Again in 2024?
If I had a crystal ball, I’d be at the beach, not pondering NEO’s fortunes. Jokes aside, cryptos are known for their roller-coaster rides. Market sentiment, regulatory news, or a shift in investor preference can all send it tumbling. Stay updated, stay educated, and maybe keep that seatbelt fastened—it could be a bumpy ride.