
Hello, and welcome to our in-depth exploration of NEAR Protocol price prediction. Understanding the future trajectory of NEAR Protocol’s value is a complex yet intriguing journey, which is exactly why we’ve dedicated today’s article to unraveling its mysteries. Navigating the volatile world of cryptocurrency can be daunting, but we’re here to guide you through the intricacies of NEAR Protocol’s price history, its foundational goals, and the comprehensive methodologies traders employ to predict its market movements.
Predicting the price of NEAR Protocol, or any cryptocurrency, is not a straightforward task. It involves a blend of analytical techniques, market sentiment analysis, and a deep dive into the cryptocurrency’s fundamental and technical aspects. Our exploration today will shed light on these varied approaches, offering a clear perspective on how experts forecast the NEAR crypto rate. This understanding is crucial for both seasoned traders and new enthusiasts alike, as it equips them with the knowledge to make informed decisions in the dynamic crypto market.
Understanding the value prediction of the NEAR coin is more than a mere speculative exercise; it’s a vital part of strategic investment planning. The cryptocurrency market’s notorious volatility makes informed predictions a valuable tool for managing risk and identifying potential growth opportunities. Our discussion today aims to provide you with these insights, enabling you to approach NEAR Protocol investments with confidence and clarity.
So, whether you’re a long-term investor, a curious observer, or somewhere in between, we invite you to join us on this insightful journey. Grab a cup of coffee, settle in, and let’s delve into the world of NEAR Protocol price prediction together. Your journey towards mastering the art of cryptocurrency forecasting starts here!
NEAR Protocol (NEAR) Overview
| NEAR Price | $2.48 |
| NEAR Price Change 24h | -1.61% |
| NEAR Price Change 7d | 15.99% |
| NEAR Market Cap | $3,057,580,035.91 |
| NEAR Circulation Supply | 1,232,381,999.00 |
| NEAR Trading Volume | $289,419,715.08 |
| NEAR All-Time High (ATH) | $20.42 |
| NEAR All-Time Low (ATL) | $0.526 |
A Brief History: NEAR Protocol and Its Purpose
NEAR Protocol, a key player in the crypto universe, has an intriguing tale that merits exploration, especially when considering the NEAR Protocol price prediction. This blockchain platform was crafted with a clear vision: to bridge the gap between high-tech blockchain capabilities and user-friendly experiences. Its inception lies in the desire to address the limitations of earlier blockchain systems – primarily scalability and user accessibility.
At its core, NEAR Protocol stands as a decentralized development platform, distinguishing itself through its unique approach to scalability and efficiency. The protocol operates on a proof-of-stake consensus mechanism, which is not just energy-efficient but also contributes to its robust scalability. This innovative framework allows for lightning-fast transaction speeds and significantly lower costs, making it an attractive option for developers and users alike.
But what truly sets NEAR apart is its commitment to simplicity and accessibility. The platform is designed to be user-friendly, inviting even those with minimal technical background to engage with blockchain technology. This inclusivity is a pivotal aspect of NEAR’s philosophy, aiming to democratize the blockchain space and foster a diverse community of users and developers.
Notable NEAR’s Price Fluctuations
The journey of NEAR’s value has been marked by several noteworthy fluctuations, reflecting the typical volatility of the cryptocurrency market. Here’s a look at some of its significant price movements:
- Initial Launch Spike: NEAR native token experienced a surge in value shortly after its initial launch, capturing the attention of early adopters and investors.
- Major Partnership Announcements: Collaborations with notable companies led to significant upticks in its price, showcasing the market’s confidence in its growing ecosystem.
- Market-Wide Downturns: Like many cryptocurrencies, NEAR wasn’t immune to broader market downturns, which saw its value dip in response to global economic trends.
- Developmental Milestones: Each time NEAR achieved a significant developmental milestone, such as protocol upgrades or successful project launches, its price reflected positive investor sentiment.
NEAR Protocol – NEAR Price Prediction For Today, Tomorrow, This Week, and Next 30 Days
| Date | Price | Change |
|---|---|---|
| July 12, 2025 | 2.49 | 0.32% |
| July 13, 2025 | 2.49 | -0.04% |
| July 14, 2025 | 2.47 | -0.61% |
| July 15, 2025 | 2.45 | -0.76% |
| July 16, 2025 | 2.47 | 0.80% |
| July 17, 2025 | 2.49 | 0.54% |
| July 18, 2025 | 2.49 | 0.32% |
| July 19, 2025 | 2.49 | -0.03% |
| July 20, 2025 | 2.48 | -0.40% |
| July 21, 2025 | 2.49 | 0.23% |
| July 22, 2025 | 2.51 | 0.76% |
| July 23, 2025 | 2.49 | -0.53% |
| July 24, 2025 | 2.48 | -0.40% |
| July 25, 2025 | 2.46 | -0.93% |
| July 26, 2025 | 2.45 | -0.63% |
| July 27, 2025 | 2.45 | 0.19% |
| July 28, 2025 | 2.47 | 0.66% |
| July 29, 2025 | 2.47 | -0.07% |
| July 30, 2025 | 2.46 | -0.20% |
| July 31, 2025 | 2.45 | -0.61% |
| August 01, 2025 | 2.47 | 0.99% |
| August 02, 2025 | 2.47 | -0.14% |
| August 03, 2025 | 2.49 | 0.93% |
| August 04, 2025 | 2.47 | -0.69% |
| August 05, 2025 | 2.47 | 0.04% |
| August 06, 2025 | 2.46 | -0.35% |
| August 07, 2025 | 2.44 | -0.98% |
| August 08, 2025 | 2.42 | -0.72% |
| August 09, 2025 | 2.44 | 0.68% |
| August 10, 2025 | 2.43 | -0.48% |
NEAR Protocol Price Prediction 2024
After conducting an in-depth analysis of the projected price data for NEAR in 2024, we’ve uncovered some intriguing forecasts. Our NEAR Protocol price prediction suggests a potential minimum price of $2.23. On the other hand, the average price of NEAR is expected to stabilize at around $2.61. In a bullish market scenario, we might see highs soaring to $2.98.
Looking at the current landscape, NEAR Protocol’s outlook for 2024 appears optimistic, showing signs of a stable growth trajectory. This steady price prediction indicates that we might avoid the extremes of market volatility. However, for those who enjoy a bit of risk in their investment portfolio, this situation could present an excellent opportunity for significant gains, particularly given NEAR’s typical market fluctuations.
Here’s a piece of good investment advice for our cryptocurrency enthusiasts: proceed with caution. It’s essential to conduct thorough research and comprehensive due diligence before making any investments, especially in the volatile world of digital currencies.
| Month | Minimum Price | Average Price | Maximum Price |
|---|---|---|---|
| February 2024 | 3.25 | 3.38 | 3.52 |
| March 2024 | 3.34 | 3.47 | 3.61 |
| April 2024 | 3.43 | 3.56 | 3.71 |
| May 2024 | 3.52 | 3.66 | 3.81 |
| June 2024 | 3.62 | 3.76 | 3.91 |
| July 2024 | 3.72 | 3.86 | 4.02 |
| August 2024 | 3.82 | 3.96 | 4.13 |
| September 2024 | 3.92 | 4.07 | 4.24 |
| October 2024 | 4.03 | 4.18 | 4.35 |
| November 2024 | 4.14 | 4.29 | 4.47 |
| December 2024 | 4.25 | 4.41 | 4.59 |
| January 2025 | 4.36 | 4.53 | 4.72 |
January 2024: NEAR Protocol Price Forecast
As we embark on a new year, the forecasting models suggest a sturdy beginning for NEAR with a minimal price of $2.93, an average hovering around $3.25, and a potential spike to a maximum price of $3.38. This indicates a bullish outset for investors, suggesting that NEAR Protocol’s fundamentals are gaining solid ground within the crypto community.
NEAR Price Forecast for February 2024
Based on the price data for February 2024, it’s evident that NEAR Protocol is expected to see a minimum price of $3.25, an average hovering around $3.38, and a maximum price capping at $3.52. This implies a steady climb from any preceding values, indicating an optimistic market sentiment and potentially growing adoption of the NEAR Protocol among investors.
March 2024: NEAR Protocol Price Forecast
Crypto analysts have checked the price fluctuations of NEAR Protocol in March 2024, and the prognosis is favorable. The asset is predicted to maintain a bullish trajectory with the minimum price at $3.34, the average price likely to be $3.47, and the maximum price could ascend to $3.61. This suggests a solidifying trust in NEAR Protocol’s market position.
NEAR Price Forecast for April 2024
In April 2024, the technical analysis of NEAR Protocol prices indicates a continuation of the upward trend. The minimum price is anticipated to be $3.43, with an average price forecasted at $3.56, and the maximum price could reach $3.71. This consistent increase could be a result of ongoing positive developments within the NEAR ecosystem.
May 2024: NEAR Protocol Price Forecast
As we delve into May 2024, crypto experts have analyzed NEAR Protocol prices and expect to see the minimum price at $3.52. The average price is projected to be around $3.66, while the maximum price might peak at $3.81. Such progression points to a robust market presence and could reflect investor optimism in blockchain technology advancements.
NEAR Price Forecast for June 2024
Midway through the year 2024, NEAR Protocol’s price trajectory appears to remain on an ascent. With a minimum price of $3.62, an average price of $3.76, and a maximum price of $3.91, June could likely showcase the strengthening of NEAR’s market performance, potentially fueled by increased utility and strategic partnerships within the ecosystem.
July 2024: NEAR Protocol Price Forecast
Crypto enthusiasts and investors could likely witness NEAR Protocol’s continued price increase in July 2024. The asset’s minimum price is expected to be $3.72, with an average price at a promising $3.86, and the maximum price might climb to $4.02. This could be indicative of a strong bullish phase, possibly driven by significant network upgrades or increased transaction volumes.
NEAR Price Forecast for August 2024
August 2024 forecasts for NEAR Protocol indicate a sustained positive momentum. The minimum price is projected to rise to $3.82, maintaining an average price of $3.96, and reaching a maximum price of $4.13. Such a trend could reflect a growing confidence in the long-term viability of the NEAR platform and its technological offerings.
September 2024: NEAR Protocol Price Forecast
According to the latest data gathered, September 2024 shows no signs of a slowdown in NEAR Protocol’s price appreciation. A minimum price of $3.92, an average price of $4.07, and a maximum price of $4.24 are anticipated, suggesting a robust market performance and potentially a heightened demand for NEAR tokens.
NEAR Price Forecast for October 2024
Crypto analysts have checked the price fluctuations of NEAR Protocol for October 2024, predicting a minimum price of $4.03, an average price at $4.18, and a maximum price of $4.35. This could potentially be a result of the increasing recognition of NEAR as a major player in the decentralized finance (DeFi) space.
November 2024: NEAR Protocol Price Forecast
In November 2024, NEAR Protocol is expected to maintain its positive price movement. The forecasted minimum price stands at $4.14, the average price at $4.29, and the maximum price could potentially hit $4.47. The continued uptrend might be attributed to the network’s scalability solutions being increasingly adopted.
NEAR Price Forecast for December 2024
Concluding the year, December’s NEAR Protocol price prediction suggests a minimum price of $4.25, an average price of $4.41, and the maximum price reaching a bullish $4.59. This expected growth trajectory may reflect the culmination of a year marked by successful project milestones and enhanced investor confidence.
NEAR Protocol Price Prediction 2025
In 2025, the NEAR Protocol seems poised for continued growth. Our latest data gathered points to a minimum price of $4.31, reflecting increased investor confidence. The market is expected to average out at $5.12, maintaining a consistent upward trajectory. The potential maximum price of $6.08 hints at the possibility of significant gains for investors willing to ride the wave of this advancing crypto asset.
| Month | Minimum Price | Average Price | Maximum Price |
|---|---|---|---|
| February 2025 | 4.31 | 4.48 | 4.66 |
| March 2025 | 4.43 | 4.60 | 4.79 |
| April 2025 | 4.55 | 4.72 | 4.92 |
| May 2025 | 4.67 | 4.85 | 5.05 |
| June 2025 | 4.80 | 4.98 | 5.19 |
| July 2025 | 4.93 | 5.12 | 5.33 |
| August 2025 | 5.06 | 5.25 | 5.47 |
| September 2025 | 5.20 | 5.40 | 5.62 |
| October 2025 | 5.34 | 5.54 | 5.77 |
| November 2025 | 5.48 | 5.69 | 5.92 |
| December 2025 | 5.63 | 5.84 | 6.08 |
| January 2026 | 5.78 | 6.00 | 6.25 |
NEAR Protocol Price Prediction 2026
Our projection for 2026 indicates a progressive trend for NEAR Protocol. The minimum price is expected to rise to $5.72, showcasing a robust market presence. An average price of $6.78 could be the norm, signifying a stable and healthy market. The maximum price could soar to $8.07, offering optimistic prospects for investors engaged in the NEAR ecosystem.
| Month | Minimum Price | Average Price | Maximum Price |
|---|---|---|---|
| February 2026 | 5.72 | 5.94 | 6.18 |
| March 2026 | 5.87 | 6.10 | 6.35 |
| April 2026 | 6.03 | 6.26 | 6.52 |
| May 2026 | 6.19 | 6.43 | 6.69 |
| June 2026 | 6.36 | 6.60 | 6.87 |
| July 2026 | 6.53 | 6.78 | 7.06 |
| August 2026 | 6.71 | 6.96 | 7.25 |
| September 2026 | 6.89 | 7.15 | 7.45 |
| October 2026 | 7.07 | 7.35 | 7.65 |
| November 2026 | 7.27 | 7.54 | 7.85 |
| December 2026 | 7.46 | 7.75 | 8.07 |
| January 2027 | 7.66 | 7.96 | 8.28 |
NEAR Protocol Price Prediction 2027
As we look towards 2027, NEAR Protocol’s potential continues to shine. The forecast suggests a minimum price of $7.58, indicating a growing market confidence. With an average price of $8.99, we anticipate a solid market performance. The anticipated maximum price of $10.69 could spell substantial profits for savvy investors who are closely monitoring the NEAR market trends.
| Month | Minimum Price | Average Price | Maximum Price |
|---|---|---|---|
| February 2027 | 7.58 | 7.87 | 8.19 |
| March 2027 | 7.78 | 8.08 | 8.41 |
| April 2027 | 7.99 | 8.30 | 8.64 |
| May 2027 | 8.21 | 8.52 | 8.87 |
| June 2027 | 8.43 | 8.75 | 9.11 |
| July 2027 | 8.66 | 8.99 | 9.36 |
| August 2027 | 8.89 | 9.23 | 9.61 |
| September 2027 | 9.13 | 9.48 | 9.87 |
| October 2027 | 9.38 | 9.74 | 10.13 |
| November 2027 | 9.63 | 10.00 | 10.41 |
| December 2027 | 9.89 | 10.27 | 10.69 |
| January 2028 | 10.16 | 10.55 | 10.98 |
NEAR Protocol Price Prediction 2028
Heading into 2028, the outlook for NEAR Protocol remains promising. We anticipate a minimum price of $10.05, highlighting its steady market growth. An average price of $11.92 suggests a continued upward trend. The maximum price could reach an impressive $14.18, presenting potentially lucrative opportunities for those invested in the NEAR Protocol.
| Month | Minimum Price | Average Price | Maximum Price |
|---|---|---|---|
| February 2028 | 10.05 | 10.43 | 10.86 |
| March 2028 | 10.32 | 10.72 | 11.16 |
| April 2028 | 10.60 | 11.01 | 11.46 |
| May 2028 | 10.88 | 11.30 | 11.77 |
| June 2028 | 11.18 | 11.61 | 12.08 |
| July 2028 | 11.48 | 11.92 | 12.41 |
| August 2028 | 11.79 | 12.24 | 12.74 |
| September 2028 | 12.11 | 12.57 | 13.09 |
| October 2028 | 12.44 | 12.91 | 13.44 |
| November 2028 | 12.77 | 13.26 | 13.81 |
| December 2028 | 13.12 | 13.62 | 14.18 |
| January 2029 | 13.47 | 13.99 | 14.56 |
NEAR Protocol Price Prediction 2029
The year 2029 appears to hold bright prospects for NEAR Protocol. Our analysis points to a minimum price of $13.32, reinforcing its strong market position. The average price is expected to be around $15.80, indicative of sustained growth. With a maximum price of $18.80 on the horizon, this year could offer rewarding opportunities for NEAR investors.
| Month | Minimum Price | Average Price | Maximum Price |
|---|---|---|---|
| February 2029 | 13.32 | 13.83 | 14.40 |
| March 2029 | 13.68 | 14.21 | 14.79 |
| April 2029 | 14.05 | 14.59 | 15.19 |
| May 2029 | 14.43 | 14.98 | 15.60 |
| June 2029 | 14.82 | 15.39 | 16.02 |
| July 2029 | 15.22 | 15.80 | 16.45 |
| August 2029 | 15.63 | 16.23 | 16.90 |
| September 2029 | 16.05 | 16.67 | 17.35 |
| October 2029 | 16.49 | 17.12 | 17.82 |
| November 2029 | 16.93 | 17.58 | 18.30 |
| December 2029 | 17.39 | 18.06 | 18.80 |
| January 2030 | 17.86 | 18.54 | 19.30 |
NEAR Protocol Price Prediction 2030
As we venture into 2030, the NEAR Protocol’s trajectory looks increasingly optimistic. A projected minimum price of $17.66 suggests a confident market stance. The average price, estimated at $20.96, underscores a stable and growing ecosystem. The potential for a maximum price of $24.92 could provide substantial returns for those invested in the dynamic world of NEAR Protocol.
| Month | Minimum Price | Average Price | Maximum Price |
|---|---|---|---|
| February 2030 | 17.66 | 18.34 | 19.09 |
| March 2030 | 18.14 | 18.84 | 19.61 |
| April 2030 | 18.63 | 19.35 | 20.14 |
| May 2030 | 19.13 | 19.87 | 20.68 |
| June 2030 | 19.65 | 20.40 | 21.24 |
| July 2030 | 20.18 | 20.96 | 21.81 |
| August 2030 | 20.73 | 21.52 | 22.40 |
| September 2030 | 21.28 | 22.10 | 23.01 |
| October 2030 | 21.86 | 22.70 | 23.63 |
| November 2030 | 22.45 | 23.31 | 24.27 |
| December 2030 | 23.06 | 23.94 | 24.92 |
| January 2031 | 23.68 | 24.59 | 25.60 |
NEAR Protocol Price Prediction 2031
Looking ahead to 2031, NEAR Protocol continues to demonstrate its market resilience. The minimum price is forecasted at $23.42, reflecting a solid foundation. An average price of $27.78 points to a well-balanced market. The anticipated highest price of $33.05 opens up avenues for significant gains, highlighting the potential of NEAR as a long-term investment.
| Month | Minimum Price | Average Price | Maximum Price |
|---|---|---|---|
| February 2031 | 23.42 | 24.32 | 25.32 |
| March 2031 | 24.05 | 24.98 | 26.00 |
| April 2031 | 24.70 | 25.65 | 26.70 |
| May 2031 | 25.37 | 26.34 | 27.42 |
| June 2031 | 26.05 | 27.05 | 28.16 |
| July 2031 | 26.76 | 27.78 | 28.92 |
| August 2031 | 27.48 | 28.53 | 29.70 |
| September 2031 | 28.22 | 29.31 | 30.51 |
| October 2031 | 28.98 | 30.10 | 31.33 |
| November 2031 | 29.77 | 30.91 | 32.18 |
| December 2031 | 30.57 | 31.74 | 33.05 |
| January 2032 | 31.39 | 32.60 | 33.94 |
NEAR Protocol Price Prediction 2032
In 2032, the future of NEAR Protocol appears robust. We predict a minimum price of $31.04, showcasing its enduring market appeal. The average price is set to hover around $36.83, indicating steady growth. An optimistic maximum price of $43.80 suggests the possibility of impressive gains for those keeping a keen eye on the evolving trends in the NEAR Protocol ecosystem.
| Month | Minimum Price | Average Price | Maximum Price |
|---|---|---|---|
| February 2032 | 31.04 | 32.24 | 33.56 |
| March 2032 | 31.88 | 33.11 | 34.47 |
| April 2032 | 32.74 | 34.00 | 35.40 |
| May 2032 | 33.63 | 34.92 | 36.35 |
| June 2032 | 34.54 | 35.86 | 37.33 |
| July 2032 | 35.47 | 36.83 | 38.34 |
| August 2032 | 36.43 | 37.83 | 39.38 |
| September 2032 | 37.41 | 38.85 | 40.44 |
| October 2032 | 38.42 | 39.90 | 41.53 |
| November 2032 | 39.46 | 40.97 | 42.65 |
| December 2032 | 40.52 | 42.08 | 43.80 |
| January 2033 | 41.62 | 43.22 | 44.99 |
The Main Questions Of Critical Thinking When We Talk About NEAR Protocol Price Forecast
When delving into the realm of cryptocurrency, particularly with a focus on NEAR Protocol price forecasts, engaging in critical thinking is essential. In this section, we will explore some key questions that capture the essence of critical thinking in the context of forecasting NEAR Protocol prices.
- What are the fundamental factors driving NEAR’s value?
- How does NEAR Protocol’s technical development impact its price?
- What market trends and external factors could influence NEAR’s price?
- How have historical price patterns of NEAR Protocol informed current predictions?
- What role do regulatory changes play in NEAR’s price forecast?
- How reliable are the sources and models used for NEAR Protocol price prediction?
- What are the potential risks involved in investing in NEAR?
- How does NEAR’s performance compare to other cryptocurrencies?
- What impact could global economic conditions have on NEAR’s price?
- How do investor sentiment and public perception affect NEAR’s market value?
- What are the possible scenarios for NEAR’s growth in the short and long term?
- How do liquidity and trading volume influence NEAR’s price volatility?
- What technological advancements or setbacks could alter NEAR’s price trajectory?
- How does the scalability and efficiency of NEAR Protocol affect its attractiveness to investors?
- What role does competition from other blockchain platforms play in NEAR’s price dynamics?
- How might political events or changes in government policies impact NEAR Protocol’s current value?
- What is the likelihood of NEAR Protocol achieving its projected milestones and how would this affect its price?
- How does the overall cryptocurrency market’s health influence NEAR’s price?
- What are the potential impacts of cybersecurity threats on NEAR Protocol’s price stability?
- How should one balance optimism and caution when considering the NEAR price forecast?
These critical thinking questions intend to guide investors, traders, and enthusiasts through their analysis and decision-making processes. This ensures a comprehensive and informed approach to understanding the potential market movements of NEAR Protocol.
NEAR Protocol (NEAR) Future Price Predictions by Experts
Exploring insights from industry experts and analysts provides valuable perspectives on the potential future price of NEAR Protocol, the native cryptocurrency of NEAR Protocol. However, it’s important to remember that these opinions, even though they come from experienced professionals, should not be considered as direct investment advice.
- WalletInvestor: According to WalletInvestor, their NEAR token price prediction suggested the token was a “bad” investment. WalletInvestor’s NEAR Protocol coin’s price prediction for the end of 2024 indicated it would have dropped to $0.10.
- DigitalCoinPrice: DigitalCoinPrice provided a more optimistic outlook for the NEAR coin. According to this forecaster, the coin’s average trading price could increase to $3.84 by the end of 2024 and further to $5.13 by the end of 2025. DigitalCoinPrice’s NEAR Protocol price prediction for 2025 suggested it could climb to $6.60, potentially reaching a maximum level of $21.62 by 2030.
- Price Prediction: Price Prediction offered a similar forecast. Its NEAR Protocol prediction indicated NEAR would have averaged out at $1.84 by the end of 2024 and $5.55 by 2025. Their current NEAR Protocol price prediction for 2030 gave an optimistic value of $33.55.
Decoding the Charts: NEAR Technical Price Analysis
When it comes to understanding the NEAR Protocol’s market behavior, technical price analysis stands out as a crucial tool. It’s like unraveling a complex code, each element revealing a part of the bigger picture. Here’s a look at some key concepts and tools that I’ve found invaluable in this intricate decoding process:
- Price Charts: These are essential for visualizing NEAR’s price action over time. Whether it’s a simple line chart or a more detailed candlestick chart, each type provides unique insights into the market’s behavior.
- Technical Indicators: Tools like the Relative Strength Index (RSI), Moving Averages (MA), and the Moving Average Convergence Divergence (MACD) help us analyze market trends and momentum for NEAR.
- Chart Patterns: Identifying common patterns, such as head and shoulders, triangles, and wedges, can give clues about potential future movements in NEAR’s price.
- Volume Analysis: Observing trading volume alongside price changes can provide insights into the strength or weakness of a price trend.
- Fibonacci Retracement Levels: These are used to identify potential support and resistance areas, offering insight into possible reversal points in NEAR’s price movement.
- Trend Lines and Channels: Drawing lines that connect significant highs and lows helps in identifying the current trend and potential breakout or breakdown points.
- Oscillators: Indicators that oscillate between two extremes, like the Stochastic Oscillator or the Commodity Channel Index (CCI), are used to determine overbought or oversold conditions.
- Candlestick Patterns: Recognizing certain candlestick formations can signal potential reversals or continuation of existing trends, providing an additional layer of analysis.
Technical Indicators: Origin and Purpose
Technical indicators, in essence, are the mathematicians of the financial world. Originating from the need to distill vast amounts of market data into actionable insights, these tools offer us a way to interpret market trends and patterns. Think of them as the lenses through which we view the seemingly chaotic movements of market prices. They sift through the noise, helping us focus on what matters.
The birth of technical indicators can be traced back to the early days of trading, evolving from simple charting techniques to complex algorithms. Their purpose? To provide a clearer understanding of market sentiment, trends, and potential turning points. It’s not just about knowing where the market has been, but gaining insights into where it might be headed.
The Role of Technical Indicators in Financial Markets
Technical indicators are like the pulse monitors of the financial markets. They measure various aspects of market behavior – like price momentum, volume, and volatility – and present them in a form that’s easier to understand and act upon. Each indicator tells a story, whether it’s the RSI indicating overbought or oversold conditions or moving averages highlighting a potential trend reversal.
Their role extends beyond just prediction. They provide a framework for traders and investors to structure their analysis, helping them to make more informed decisions. They are the unsung heroes in a trader’s toolkit, often guiding the decision-making process in both calm and turbulent market conditions.
How Technical Indicators Can Help Predict NEAR Price
Now, let’s apply this to NEAR Protocol. Technical indicators can be particularly enlightening in this volatile crypto space. By analyzing NEAR’s price movements through indicators like Bollinger Bands or MACD, we can gauge the market’s mood, spotting potential entry and exit points.
For instance, a moving average crossover could hint at a change in NEAR’s price trend, while an oscillator reaching an extreme could suggest a potential price reversal. It’s about piecing together these clues to form a clearer picture of NEAR’s market trajectory.
Remember, though, these tools are not crystal balls. They offer probabilities, not certainties. The key is to use them wisely, combining them with other analysis methods and staying attuned to the broader market context. In this section, I’m going to outline the key indicators that have significantly influenced my trading journey. Plus, I’ll provide practical examples to show you how these can be effectively applied in predicting NEAR’s price movements.
Moving Averages (MAs) for NEAR Protocol Price Prediction
Moving Averages (MAs) are among the most widely used tools in technical analysis, primarily for identifying the trend direction and potential reversals in prices. In essence, MAs smooth out price data by creating a single flowing line, making it easier to identify the direction of the trend. For NEAR Protocol, using a combination of short-term and long-term MAs – like the 50-day and 200-day – can provide valuable insights into market sentiment.
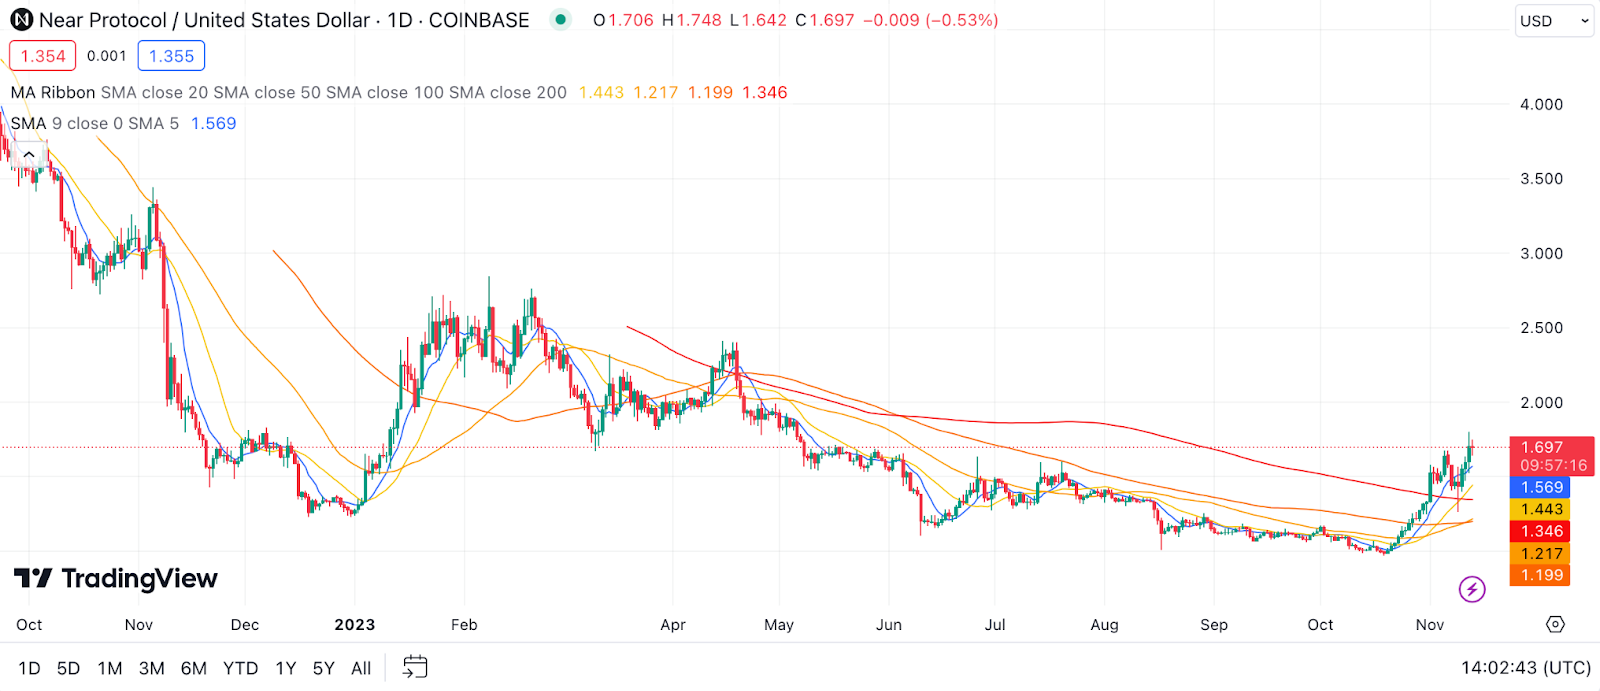
Example: When the 50-day MA of NEAR crosses above the 200-day MA, it’s often considered a bullish signal, suggesting that NEAR’s price could be on an upward trajectory. Conversely, if the 50-day MA crosses below the 200-day MA, it might indicate a bearish trend. Observing these crossovers in NEAR’s chart could aid in making predictive decisions about its future price movement.
Relative Strength Index (RSI) for NEAR Protocol Price Prediction
The Relative Strength Index (RSI) is a momentum oscillator that measures the speed and change of price movements. RSI oscillates between zero and 100 and is typically used to identify overbought or oversold conditions. An RSI above 70 typically indicates that NEAR might be overbought and due for a pullback, while an RSI below 30 could suggest that NEAR is oversold and potentially poised for a rebound.
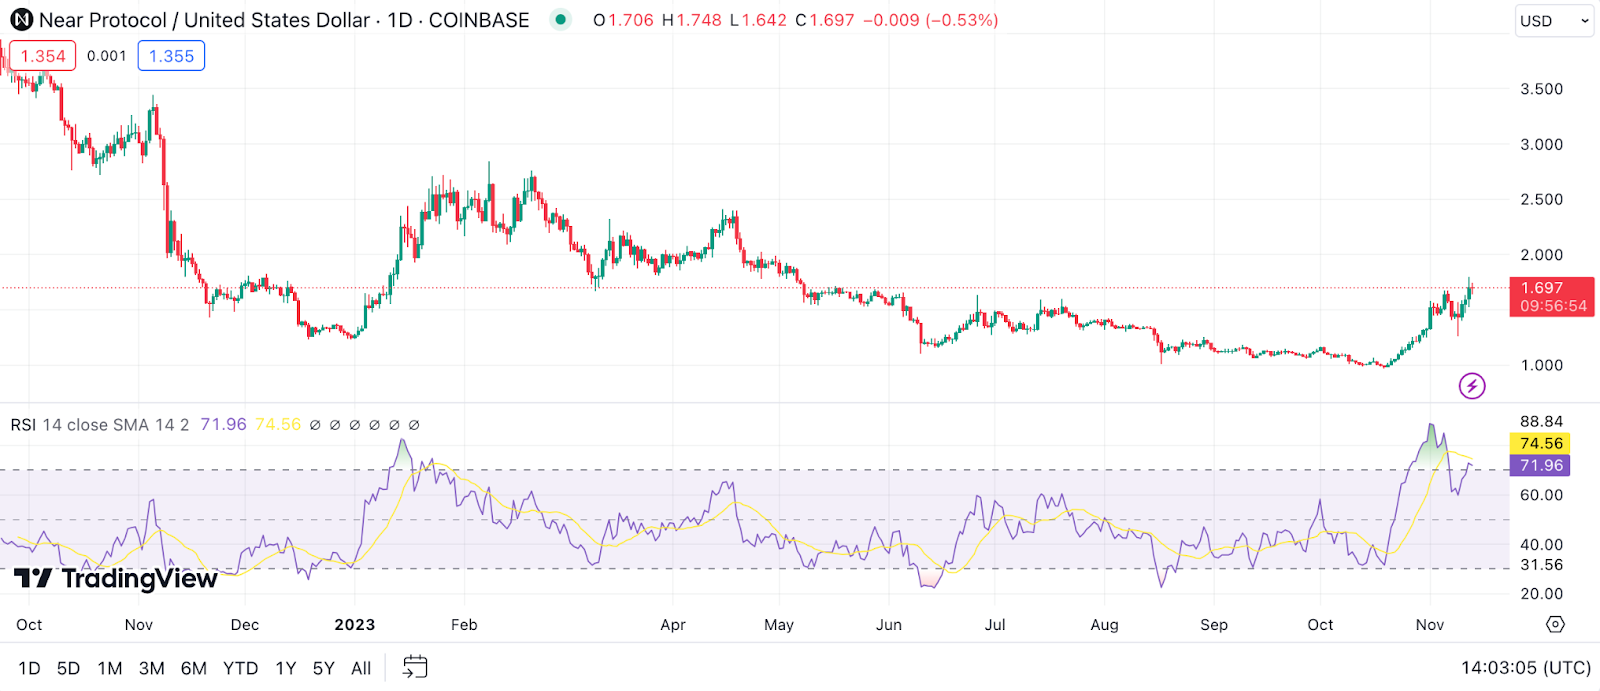
Example: If NEAR’s RSI climbs above 70, it might be a signal to traders to consider selling, anticipating a potential price correction. Similarly, an RSI below 30 could signal a good buying opportunity, predicting a possible price increase as the market corrects from being oversold.
Moving Average Convergence Divergence (MACD) for NEAR Protocol Price Prediction
The Moving Average Convergence Divergence (MACD) is a trend-following momentum indicator that shows the relationship between two moving averages of a security’s price. The MACD is calculated by subtracting the 26-period Exponential Moving Average (EMA) from the 12-period EMA. The MACD line crossing above the signal line is considered bullish, while crossing below is bearish.
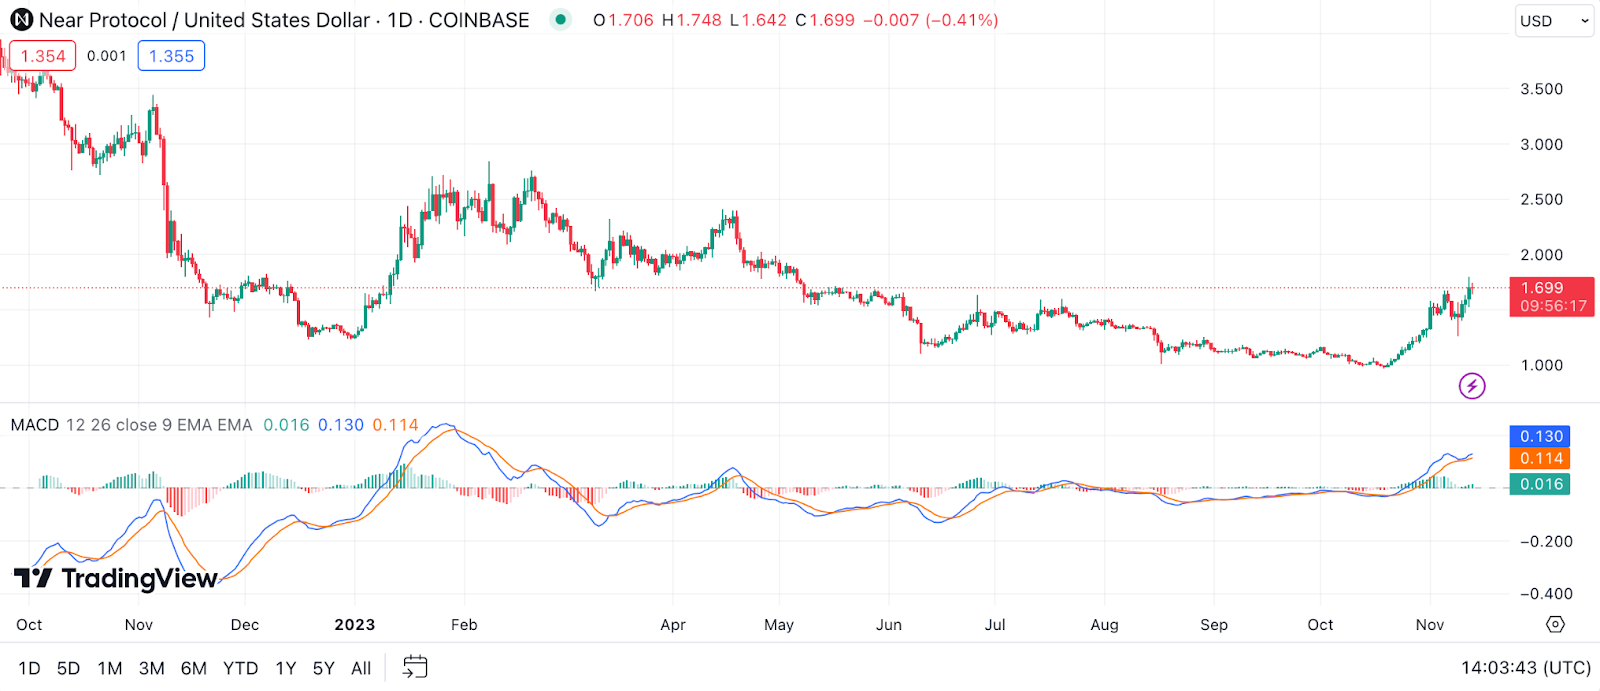
Example: For NEAR Protocol, if the MACD line crosses above the signal line, it can be interpreted as a bullish signal, suggesting it might be a good time to buy. Conversely, a cross below the signal line might indicate a selling point, suggesting that NEAR’s price could be heading for a downturn. By monitoring NEAR’s MACD, traders can make more informed decisions based on the momentum of its price movements.
Bollinger Bands for NEAR Protocol Price Prediction
Bollinger Bands are a technical analysis tool defined by a set of trendlines plotted two standard deviations (positively and negatively) away from a simple moving average (SMA) of a security’s price. They help in identifying the volatility and overbought or oversold conditions in the market. When the bands contract, it indicates decreased volatility, and when they expand, it suggests increased volatility. For NEAR Protocol, Bollinger Bands can be crucial in pinpointing potential entry and exit points.
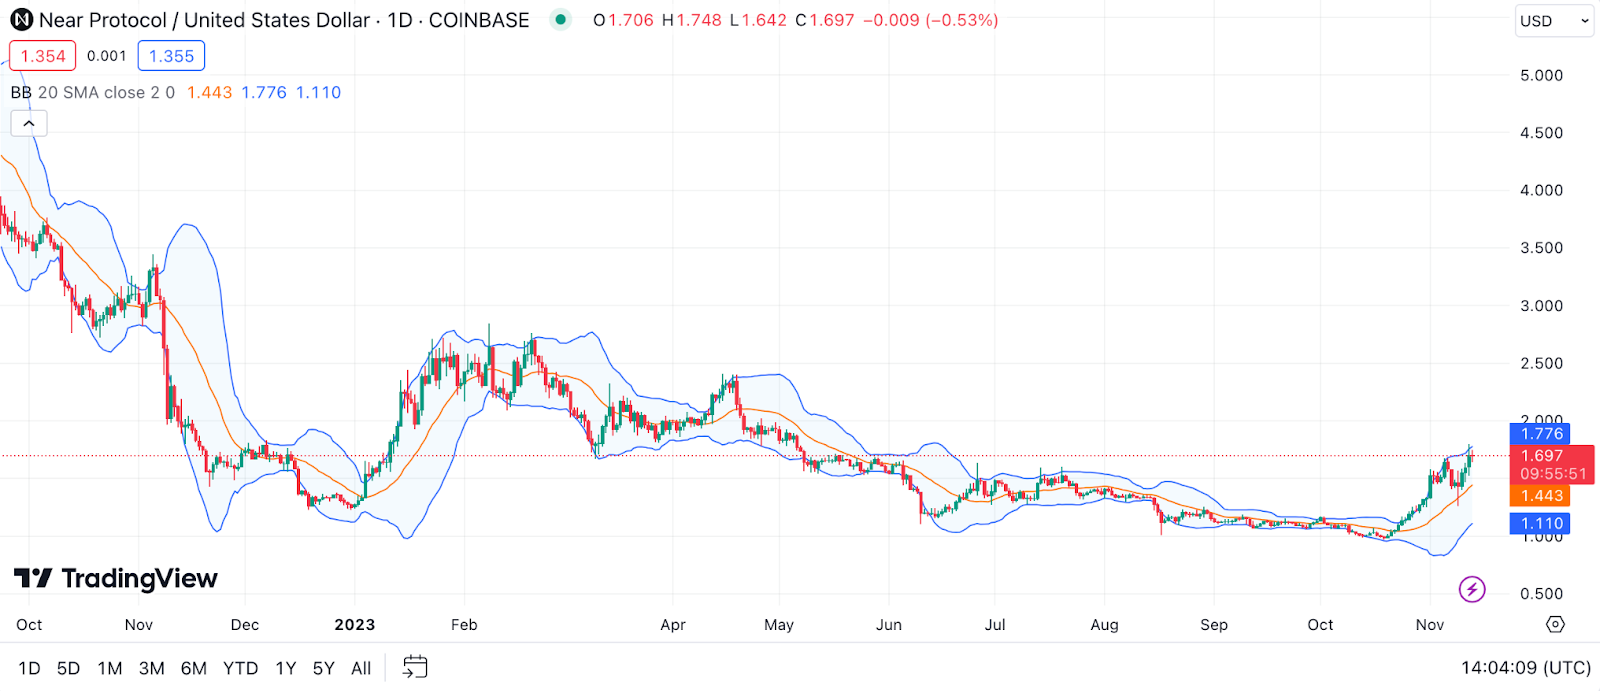
Example: If NEAR’s price touches or breaches the upper Bollinger Band, it might indicate the asset is overbought, suggesting a potential sell-off could be imminent. Conversely, if the price hits the lower band, it may be oversold, signaling a possible buying opportunity. Traders often use these points as signals to make strategic trading decisions for NEAR.
Stochastic Oscillator for NEAR Protocol Price Prediction
The Stochastic Oscillator is a momentum indicator comparing a particular closing price of a security to a range of its prices over a certain period. The sensitivity of the oscillator to market movements can be reduced by adjusting the time period or by taking a moving average of the result. It’s used to generate overbought and oversold trading signals, employing a 0-100 bounded range of values. For NEAR Protocol, this can indicate whether it’s currently under- or overvalued in the market.
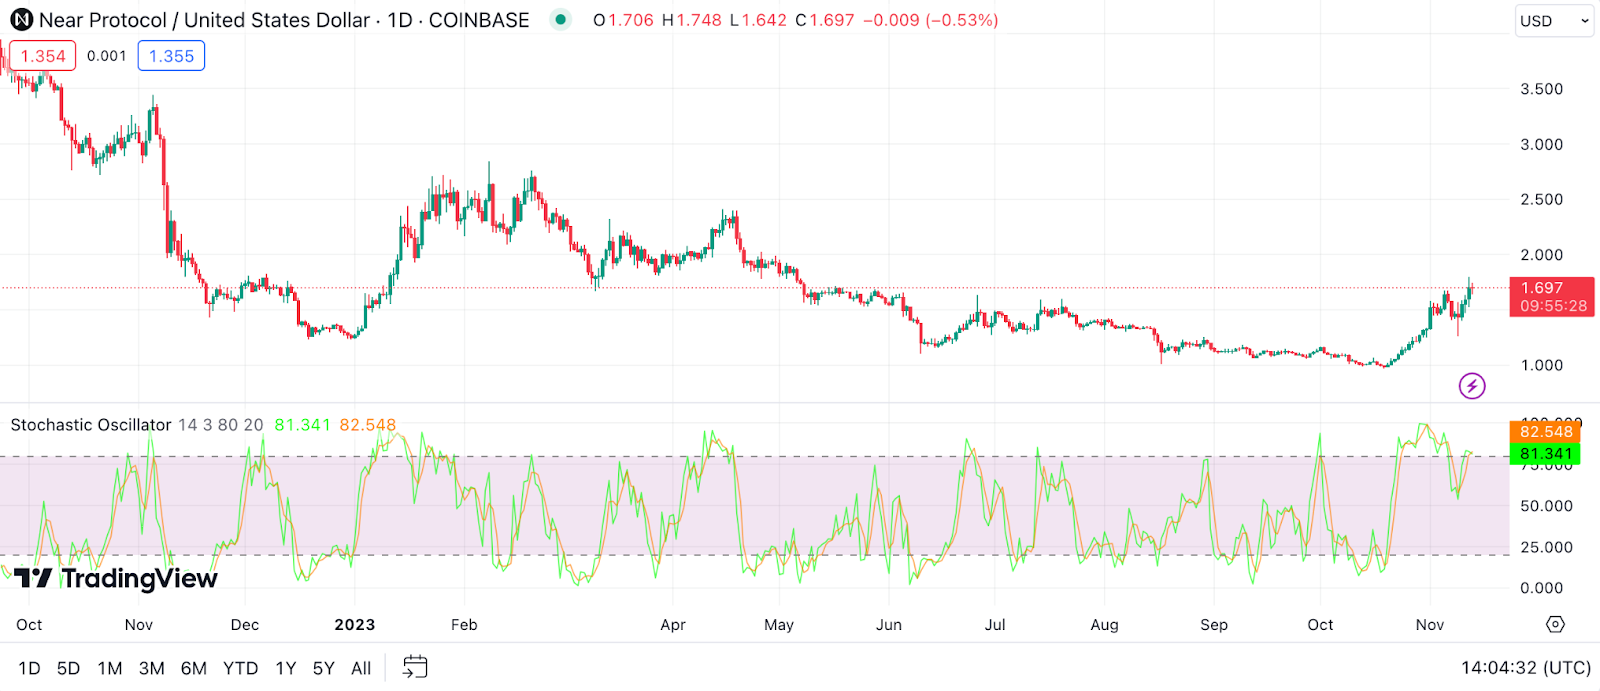
Example: If the Stochastic Oscillator for NEAR falls below 20, it suggests that the market might be oversold and that a reversal could be on the horizon. Conversely, a reading above 80 indicates the market might be overbought. Recognizing these levels can help traders decide the best moments to enter or exit their positions in NEAR.
Parabolic SAR (Stop and Reverse) for NEAR Protocol Price Prediction
The Parabolic SAR (Stop and Reverse) is used to find potential reversals in the market price direction of traded goods such as securities or currency exchanges like NEAR Protocol. This indicator is depicted as dots placed either above or below the price on a chart, providing clear entry and exit signals in a trending market. When the dots are below the candles, it indicates an uptrend, and when above, a downtrend.
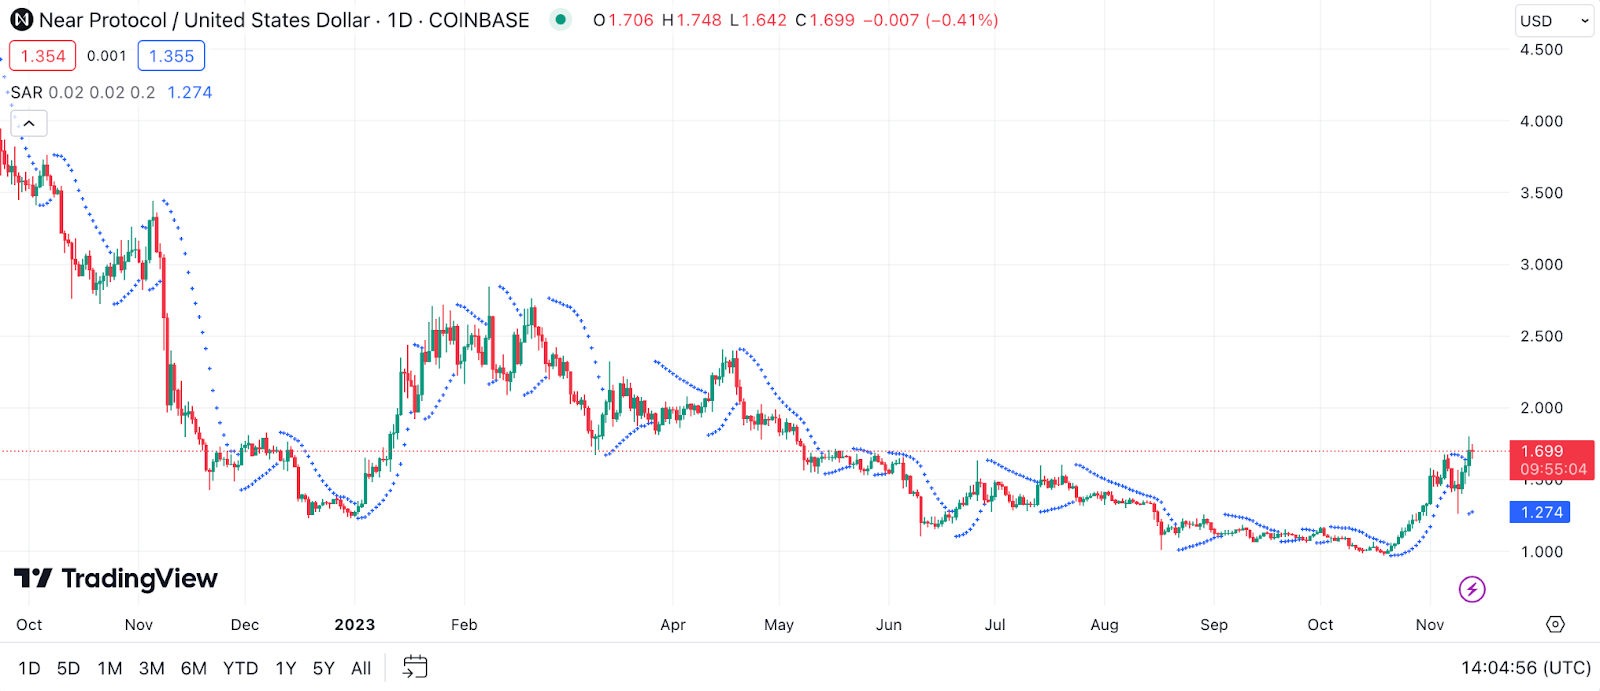
Example: If the Parabolic SAR dots flip below the price of NEAR Protocol, it suggests a bullish trend, signaling a potential buying opportunity. Conversely, if the dots flip above the price, it indicates a bearish trend, potentially signaling a sell. For NEAR traders, monitoring these flips can be critical in determining the momentum and direction of the trend, aiding in making timely and effective trading decisions.
Ichimoku Cloud for NEAR Protocol Price Prediction
The Ichimoku Cloud, also known as Ichimoku Kinko Hyo, is a comprehensive indicator that provides information about resistance, support, trend direction, and momentum. It consists of five lines, each giving a unique insight into the price action. For NEAR Protocol, the Ichimoku Cloud can be particularly useful in visualizing its trend strength and potential reversal points in a single glance.
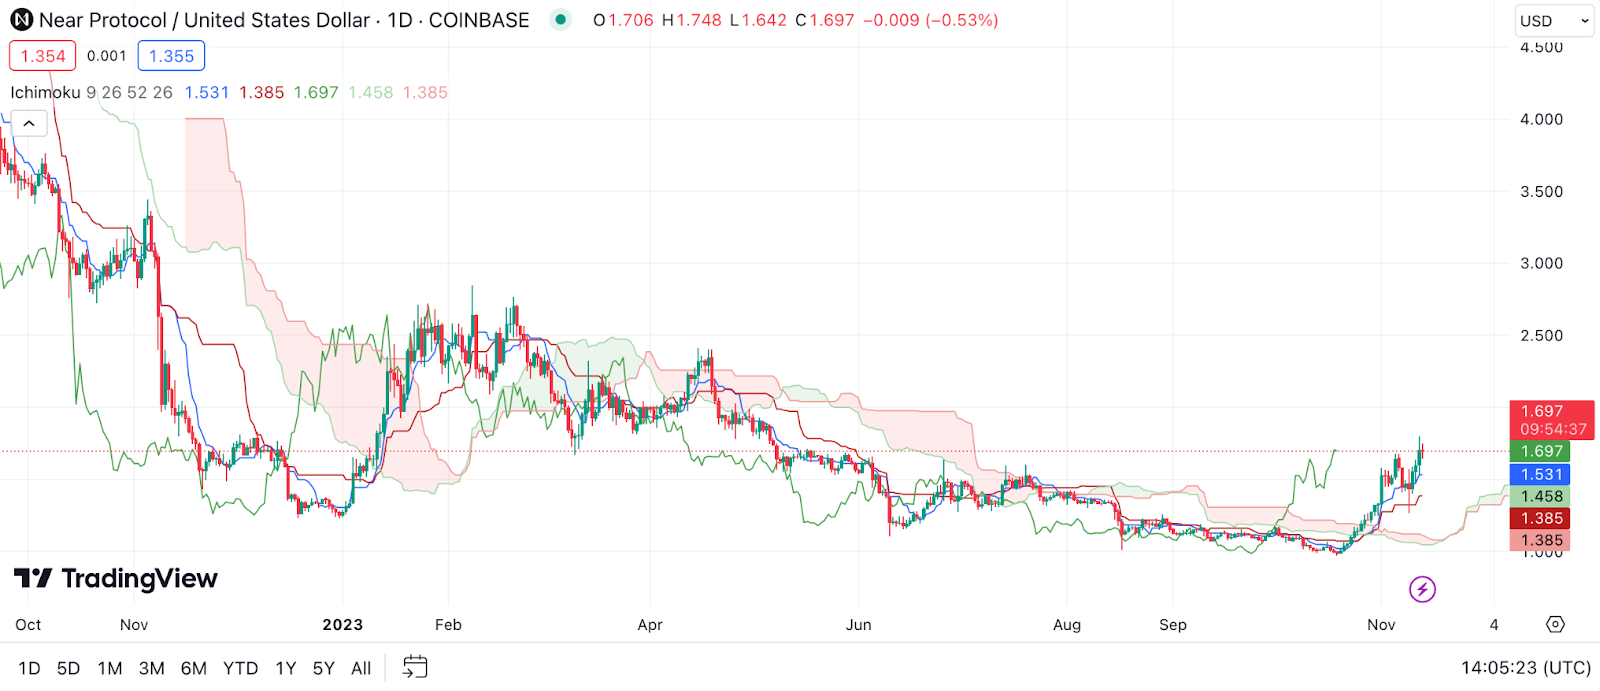
Example: When NEAR’s price is above the cloud, it generally indicates a bullish trend, suggesting a favorable time for buying. Conversely, if the price is below the cloud, it signifies a bearish trend, potentially signaling a selling point. The cloud’s color changes can also provide insight into market sentiment, guiding NEAR investors in their trading decisions.
Fibonacci Retracement for NEAR Protocol Price Prediction
Fibonacci Retracement is a popular tool among traders, based on the key numbers identified by mathematician Leonardo Fibonacci in the 13th century. It helps in identifying potential reversal levels. These retracements can be applied to any timeframe, providing insight into possible future support and resistance levels. For NEAR Protocol, Fibonacci Retracement levels can be crucial in identifying potential buying or selling zones during retracements in a trend.
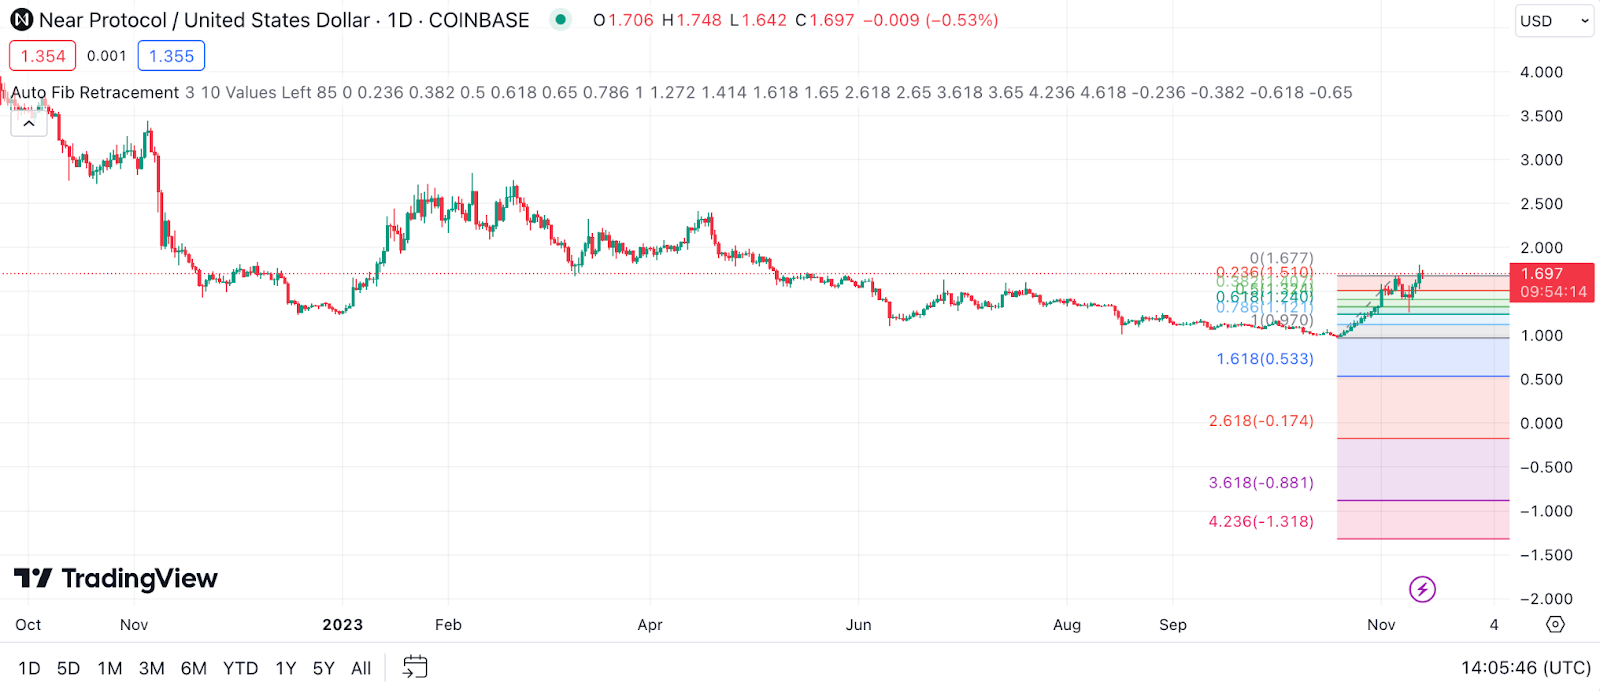
Example: When NEAR experiences a significant movement, traders can use Fibonacci levels to anticipate potential areas where the price might pause or reverse. If NEAR’s price retraces to a key Fibonacci level, like 61.8%, and then starts moving in the direction of the original trend, it might indicate a good entry point.
Average Directional Index (ADX) for NEAR Protocol Price Prediction
The Average Directional Index (ADX) is a technical analysis indicator used to quantify the strength of a trend. The ADX is non-directional, so it measures the strength of a trend regardless of whether it is up or down. Generally, an ADX value above 25 indicates a strong trend, while below 20 suggests a weak trend. For NEAR Protocol, ADX can be a valuable tool in determining the strength of its current price trend.
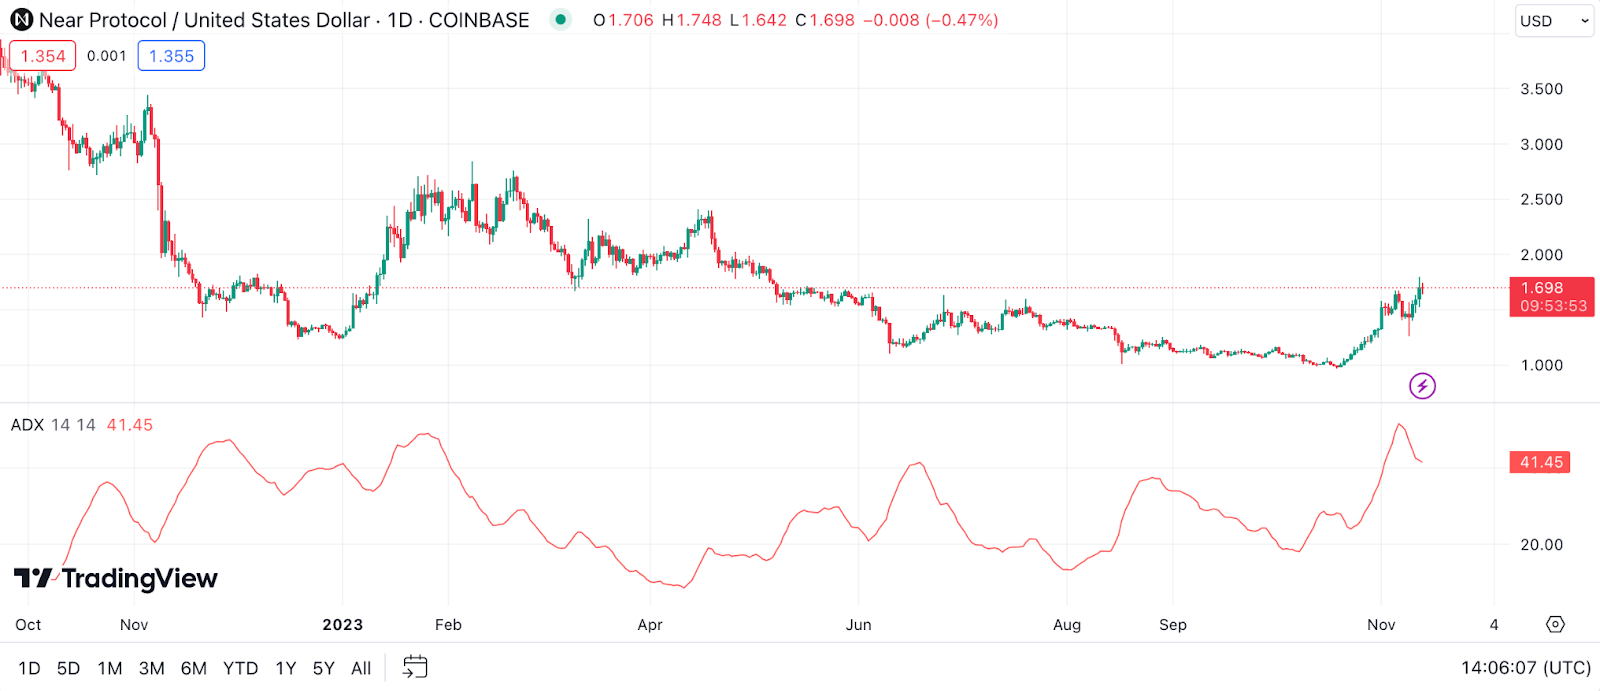
Example: If NEAR’s ADX value is rising above 25, it could signify that the current trend, whether bullish or bearish, is strong and likely to continue. Conversely, a falling ADX value could indicate a weakening trend, suggesting that the current direction of NEAR’s price may not be sustainable. Understanding the ADX values can help traders and investors gauge the robustness of NEAR’s price movements.
On Balance Volume (OBV) for NEAR Protocol Price Prediction
On Balance Volume (OBV) is a momentum indicator that uses volume flow to predict changes in stock price. The theory behind OBV is based on the distinction between smart money – presumably informed and professional traders – and less-sophisticated retail investors. For NEAR Protocol, OBV can be a key indicator in signaling whether large investors are accumulating or distributing the cryptocurrency.
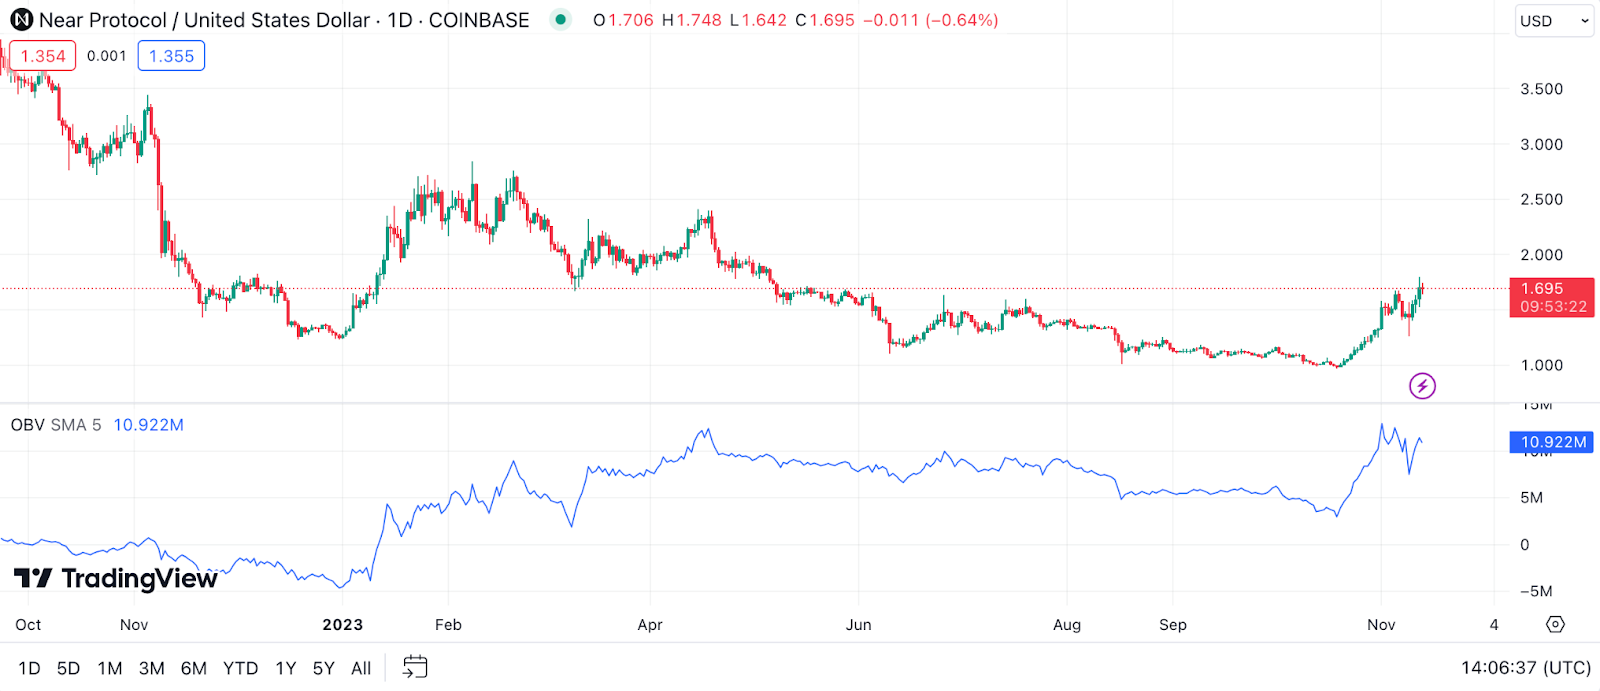
Example: If NEAR’s price is increasing and the OBV is also on a good upward trend, it suggests that new money is coming in, indicating bullish sentiment. Conversely, if the price is rising but OBV is trending downward, it could indicate potential price declines. Monitoring OBV helps in understanding the underlying strength or weakness of price movements in NEAR.
Rate of Change (ROC) for NEAR Protocol Price Prediction
The Rate of Change (ROC) is a momentum oscillator that measures the percentage change in price between the current price and the price a certain number of periods ago. The ROC indicator is versatile, used for identifying overbought or oversold conditions, divergences, and centerline crossovers. For NEAR Protocol, the ROC can be particularly useful in identifying momentum shifts in its price.
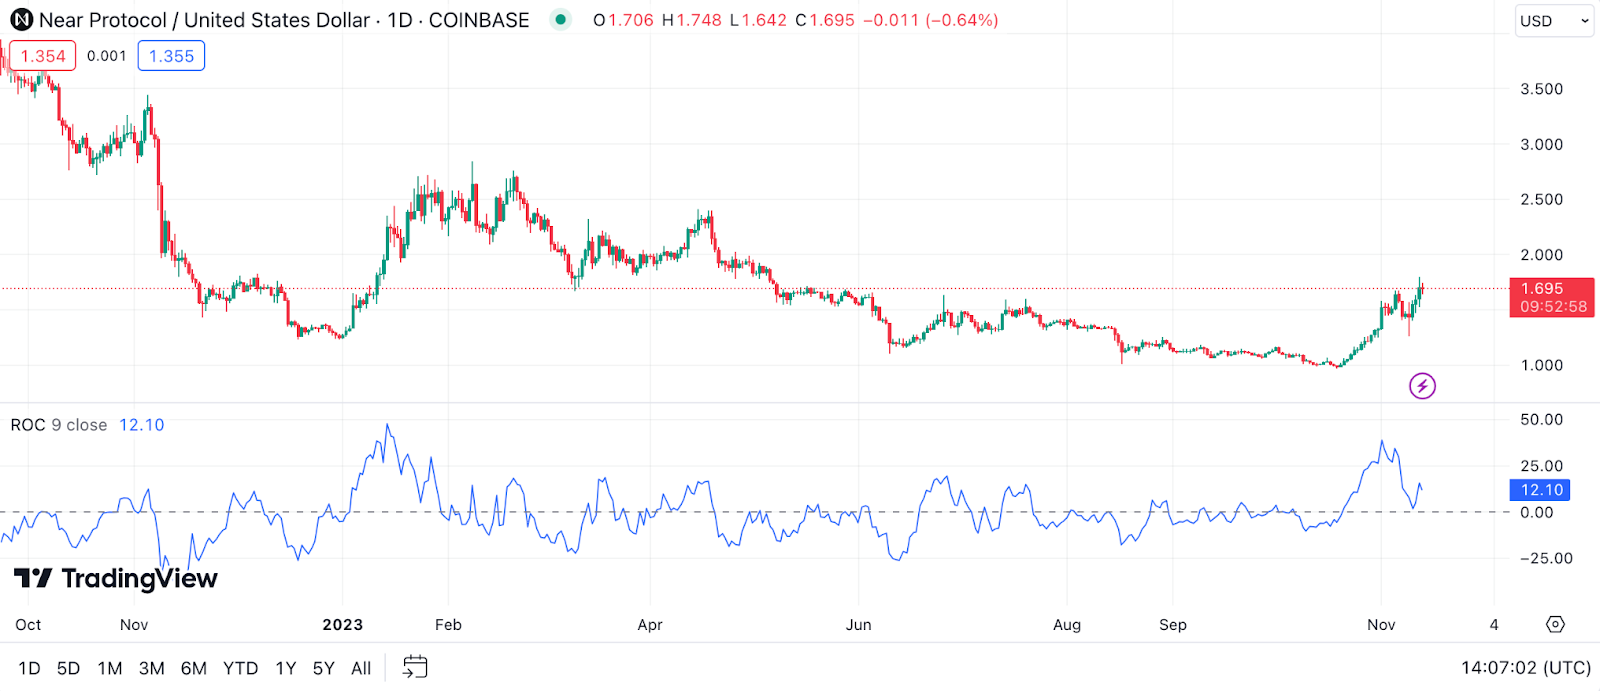
Example: A rising ROC above its centerline indicates an increase in upward momentum, which could suggest a buying opportunity for NEAR. Conversely, a falling ROC below the centerline could signal decreasing momentum and potentially a time to sell or short NEAR. The ROC helps in pinpointing the acceleration or deceleration of NEAR’s price trend.
Commodity Channel Index (CCI) for NEAR Protocol Price Prediction
The Commodity Channel Index (CCI) is an oscillator originally developed to identify cyclical turns in commodities, but it can be used for any type of asset, including cryptocurrencies like NEAR Protocol. The CCI compares the current price to an average price over a specific time period and can be used to identify new trends or warn of extreme conditions.
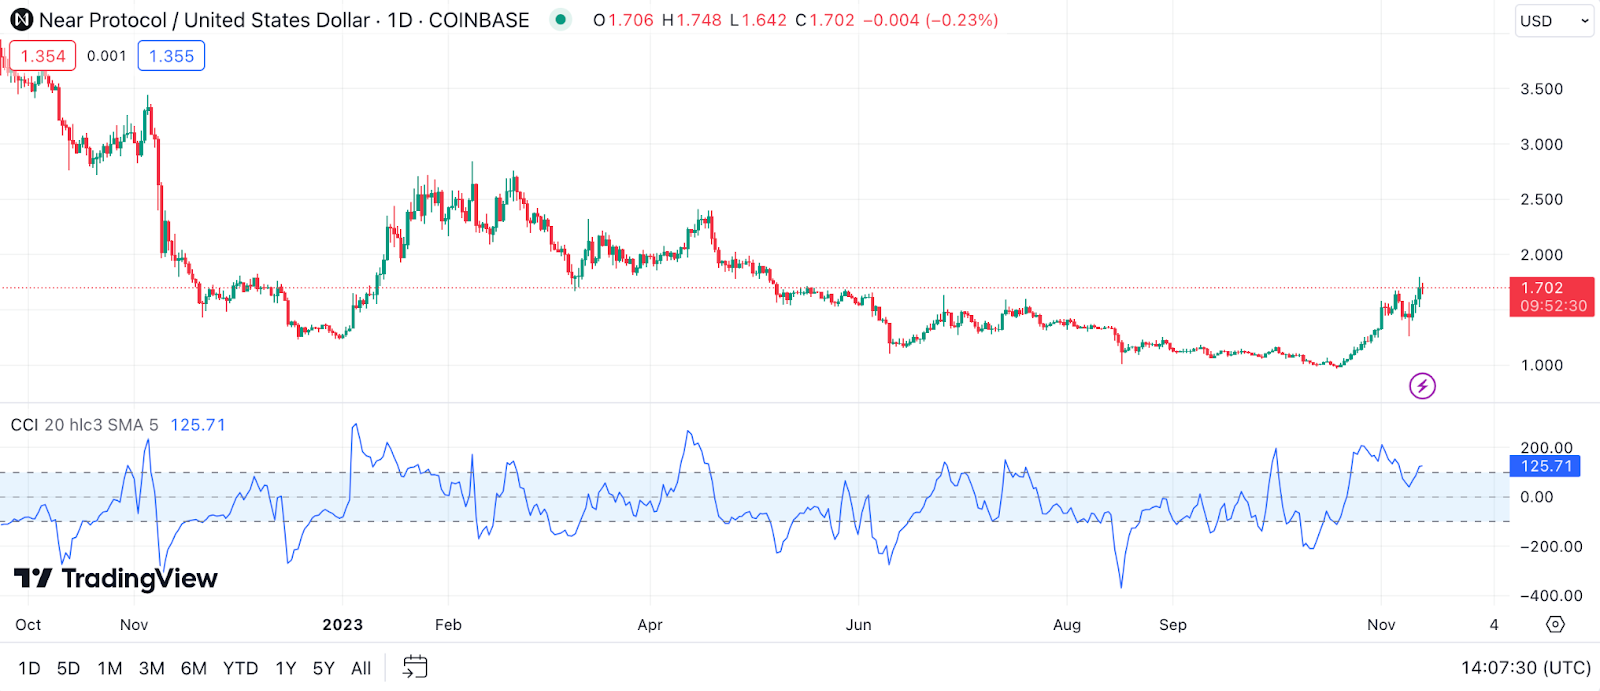
Example: When NEAR’s CCI moves above +100, it indicates that the price is well above the average, which could be a sign of strength and an impending bullish trend. However, if the CCI falls below -100, it signals that the price is well below the average, potentially indicating weakness or a bearish trend. This tool can help traders gauge when NEAR Protocol is reaching extreme conditions, either overbought or oversold.
Accumulation/Distribution Line (A/D Line) for NEAR Protocol Price Prediction
The Accumulation/Distribution Line (A/D Line) is a volume-based indicator designed to measure the cumulative flow of money into and out of an asset, like NEAR Protocol. It does this by considering both the volume and price movement, offering insights into whether NEAR is being accumulated (bought) or distributed (sold).
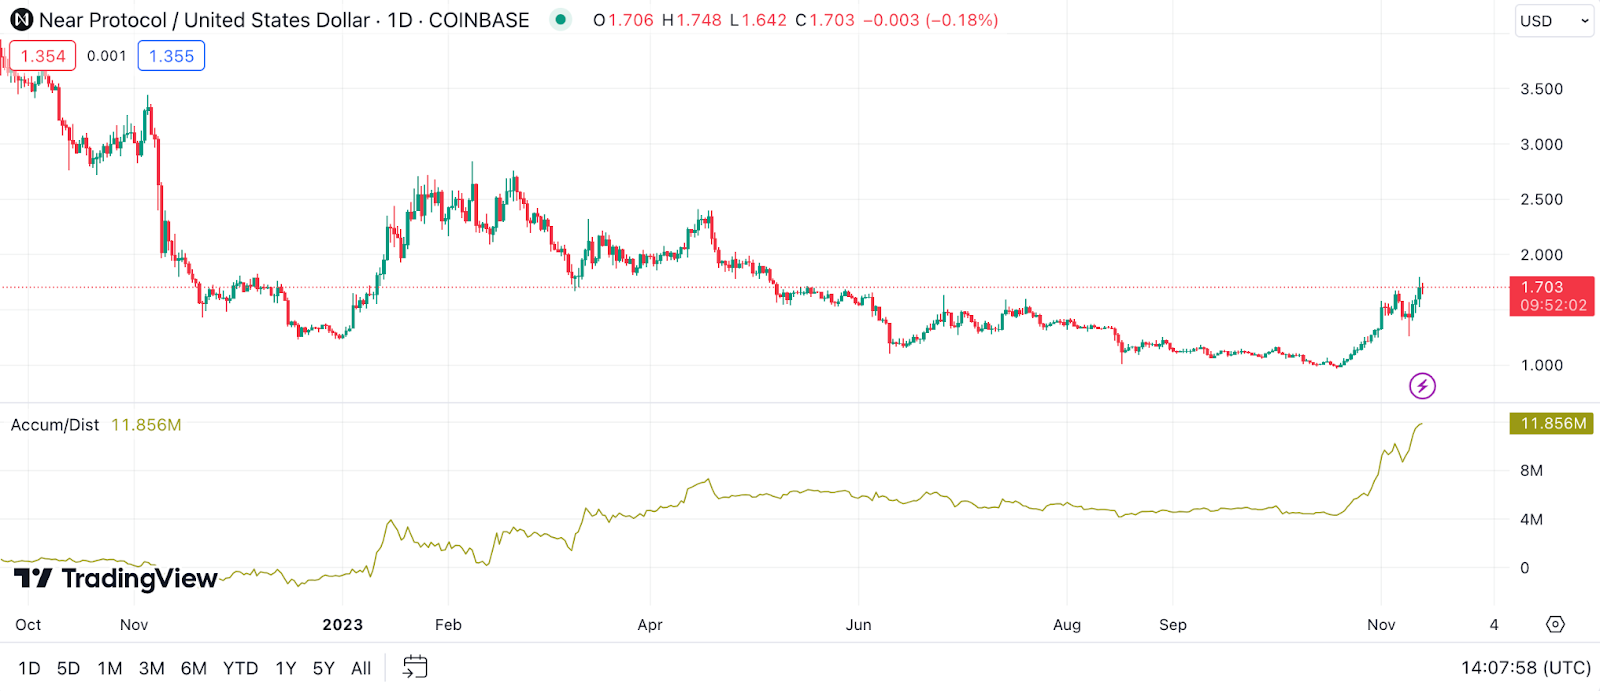
Example: If NEAR’s A/D Line is trending upwards while its price is also increasing, it suggests accumulation and could indicate a strong bullish trend. Conversely, if the A/D Line is declining during a price uptick, it might imply distribution, signaling a potential future downturn in NEAR’s price. This indicator helps in identifying whether the movements in NEAR’s price are backed by volume, providing a more comprehensive picture of market sentiment.
Pivot Points for NEAR Protocol Price Prediction
Pivot Points are a technical analysis tool used to determine potential support and resistance levels. They are calculated using the high, low, and closing prices of the previous trading session and are used by traders to predict the future movement of an asset like NEAR Protocol. Pivot Points can indicate the overall market trend and potential reversal points.
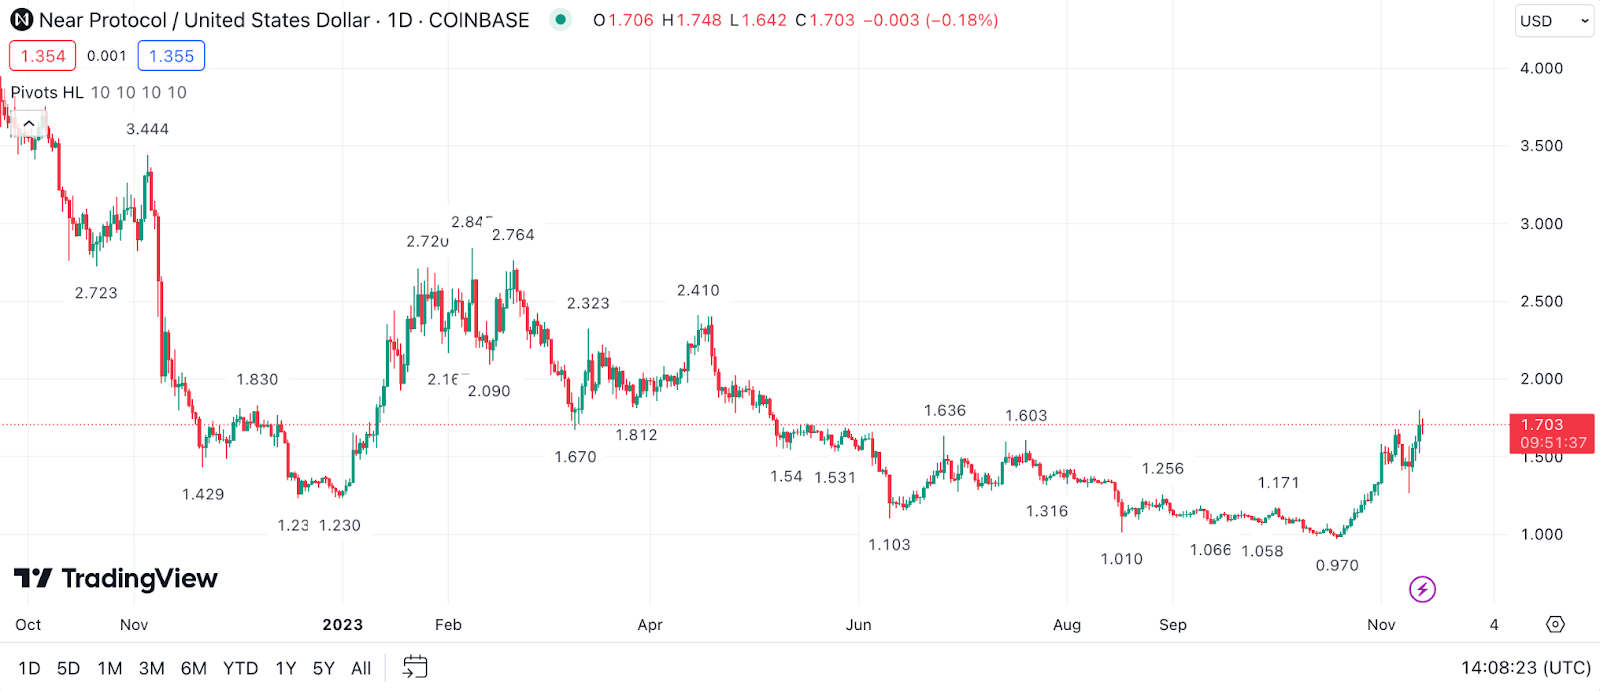
Example: If NEAR’s price is trading above the pivot point, it is often considered bullish and may continue to rise towards the resistance levels. Conversely, trading below the pivot point could suggest bearishness, with potential declines towards support levels. By understanding where these pivot points lie, traders can strategize their entries and exits in the NEAR market more effectively.
Chaikin Money Flow (CMF) for NEAR Protocol Price Prediction
The Chaikin Money Flow (CMF) indicator measures the amount of Money Flow Volume over a specific period. It combines both price and volume to gauge the buying and selling pressure for an asset like NEAR Protocol. A positive CMF value suggests bullish pressure (buying), while a negative CMF indicates bearish pressure (selling).
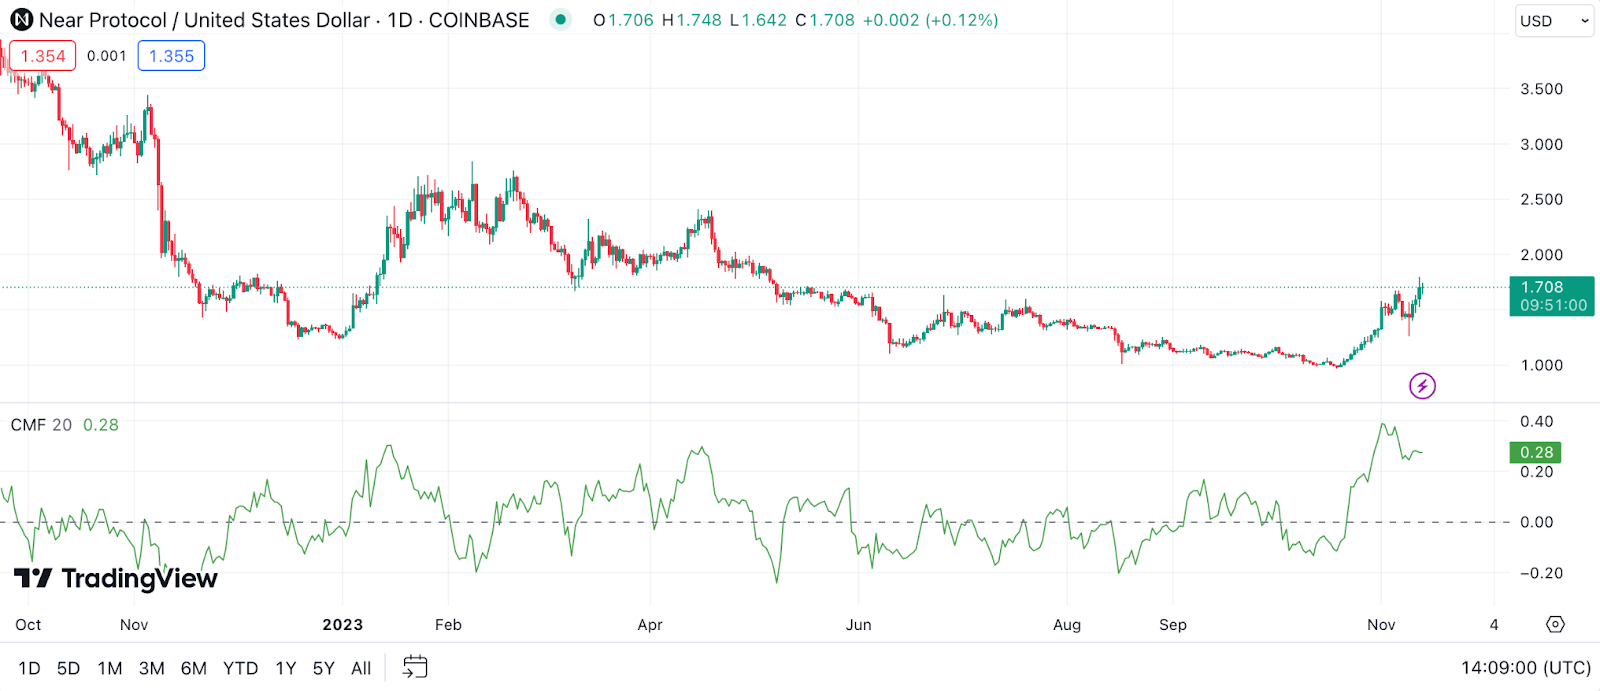
Example: A rising CMF value in conjunction with NEAR’s increasing price could suggest strong buying pressure and a potential continuation of the uptrend. On the other hand, if NEAR’s price is increasing but the CMF is declining, it could be a warning sign of weakening momentum and a possible trend reversal. Traders can use the CMF to assess the strength behind NEAR’s price movements and make more informed trading decisions.
Aroon Indicator for NEAR Protocol Price Prediction
The Aroon Indicator is a technical tool used to identify trend changes in the price of an asset, such as NEAR Protocol, and to ascertain the strength of the trend. It consists of two lines: the Aroon Up and the Aroon Down. These lines measure the time it takes for the price to reach the highest and lowest points over a given period, typically 25 days.
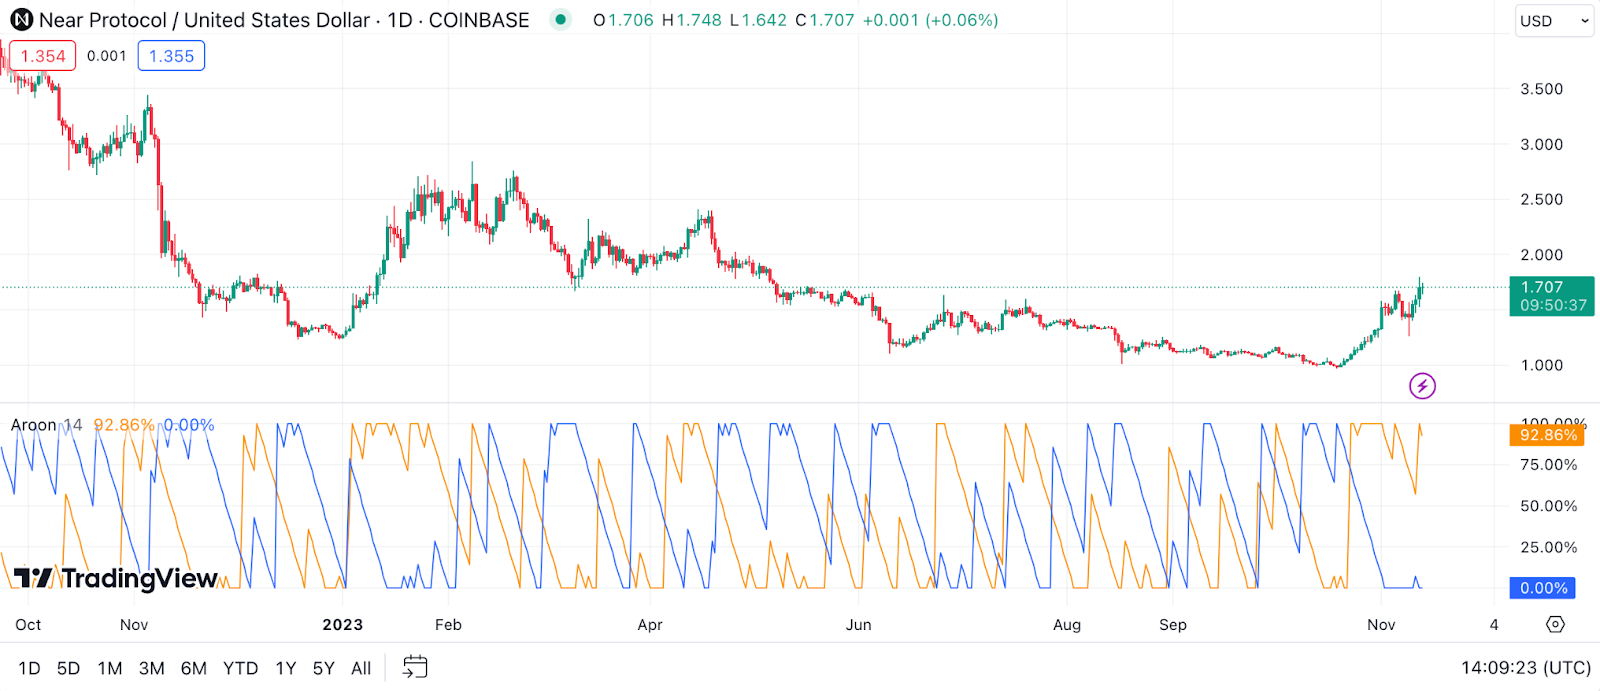
Example: If the Aroon Up crosses above the Aroon Down, it suggests that NEAR is entering a bullish phase. Conversely, if the Aroon Down crosses above the Aroon Up, it indicates a potential bearish trend. This tool can be particularly useful for NEAR traders in determining when a new trend is starting and its potential strength.
Gann Fan for NEAR Protocol Price Prediction
The Gann Fan, named after its creator W.D. Gann, is an analytical tool used for identifying key support and resistance levels. It consists of lines radiating from a single point at various angles, representing potential paths of price movement. For NEAR Protocol, the Gann Fan can help in predicting future price movements by indicating these critical levels.
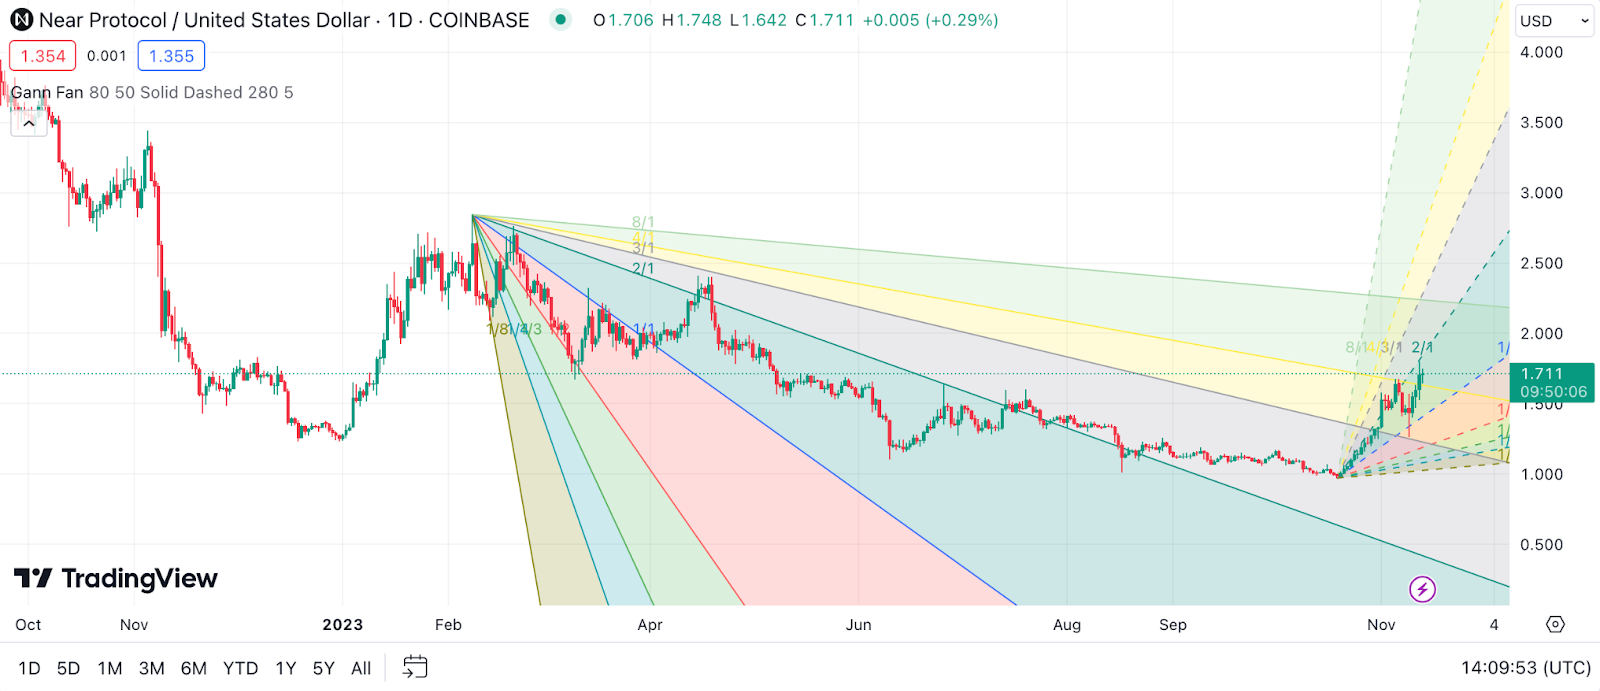
Example: If NEAR’s price follows a line within the Gann Fan, it can act as a support or resistance level. A break above a Gann line may signal bullish momentum, suggesting a potential buying opportunity. On the other hand, if NEAR’s price breaks below a Gann line, it might indicate bearish momentum and a selling point. The Gann Fan helps traders visualize possible future movements in NEAR’s price and plan their trades accordingly.
Keltner Channel for NEAR Protocol Price Prediction
The Keltner Channel is a volatility-based technical indicator that combines aspects of a moving average and the Average True Range (ATR). It consists of three lines: a middle line which is the EMA (Exponential Moving Average), and two outer bands derived from the ATR. The Keltner Channel can provide insights into potential trend reversals and breakouts for NEAR Protocol.
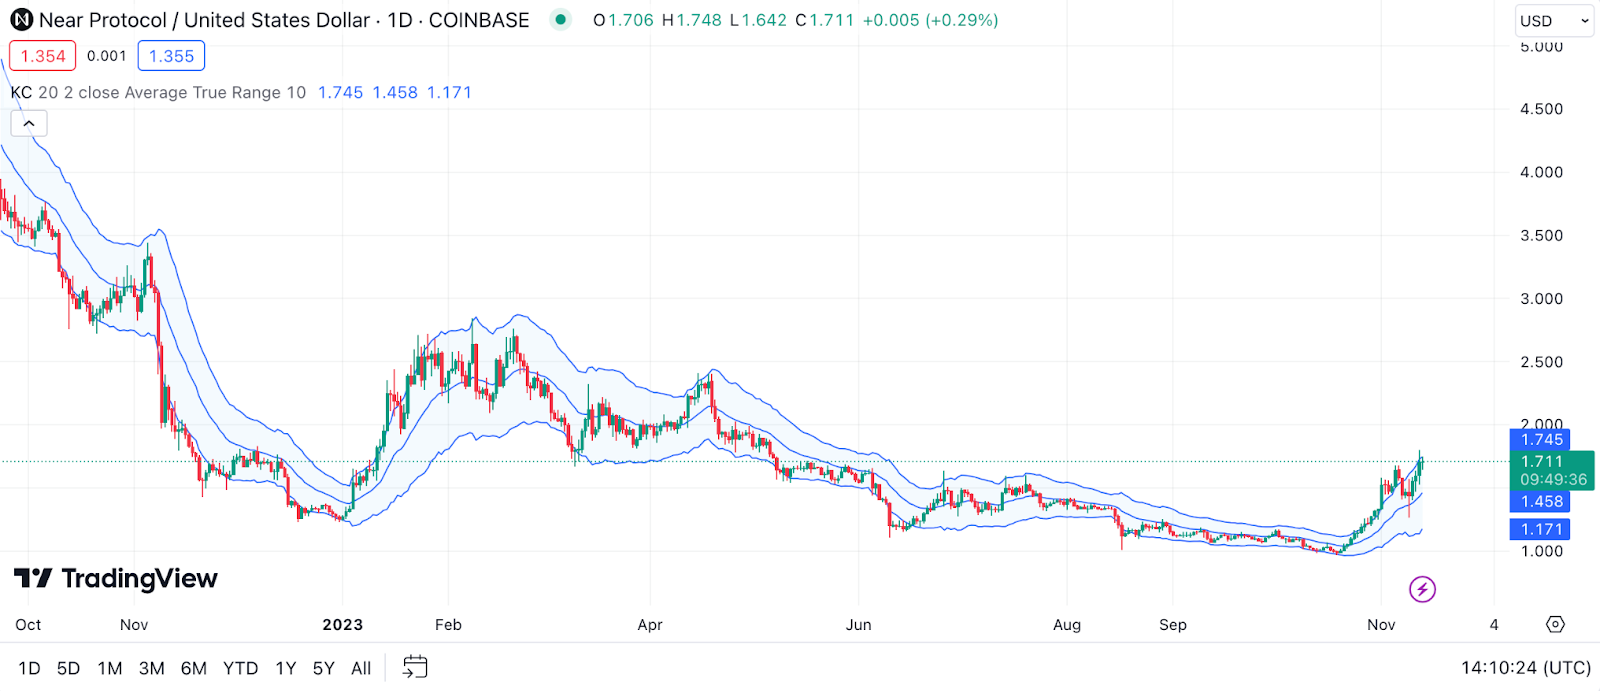
Example: If NEAR’s price moves above the upper band of the Keltner Channel, it might be considered overbought, indicating a possible price pullback. Conversely, a move below the lower band could suggest that NEAR is oversold, signaling a potential price rebound. By monitoring NEAR’s position relative to these bands, traders can gain insights into potential entry and exit points, as well as the asset’s volatility.
Money Flow Index (MFI) for NEAR Protocol Price Prediction
The Money Flow Index (MFI) is an oscillator that uses both price and volume to measure buying and selling pressure for an asset like NEAR Protocol. Often referred to as the volume-weighted RSI, the MFI ranges from 0 to 100 and helps identify overbought or oversold conditions.
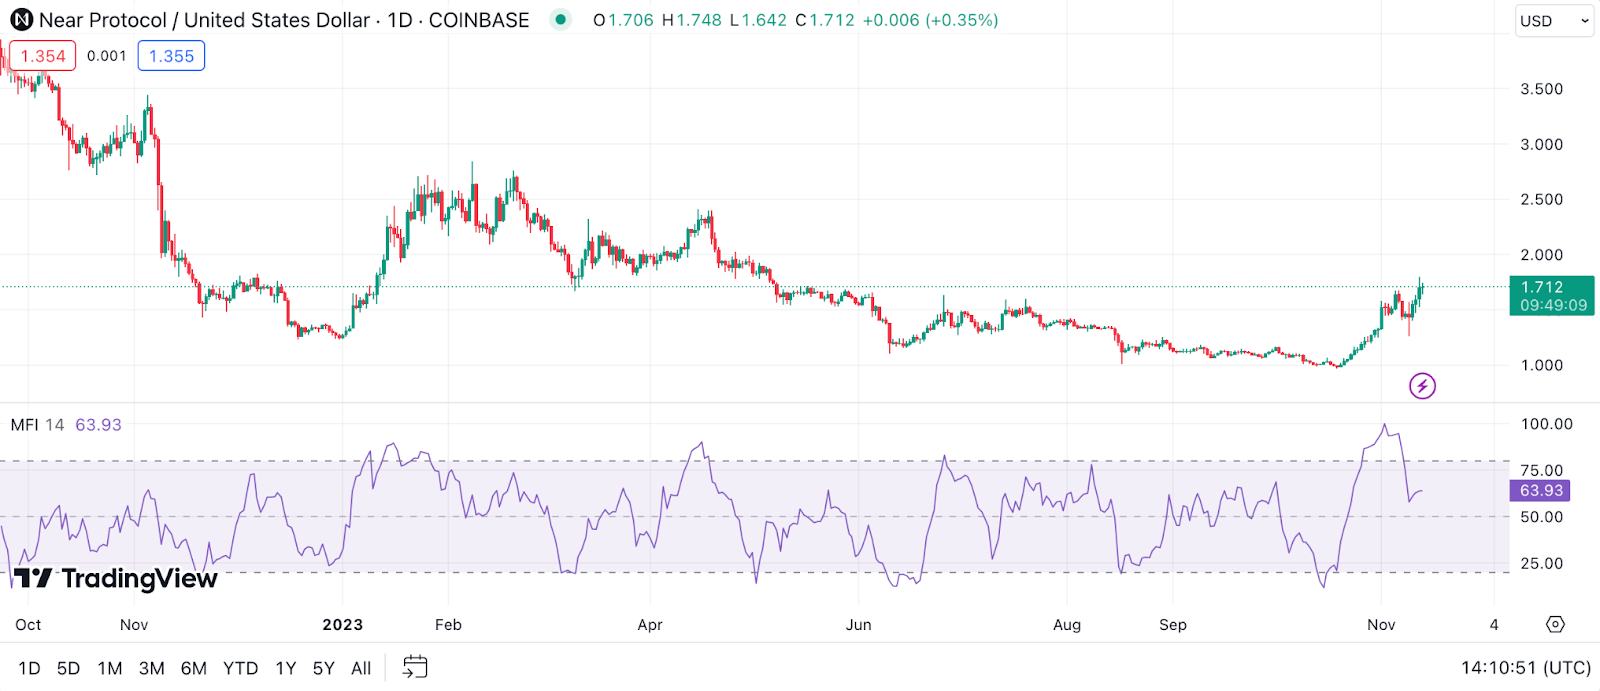
Example: A MFI value above 80 typically suggests that NEAR is overbought and might undergo a price correction. Conversely, a value below 20 indicates oversold conditions, possibly leading to a price rebound. This tool is especially useful in confirming trend reversals for NEAR, providing additional depth to NEAR Protocol price analysis through its incorporation of volume data.
TRIX for NEAR Protocol Price Prediction
TRIX is a momentum oscillator that filters out insignificant price movements, focusing on the underlying trend of NEAR Protocol. It shows the rate of change in a triple exponentially smoothed moving average of the security’s closing price. TRIX is primarily used for identifying overbought and oversold conditions, as well as potential bearish and bullish signals.
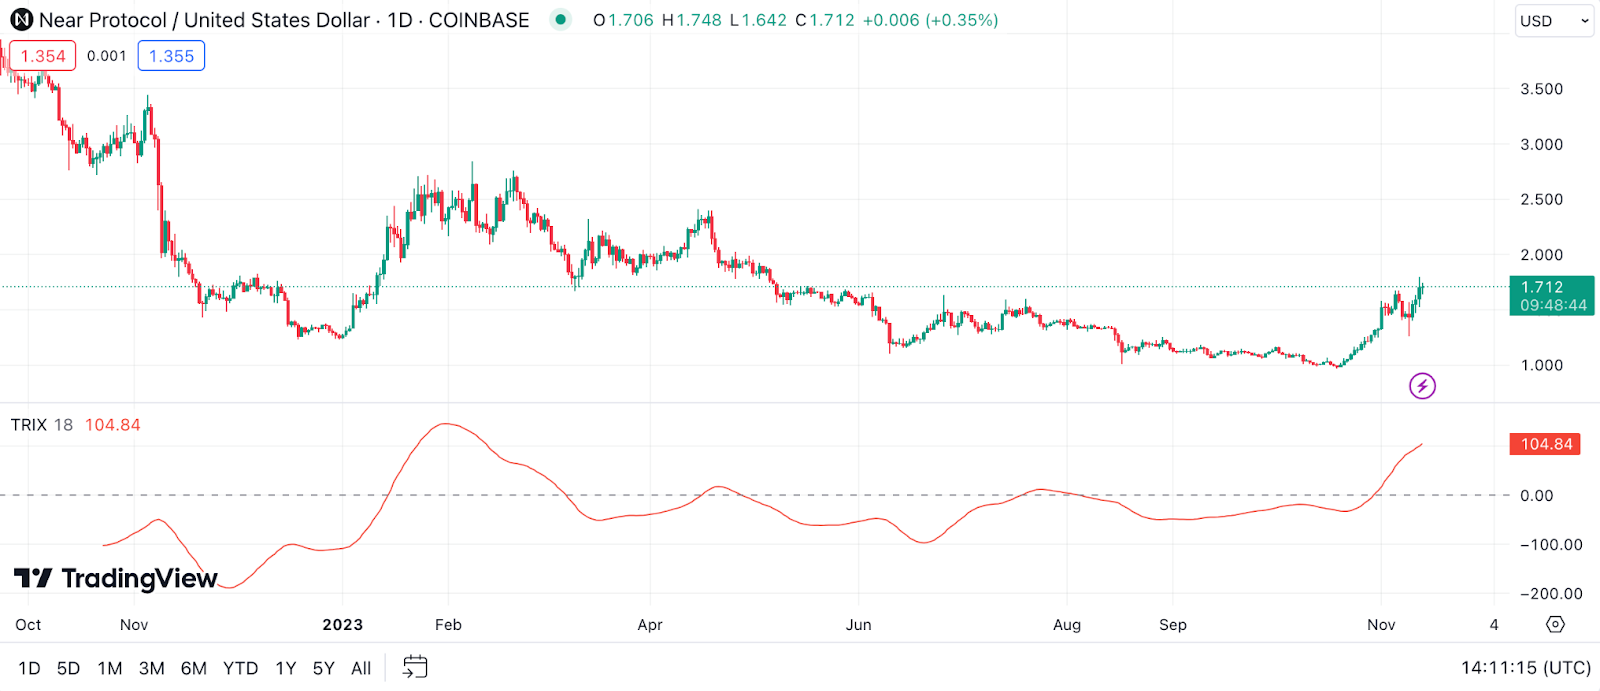
Example: A positive TRIX value that’s increasing suggests a bullish trend, potentially indicating a buying opportunity for NEAR. Conversely, a negative and decreasing TRIX value might signify a bearish trend, hinting at a selling opportunity. When the TRIX line crosses its signal line, it can signal a potential entry or exit point in NEAR’s market.
The Zig Zag Indicator for NEAR Protocol Price Prediction
The Zig Zag indicator is used to identify price trends and changes in the price trends of assets like NEAR Protocol. By filtering out minor price fluctuations and focusing on significant changes, it helps in identifying potential support and resistance levels, as well as classic chart patterns.
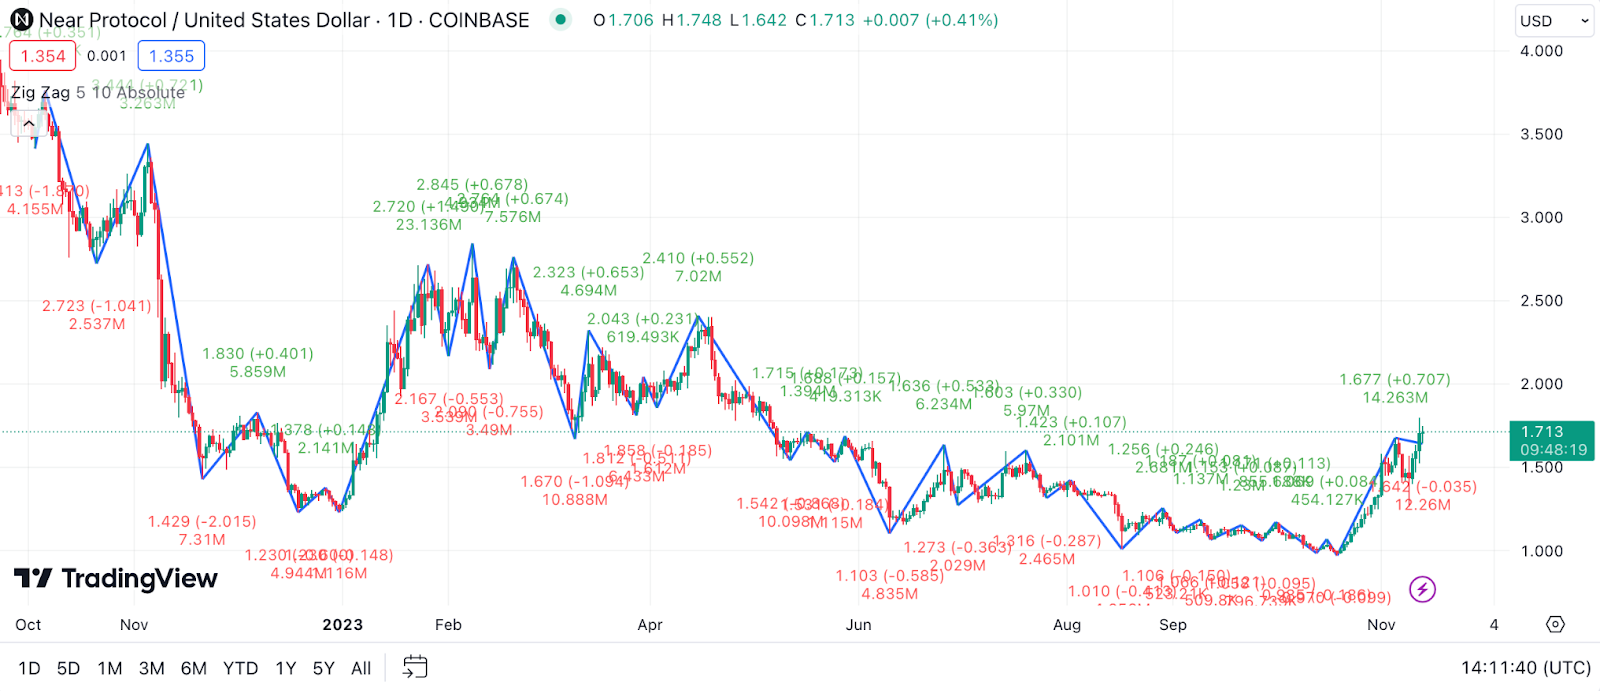
Example: The Zig Zag indicator can highlight significant price movements in NEAR’s market, making it easier to spot trends and reversals. For instance, if the Zig Zag lines move upward and then start to flatten or reverse, it might indicate a potential price peak and a bearish reversal. Similarly, a downward Zig Zag followed by a change in direction could signal a price bottom and a bullish reversal.
Detrended Price Oscillator (DPO) for NEAR Protocol Price Prediction
The Detrended Price Oscillator (DPO) is a unique tool that removes the longer-term trends from the price data, allowing traders to focus on the shorter-term cycles and fluctuations in NEAR Protocol’s price. It’s particularly useful for identifying the peak and trough of the price cycle by isolating short-term movements.
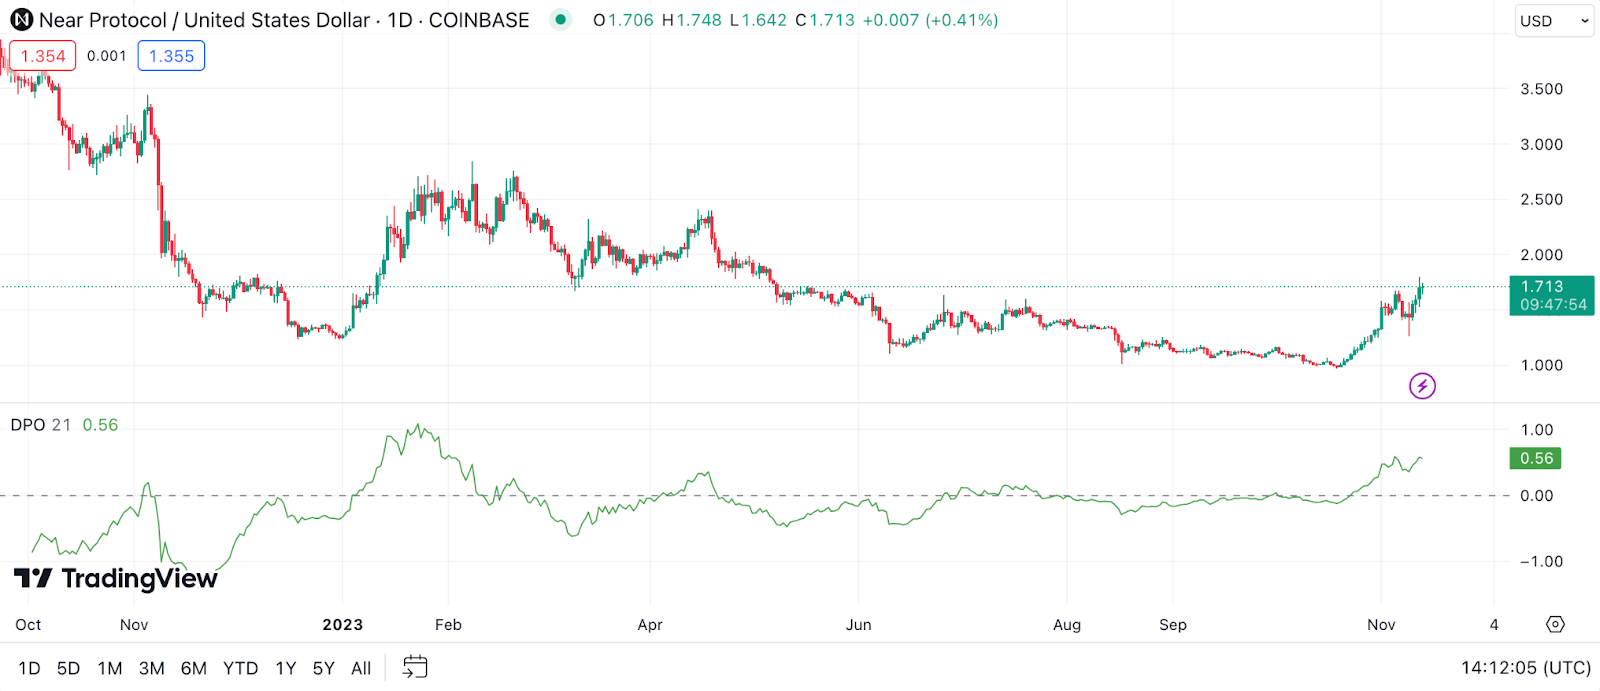
Example: If NEAR’s DPO shows a peak, it might indicate that the short-term price is at a high point relative to the longer-term trend, suggesting a potential selling opportunity. Conversely, a trough in the DPO could signal a low point in the short-term price cycle, indicating a buying opportunity.
Vortex Indicator (VI) for NEAR Protocol Price Prediction
The Vortex Indicator (VI) is designed to identify the start of a new trend or the continuation of an existing trend within NEAR Protocol’s market. It consists of two oscillating lines, VI+ and VI-, which capture positive and negative trend movements. The crossover of these lines can indicate trend changes.
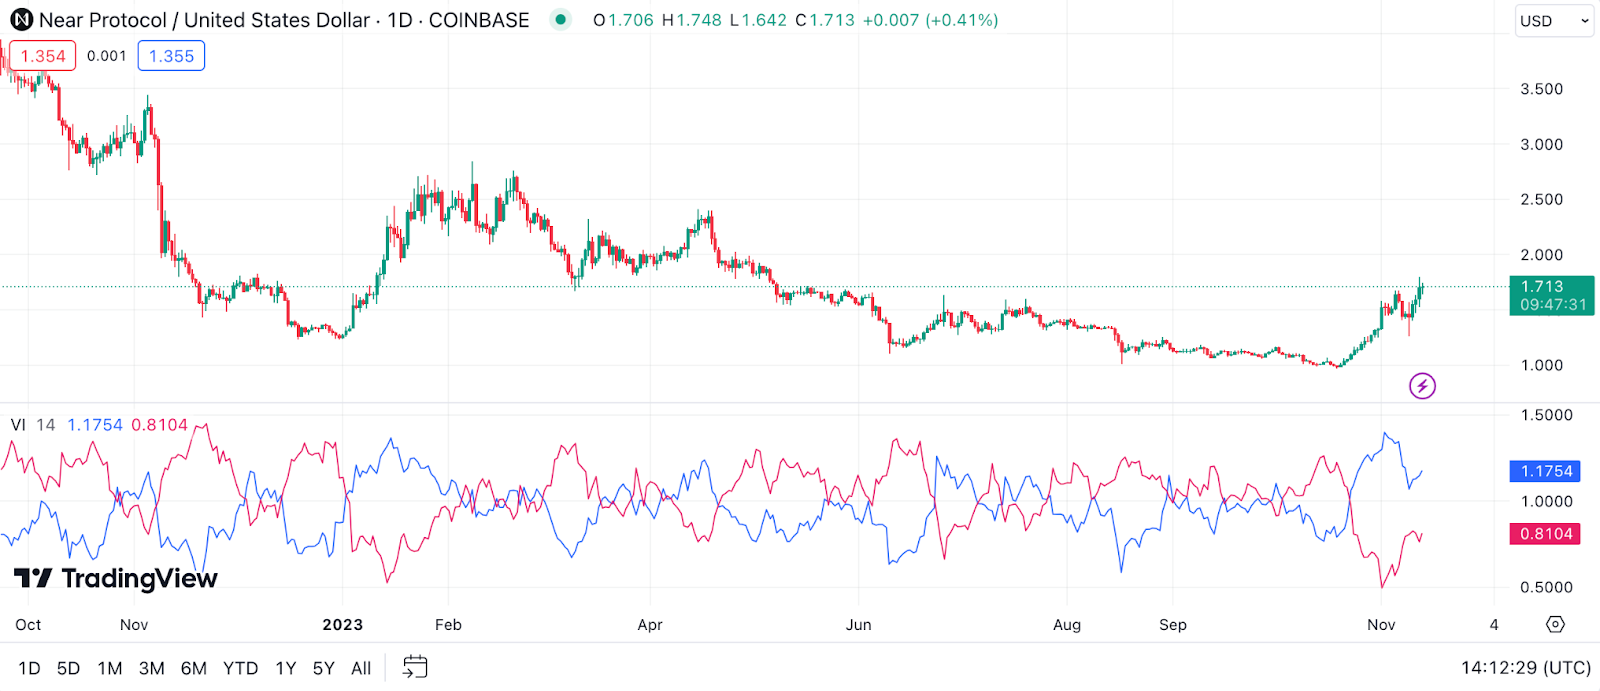
Example: A crossover of the VI+ line above the VI- line could be a signal of a bullish trend, potentially suggesting a good time to buy NEAR. On the flip side, if the VI- crosses above the VI+, it may indicate a bearish trend, signaling a potential selling point. The Vortex Indicator helps in catching the beginning of new trends and the continuation of existing ones in NEAR’s market.
Elder’s Force Index (EFI) for NEAR Protocol Price Prediction
Elder’s Force Index (EFI) is an oscillator that combines price and volume to measure the ‘force’ behind NEAR Protocol’s price movements. This indicator helps in identifying the potential strength of bullish and bearish trends, as well as points of trend reversal.
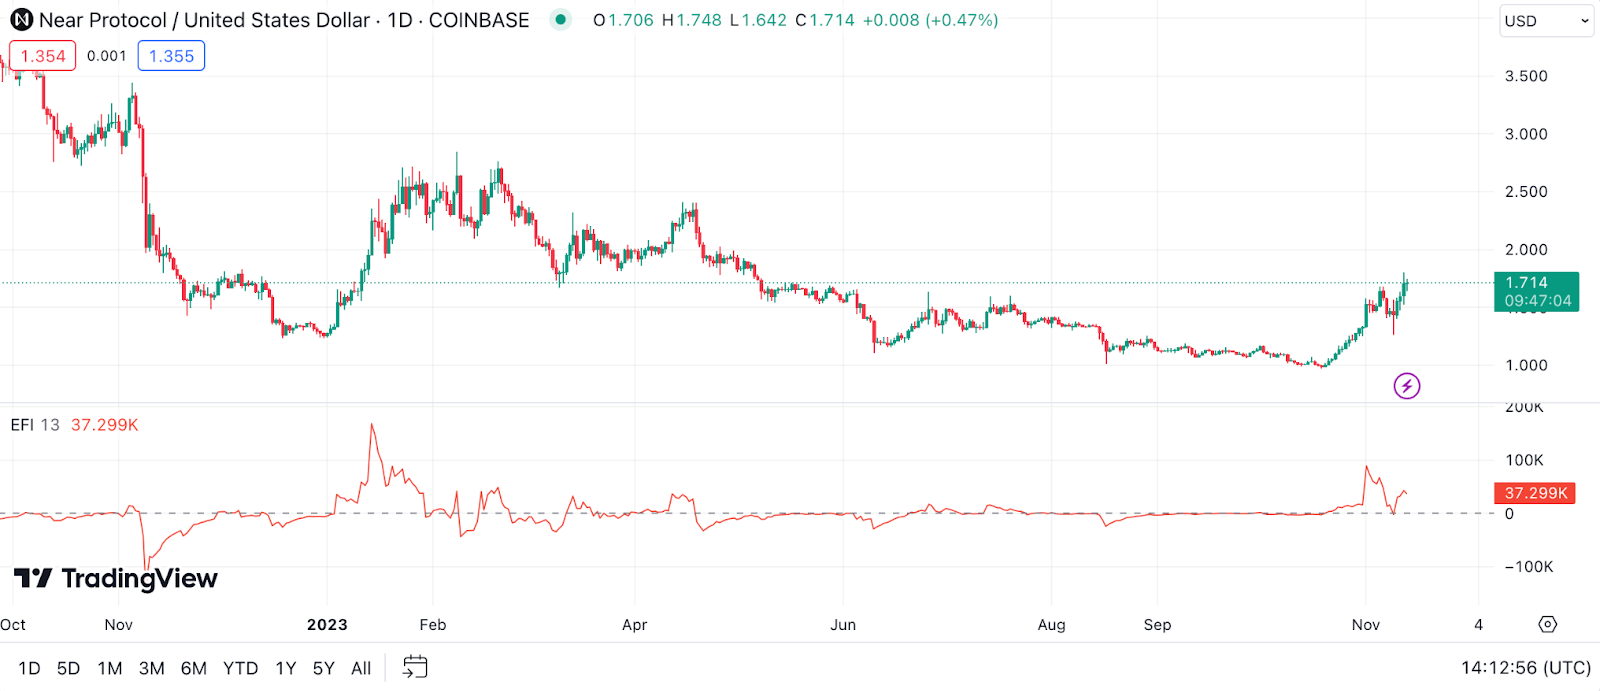
Example: A high positive value on the EFI suggests strong buying pressure, indicating a strong bullish trend for NEAR. Conversely, a high negative value signals strong selling pressure and a strong bearish trend. If the EFI crosses above or below its zero line, it can signal a potential change in trend direction.
Williams %R for NEAR Protocol Price Prediction
The Williams %R, also known as Williams Percent Range, is a momentum indicator that identifies overbought or oversold conditions in the price of an asset like NEAR Protocol. It’s a fast-moving oscillator that moves between 0 and -100, providing insights into the market momentum and potential reversal points.
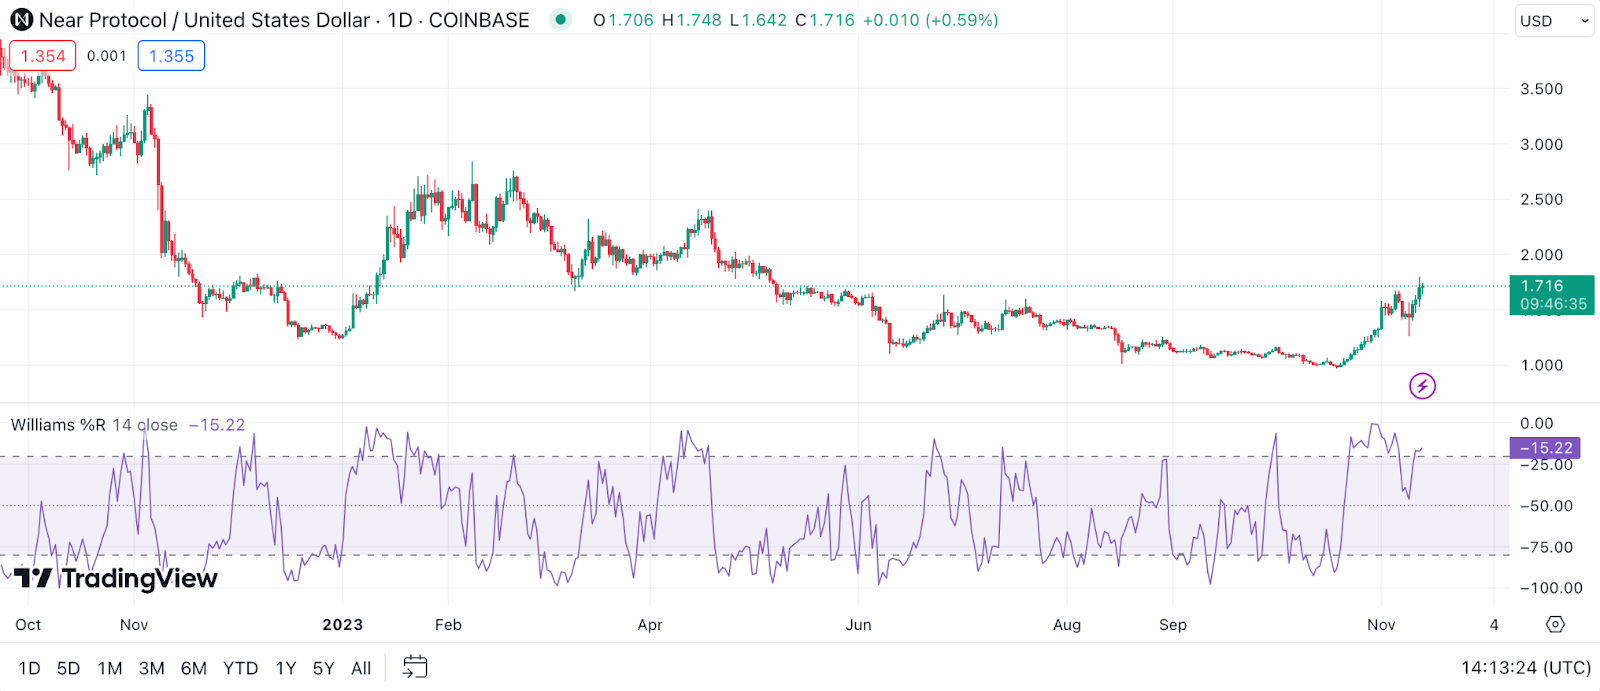
Example: A reading above -20 typically suggests that NEAR is overbought, which could indicate a potential price reversal or pullback. Conversely, a reading below -80 implies that NEAR might be oversold, signaling a possible upward price movement. By identifying these extreme conditions, the Williams %R can help token holders anticipate trend reversals in NEAR’s market, offering opportunities for strategic entry and exit points.
Combining Technical Indicators for Accurate NEAR Protocol Price Prediction
Navigating the volatile waters of cryptocurrency can be daunting, especially when it comes to making predictions about something as dynamic as NEAR Protocol. In my journey, I’ve learned that relying on a single indicator is like trying to understand a story by reading only one page. This is where the art of combining technical indicators comes into play, providing a more holistic view of the market.
The Importance of Using Multiple Technical Indicators
Diving into the world of NEAR Protocol price prediction, one quickly realizes that no single indicator tells the whole story. Each has its strengths and limitations. Think of it like gathering a team of experts, where each member brings unique insights to the table. Combining these indicators helps in validating the signals, reducing the likelihood of false predictions, and increasing the confidence in your trading decisions.
How to Combine Various Indicators for a Comprehensive Analysis
When it comes to blending various technical indicators, it’s all about finding the right balance. Here are some tips to consider for a comprehensive analysis of NEAR’s price:
- Look for Confluence: Aim for scenarios where multiple indicators provide the same signal. For instance, if the RSI indicates an overbought condition and the MACD shows a bearish crossover, it strengthens the case for a potential downward trend in NEAR’s price.
- Combine Different Types: Use a mix of trend, momentum, volume, and volatility indicators. This approach allows for cross-verification of signals, giving a more rounded market perspective.
- Understand the Context: Always consider the market context. An indicator might behave differently under various market conditions. It’s essential to understand how indicators react during high volatility versus a trending market.
- Use Leading and Lagging Indicators Together: Pairing leading indicators (like the Stochastic Oscillator) with lagging indicators (like Moving Averages) can provide both early signals and confirmations.
- Don’t Overcrowd Your Chart: While combining indicators is beneficial, too many can lead to confusion and analysis paralysis. Stick to a few that you understand well and that complement each other.
- Backtest Your Strategy: Before applying a new combination of indicators in real trading, backtest it to see how it would have performed in past market conditions.
Remember, the goal is not to find a perfect system but to develop a more reliable and robust approach to predicting NEAR’s price movements. Combining indicators is more of an art than a science, one that requires practice, patience, and continuous learning.
The Pillars of NEAR Protocol Prediction: Fundamental Factors
When analyzing NEAR Protocol, it’s not just the technical charts that tell the story. The fundamentals are equally, if not more, crucial. They’re like the roots of a tree, providing the necessary base for its growth and stability. Let’s explore the key fundamental factors that are pivotal in predicting the future of NEAR Protocol.
Adoption Rate
When we talk about the adoption rate of NEAR Protocol, we’re essentially looking at how widely and rapidly it’s being embraced in the entire crypto ecosystem. This metric is crucial because, in the world of cryptocurrencies, popularity and trust often translate into value. Here are some additional aspects to consider when evaluating NEAR’s adoption rate:
- Institutional Adoption: Pay attention to any signs of NEAR being adopted by institutional investors or large corporations. Institutional support can lend significant credibility and stability to the cryptocurrency.
- Geographical Expansion: Analyzing the geographical spread of NEAR’s adoption is vital. A growing user base in diverse global markets can be a strong indicator of widespread acceptance.
- Educational Initiatives: Efforts made by the NEAR team to educate potential users and developers about their platform can play a crucial role in driving adoption. More educational resources and outreach programs can lead to increased use and development on the platform.
- Media Coverage: Positive media coverage, especially in mainstream finance and technology sectors, can significantly boost NEAR’s adoption rate. It’s a sign of growing interest and recognition outside the traditional crypto community.
- Community Initiatives: Community-driven projects and initiatives on the NEAR platform are a strong indicator of a vibrant and engaged user base. A passionate and active community can drive innovation and adoption.
By keeping an eye on these factors, one can gain a deeper understanding of how NEAR Protocol is being adopted across different spheres. A growing adoption rate is often a precursor to increased demand, which, in turn, can positively influence its price.
Regulatory Developments
Navigating the regulatory landscape of cryptocurrencies like NEAR Protocol is akin to steering through uncharted waters. Regulatory developments can have a profound impact on NEAR’s price, either fueling its ascent or triggering a decline. Here’s more on what to look out for in this domain:
- International Regulations: Keep an eye on global regulatory trends, as international policies can set precedents affecting NEAR’s market. For instance, favorable regulations in major economies can lead to increased investor confidence.
- Compliance and Licensing: The NEAR Protocol’s efforts to comply with various international regulatory standards and obtaining necessary licenses can be a significant positive signal. It denotes the project’s commitment to legitimacy and security.
- Central Bank Policies: Central banks’ stance on cryptocurrencies can influence NEAR’s market significantly. Supportive policies or the introduction of digital currencies can validate the crypto market, while skepticism or negative statements can have the opposite effect.
- Privacy and Security Regulations: Changes in privacy and security laws can impact how NEAR and other cryptocurrencies operate. Increased requirements for user privacy and data security can lead to technological advancements but may also involve compliance challenges.
- Regulatory Clarity: Clear and well-defined local regulations can provide a suitable environment for NEAR to grow. The clarity helps in reducing uncertainty and attracts more conservative investors to the market.
- Legal Recognition: Legal recognition of cryptocurrencies as a legitimate form of currency or asset class in more countries can significantly boost NEAR’s adoption and price.
Understanding these regulatory nuances is key to predicting how they might influence NEAR Protocol’s price. While regulatory developments can sometimes be unpredictable, staying informed about these changes can provide valuable insights into potential market movements.
Utility
The utility of NEAR Protocol goes beyond mere speculation; it’s about real-world applications that drive demand and underline its intrinsic value. In assessing NEAR’s potential, it’s crucial to understand how and where it’s being used. Here are some additional dimensions of NEAR’s utility to consider:
- Scalability Solutions: NEAR Protocol’s approach to solving scalability issues in blockchain technology can be a significant value driver. Its ability to handle large numbers of transactions quickly and cost-effectively can attract a wide range of applications, from small startups to large enterprises.
- Smart Contract Capabilities: The sophistication and efficiency of NEAR’s smart contract platform are vital. Look for how easily developers can build and deploy smart contracts on NEAR, as this can be a key factor in attracting innovative projects and developers.
- Tokenization of Assets: NEAR’s potential in facilitating the tokenization of real-world assets can open up new markets and opportunities. This could range from tokenizing real estate to creating digital art and collectibles.
- Interoperability Features: The ability of NEAR to interoperate with other blockchain networks enhances its utility. This feature can make NEAR a go-to platform for developers looking for cross-chain compatibility.
- Decentralized Autonomous Organizations (DAOs): NEAR’s support for creating and managing DAOs can be a significant utility factor. DAOs are becoming increasingly popular for decentralized governance and community-led initiatives.
- Sustainability Initiatives: With a growing emphasis on sustainability in the tech world, NEAR’s commitment to environmentally friendly practices can be a unique selling point. This aspect can appeal to a broader base of eco-conscious users and developers.
By considering these facets of NEAR Protocol’s utility, one can gain a more comprehensive understanding of its potential and the factors driving its adoption and value. Remember, the utility of a blockchain platform is a key determinant of its long-term success and sustainability in the ever-evolving crypto landscape.
Market Sentiment: How NEAR News Prediction Works
Assessing market sentiment for NEAR Protocol is akin to taking the pulse of the market’s emotional and psychological state. It’s an art that involves interpreting how various factors and news can sway public perception and, in turn, NEAR’s price. Here are some additional elements to consider when evaluating market sentiment:
- Technical Analysis Commentary: Opinions and analyses from respected figures in technical analysis can significantly sway investor sentiment. Pay attention to what these experts are saying about NEAR, especially during critical market movements.
- Economic Indicators: Broader economic indicators, like inflation rates, interest rates, and employment data, can indirectly affect NEAR’s market sentiment. For instance, a strong economic outlook might increase risk appetite, potentially boosting interest in cryptocurrencies.
- Sentiment Analysis Tools: Utilizing advanced tools that analyze social media trends and sentiment can provide real-time insights into public perception of NEAR. These tools often use AI and machine learning to gauge the mood of discussions across various platforms.
- Investor Surveys and Polls: Regular surveys and polls among cryptocurrency investors can offer a snapshot of the collective mindset. Changes in these surveys, especially regarding NEAR, can be telling of the market’s sentiment.
- Global News and Events: Geopolitical events, global financial news, and developments in other asset classes can influence sentiment in the crypto market. Positive global news might lead to a bullish sentiment, while negative news can trigger risk aversion.
- Community Forums and Discussions: Platforms like Reddit, Discord, and Telegram are hotbeds for crypto discussions. The tone and content of discussions in NEAR-focused groups can be a rich source of sentiment analysis.
By keeping a finger on the pulse of these diverse elements, one can better understand the prevailing market sentiment towards NEAR Protocol. It’s important to approach sentiment analysis with a critical eye, recognizing the difference between informed opinions and mere speculation.
The Bottom Line: Making Your Own NEAR Protocol Price Predictions
As we wrap up our journey through the intricate world of NEAR Protocol price prediction, it’s clear that this is a field blending art and science. We’ve sifted through expert opinions, delved deep into the realms of NEAR Protocol technical analysis, and unraveled the core elements of fundamental analysis. This comprehensive approach has given us a multifaceted view of NEAR’s potential trajectory, illuminated by the insights of business analysts and the concrete data of market trends and developments.
Remember, in the dynamic landscape of cryptocurrency, staying informed and agile is your best strategy. Whether you’re a seasoned trader or a curious newcomer, I hope this exploration into NEAR Protocol’s future prospects has been enlightening and will guide your investment decisions with a more informed perspective. Remember, the crypto journey is as much about learning and adapting as it is about investing.
FAQ
When Will NEAR Go Up?
Predicting the exact timing of a price increase for NEAR is like trying to catch a wave in the ocean. Market dynamics, influenced by a myriad of factors like investor sentiment, regulatory news, and overall crypto market health, play a crucial role. While technical indicators and expert analysis suggest potential upward movements, it’s important to remember that cryptocurrency markets are notoriously unpredictable. My investing advice? Keep a close eye on market trends and news related to NEAR for indications of a potential upswing.
Should I Buy NEAR?
Deciding whether to buy NEAR is a personal choice that should align with your investment goals and risk tolerance. It’s essential to do your own research – analyze NEAR’s market trends, its technological advancements, and the broader crypto market context. Diversification is key in any investment strategy, so consider how NEAR fits into your overall portfolio. And never underestimate the value of timing – being patient and observant can often lead to a wiser investment decision.
How High Can NEAR Go?
The potential height for NEAR’s price is a topic of much speculation. Historical data, current market trends, and future project developments are critical factors to consider. While some experts offer optimistic predictions based on NEAR’s technology and adoption rate, it’s crucial to approach these predictions with a balanced perspective. Remember, the crypto market is highly volatile, and while the potential for high returns exists, so does the risk of significant downturns.
Will NEAR Crash Again in 2024?
The possibility of a crash is an ever-present reality in the crypto world, and NEAR is no exception. Economic factors, regulatory changes, and market sentiment shifts could all contribute to a potential downturn. However, predicting a crash is challenging, as it depends on numerous unpredictable variables. My suggestion is to stay informed about global economic conditions and changes in the crypto industry, which can offer clues about the market’s direction. And as always, invest only what you can afford to lose.