Welcome, everyone! In today’s deep dive, we’re setting our sights on the intriguing world of MultiversX, with a special focus on its native token, EGLD. Predicting the price of EGLD is no small feat, given the complex interplay of market forces. But fear not, because we’re here to unravel this intricate tapestry, blending the rich history of MultiversX, from its foundational roots to its grand aspirations, with a thorough exploration of the forecasting tools and wisdom that seasoned traders employ to speculate on EGLD’s future trajectory.
Navigating the volatile seas of cryptocurrency requires more than just a good compass; it demands an intimate understanding of the vessel you’re sailing. MultiversX, with its ambitious vision and innovative technology, presents a unique case study. By delving into its past and purpose, we aim to arm you with the knowledge needed to appreciate the subtleties of EGLD price prediction.
Understanding the potential future value of EGLD is more than an academic exercise; it’s a crucial piece of the puzzle for investors, developers, and enthusiasts alike. The implications of accurate forecasts extend far beyond mere profit and loss, influencing strategic decisions and shaping the very development of the MultiversX ecosystem.
So, if your curiosity is piqued and you’re eager to embark on this exploratory journey with us, keep reading. We promise to equip you with insights and perspectives that will illuminate the path ahead, helping you navigate the ever-evolving landscape of EGLD with confidence and clarity.
MultiversX (EGLD) Overview
| EGLD Price | $16.08 |
| EGLD Price Change 24h | 3.22% |
| EGLD Price Change 7d | 20.75% |
| EGLD Market Cap | $457,119,152.66 |
| EGLD Circulating Supply | 28,429,572.51 |
| EGLD Trading Volume | $23,398,103.50 |
| EGLD All-Time High (ATH) | $542.58 |
| EGLD All-Time Low (ATL) | $6.54 |
A Brief History: MultiversX and Its Purpose
Diving into the annals of cryptocurrency, MultiversX emerges as a beacon of innovation and ambition. Born from the desire to push the boundaries of blockchain technology, MultiversX, formerly known as Elrond, has carved out a niche for itself by prioritizing scalability, speed, and user experience. Its native token, EGLD, serves as the lifeblood of the ecosystem, fueling transactions, staking, and governance. The journey of MultiversX is a testament to the relentless pursuit of a more interconnected and efficient digital landscape.
By harnessing the power of novel protocols and architectural designs, MultiversX aims to provide a foundation for the next generation of internet applications, decentralized financial products, and even new forms of digital governance. This ambitious purpose is not just about creating another blockchain platform; it’s about laying the groundwork for a future where decentralized systems play a central role in our daily lives, empowering individuals with unprecedented control and security over their digital interactions.
Notable Fluctuations in EGLD’s Value
The valuation journey of EGLD has been nothing short of a rollercoaster, marked by significant fluctuations that capture the attention of traders and investors alike. Here’s a snapshot of some of the most pivotal moments in EGLD’s price history:
- The Initial Surge: Following its launch, EGLD quickly gained momentum, captivating the market with its promise and potential.
- The Record Peaks: There were moments when EGLD reached unprecedented heights, setting new benchmarks for its market value.
- The Sudden Dips: Just as with any cryptocurrency, EGLD has seen its share of rapid declines, testing the resolve of its holders.
- The Steady Recoveries: Each dip was followed by periods of recovery, where EGLD gradually regained its lost value, showcasing resilience and enduring faith in MultiversX’s vision.
MultiversX – EGLD Price Prediction For Today, Tomorrow, This Week, and Next 30 Days
| Date | Price | Change |
|---|---|---|
| July 15, 2025 | 16.22 | 0.85% |
| July 16, 2025 | 16.23 | 0.09% |
| July 17, 2025 | 16.32 | 0.52% |
| July 18, 2025 | 16.46 | 0.88% |
| July 19, 2025 | 16.62 | 0.98% |
| July 20, 2025 | 16.49 | -0.77% |
| July 21, 2025 | 16.33 | -0.97% |
| July 22, 2025 | 16.34 | 0.06% |
| July 23, 2025 | 16.21 | -0.84% |
| July 24, 2025 | 16.10 | -0.62% |
| July 25, 2025 | 16.15 | 0.27% |
| July 26, 2025 | 16.21 | 0.37% |
| July 27, 2025 | 16.11 | -0.60% |
| July 28, 2025 | 16.07 | -0.24% |
| July 29, 2025 | 16.15 | 0.51% |
| July 30, 2025 | 16.04 | -0.71% |
| July 31, 2025 | 16.07 | 0.21% |
| August 01, 2025 | 16.23 | 1.00% |
| August 02, 2025 | 16.39 | 0.95% |
| August 03, 2025 | 16.34 | -0.30% |
| August 04, 2025 | 16.24 | -0.63% |
| August 05, 2025 | 16.37 | 0.84% |
| August 06, 2025 | 16.23 | -0.86% |
| August 07, 2025 | 16.12 | -0.69% |
| August 08, 2025 | 16.15 | 0.19% |
| August 09, 2025 | 16.05 | -0.65% |
| August 10, 2025 | 15.93 | -0.71% |
| August 11, 2025 | 15.84 | -0.56% |
| August 12, 2025 | 15.93 | 0.54% |
| August 13, 2025 | 16.08 | 0.93% |
MultiversX Price Prediction 2024
Heading into 2024, trying to guess where MultiversX’s price will end up is like stepping into unknown territory, full of excitement and a bit of mystery. I’m here to guide you through what might happen, showing the potential ups and downs MultiversX could face. Get ready for a journey full of unexpected turns!
We might see MultiversX start off with a bit of a stumble, possibly dropping to around $14.47, but don’t let that get you down. It’s all part of the adventure. The expectation is for it to bounce back, reaching an average price of $16.88. And for those who like a bit of excitement, there’s even a chance it could reach a high of $19.29.
As we look ahead to 2024, the path for MultiversX seems hopeful. We might not see the wild swings that keep you on the edge of your seat, but a more steady journey is expected, with just enough twists to keep it interesting. If you’re thinking about adding something new to your crypto mix, MultiversX could be a fun option.
For those drawn to MultiversX’s unique character, it’s important to be cautious and think things through. The crypto world is full of surprises, and MultiversX is no exception. The best approach is to do your own research and keep an eye on market trends.
| Month | Minimum Price | Average Price | Maximum Price |
|---|---|---|---|
| February 2024 | 60.64 | 62.97 | 65.55 |
| March 2024 | 62.27 | 64.67 | 67.32 |
| April 2024 | 63.95 | 66.41 | 69.13 |
| May 2024 | 65.68 | 68.20 | 71.00 |
| June 2024 | 67.45 | 70.05 | 72.92 |
| July 2024 | 69.28 | 71.94 | 74.89 |
| August 2024 | 71.15 | 73.88 | 76.91 |
| September 2024 | 73.07 | 75.87 | 78.99 |
| October 2024 | 75.04 | 77.92 | 81.12 |
| November 2024 | 77.07 | 80.03 | 83.31 |
| December 2024 | 79.15 | 82.19 | 85.56 |
| January 2025 | 81.28 | 84.41 | 87.87 |
January 2024: MultiversX Price Forecast
As we embrace the new year, MultiversX presents an intriguing financial tableau. The whispers from the crypto corridors suggest a minimum price gently resting at $55.56, while the average price might meander through the market at $60.64. For the bold-hearted, the maximum price could ascend to a robust $62.97. Keep a keen eye on this digital contender; it’s shaping up to set a vigorous pace for the year ahead.
EGLD Price Forecast for February 2024
February’s forecast sees MultiversX’s numbers holding a firm grip on the market’s frosty winds. The minimum price is expected to hover at $60.64, offering a steady floor beneath our feet. The average price is projected to warm up to $62.97, while the maximum price could spike to a vivacious $65.55. It’s a month that might require some nifty navigation through the crypto currents.
March 2024: MultiversX Price Forecast
With spring on the horizon, March hints at a fresh bloom for MultiversX’s value. Crypto aficionados are eyeing a minimum price of $62.27, with the market’s heartbeat potentially raising the average price to $64.67. Those looking for a zenith might be rewarded with a maximum price scaling up to $67.32. As the season shifts, so might your strategies need to adapt.
EGLD Price Forecast for April 2024
April’s numbers for MultiversX are painting a picture of gradual ascent. The data points to a minimum price of $63.95, climbing to an average that could reach $66.41. The maximum price is looking to peak at $69.13, offering a promising horizon for traders with their sights set high. It’s a month that may well demand astute attention to emerging patterns.
May 2024: MultiversX Price Forecast
As flowers bloom in May, so does the forecast for MultiversX offer rosy prospects. A minimum price is predicted to be $65.68, while the average price could blossom to $68.20. And for those chasing the high notes, the maximum price might just flourish to an impressive $71.00. It’s the perfect time for investors to prune their portfolios for potential growth.
EGLD Price Forecast for June 2024
June sees the MultiversX price prediction basking in the early summer sun. Analysts chart a minimum price of $67.45, with the average price expected to warm up the markets at $70.05. For those willing to ride the waves, a maximum price of $72.92 could be the crest they’re looking for. It’s an ideal moment for traders to sunbathe in the glow of careful speculation.
July 2024: MultiversX Price Forecast
As we hit the mid-year mark, MultiversX seems to be taking a confident stride. The market chatter pegs the minimum price at a solid $69.28, suggesting a sturdy baseline for the month. Averaging out at $71.94, the price could offer a steady hand to those navigating the midsummer crypto waves, with the possibility of reaching a maximum price that could crest at $74.89. July could be the month to refine your investment tactics under the sun.
EGLD Price Forecast for August 2024
August brings a simmering forecast for MultiversX, with the numbers hinting at sustained growth. The minimum price is poised to stand at $71.15, potentially providing a stable launchpad for the month. The average price is looking to cook up to $73.88, with the maximum price potentially spiking to a fiery $76.91. It’s a month where staying hydrated might mean keeping liquidity ready for swift moves.
September 2024: MultiversX Price Forecast
As the leaves begin to turn, September’s MultiversX price prediction seems to be turning over a new leaf as well. With a minimum price expected to leaf out at $73.07, and an average price that could grow to $75.87, the maximum price is looking to branch up to $78.99. It’s a month that might just be ripe for investors to harvest the fruits of their labor.
EGLD Price Forecast for October 2024
October’s forecast for MultiversX is a basket of mixed treats. The minimum price is anticipated to settle at $75.04, while the average price is likely to carve out a path at $77.92. The maximum price could reach a spooktacular $81.12, offering potential treats for the bold. It’s a month that may call for some bewitching strategy tweaks.
November 2024: MultiversX Price Forecast
November’s chill brings a forecast that could warm the hearts of MultiversX enthusiasts. The minimum price is projected to nestle at $77.07, while the average price could kindle up to $80.03. For those looking for the warmth of higher gains, the maximum price might just ignite to $83.31. It’s a time to gather around the hearth of market analysis and stoke the flames of your investment decisions.
EGLD Price Forecast for December 2024
In the closing chapter of 2024, MultiversX’s price prediction is looking to wrap up the year with a bow. The minimum price is expected to snugly fit at $79.15, with the average price potentially packaging itself up to $82.19. And who knows? The maximum price might just surprise us, reaching a festive $85.56. December could be the month to reflect on the year’s moves and strategize anew for the coming year.
MultiversX Price Prediction 2025
Delving into the intricate dynamics of MultiversX, it’s intriguing to note the forecasted price trajectory for 2025. The financial landscape is expected to set the minimum price at $80.39, with a more stable median hovering around $95.37. For those with an eye on peak performance, the zenith could reach up to $113.43. This spectrum of values underscores a year of promising growth and potential for savvy investors.
| Month | Minimum Price | Average Price | Maximum Price |
|---|---|---|---|
| February 2025 | 80.39 | 83.47 | 86.90 |
| March 2025 | 82.56 | 85.73 | 89.24 |
| April 2025 | 84.79 | 88.04 | 91.65 |
| May 2025 | 87.07 | 90.42 | 94.13 |
| June 2025 | 89.43 | 92.86 | 96.67 |
| July 2025 | 91.84 | 95.37 | 99.28 |
| August 2025 | 94.32 | 97.94 | 101.96 |
| September 2025 | 96.87 | 100.59 | 104.71 |
| October 2025 | 99.48 | 103.30 | 107.54 |
| November 2025 | 102.17 | 106.09 | 110.44 |
| December 2025 | 104.93 | 108.96 | 113.43 |
| January 2026 | 107.76 | 111.90 | 116.49 |
MultiversX Price Prediction 2026
Peering into 2026, the anticipation around MultiversX’s financial journey heightens. Market whispers and analytical insights peg the minimum price at an encouraging $106.57. The consensus average, a beacon for many, is expected to settle at $126.44, while the maximum price could soar to an impressive $150.38. These figures paint a picture of steady ascent and expanding horizons for MultiversX.
| Month | Minimum Price | Average Price | Maximum Price |
|---|---|---|---|
| February 2026 | 106.57 | 110.67 | 115.21 |
| March 2026 | 109.45 | 113.66 | 118.32 |
| April 2026 | 112.41 | 116.73 | 121.51 |
| May 2026 | 115.44 | 119.88 | 124.79 |
| June 2026 | 118.56 | 123.11 | 128.16 |
| July 2026 | 121.76 | 126.44 | 131.62 |
| August 2026 | 125.05 | 129.85 | 135.18 |
| September 2026 | 128.42 | 133.36 | 138.83 |
| October 2026 | 131.89 | 136.96 | 142.57 |
| November 2026 | 135.45 | 140.66 | 146.42 |
| December 2026 | 139.11 | 144.45 | 150.38 |
| January 2027 | 142.87 | 148.36 | 154.44 |
MultiversX Price Prediction 2027
As we cast our gaze towards 2027, the narrative around MultiversX’s valuation takes an interesting turn. The groundwork is laid with a minimum price of $141.30, suggesting a resilient foundation. The narrative thickens at an average price of $167.63, indicative of a robust market sentiment. The climax? A maximum price of $199.37, heralding a year of significant milestones and opportunities.
| Month | Minimum Price | Average Price | Maximum Price |
|---|---|---|---|
| February 2027 | 141.30 | 146.73 | 152.74 |
| March 2027 | 145.11 | 150.69 | 156.87 |
| April 2027 | 149.03 | 154.76 | 161.10 |
| May 2027 | 153.06 | 158.94 | 165.45 |
| June 2027 | 157.19 | 163.23 | 169.92 |
| July 2027 | 161.43 | 167.63 | 174.51 |
| August 2027 | 165.79 | 172.16 | 179.22 |
| September 2027 | 170.27 | 176.81 | 184.06 |
| October 2027 | 174.86 | 181.58 | 189.03 |
| November 2027 | 179.59 | 186.49 | 194.13 |
| December 2027 | 184.43 | 191.52 | 199.37 |
| January 2028 | 189.41 | 196.69 | 204.76 |
MultiversX Price Prediction 2028
Turning the page to 2028, the chronicle of MultiversX unfolds with renewed vigor. A minimum price of $187.33 sets the stage for a year of solid growth, while the average price of $222.24 signals a harmonious market equilibrium. The plot thickens as we eye a maximum price of $264.32, a figure that speaks volumes of the asset’s untapped potential and investor confidence.
| Month | Minimum Price | Average Price | Maximum Price |
|---|---|---|---|
| February 2028 | 187.33 | 194.52 | 202.50 |
| March 2028 | 192.38 | 199.78 | 207.97 |
| April 2028 | 197.58 | 205.17 | 213.58 |
| May 2028 | 202.91 | 210.71 | 219.35 |
| June 2028 | 208.39 | 216.40 | 225.27 |
| July 2028 | 214.02 | 222.24 | 231.35 |
| August 2028 | 219.80 | 228.24 | 237.60 |
| September 2028 | 225.73 | 234.40 | 244.02 |
| October 2028 | 231.83 | 240.73 | 250.60 |
| November 2028 | 238.09 | 247.23 | 257.37 |
| December 2028 | 244.51 | 253.91 | 264.32 |
| January 2029 | 251.12 | 260.76 | 271.46 |
MultiversX Price Prediction 2029
As the calendar flips to 2029, the saga of MultiversX’s market performance enters a new chapter. With a minimum price of $248.36, the stage is set for a narrative of resilience and endurance. The plot weaves through an average price of $294.65, reflecting a steady heartbeat of market dynamics. The story reaches a crescendo with a maximum price of $350.43, epitomizing a year of triumphs and peak valuations.
| Month | Minimum Price | Average Price | Maximum Price |
|---|---|---|---|
| February 2029 | 248.36 | 257.90 | 268.47 |
| March 2029 | 255.06 | 264.86 | 275.72 |
| April 2029 | 261.95 | 272.01 | 283.17 |
| May 2029 | 269.02 | 279.36 | 290.81 |
| June 2029 | 276.29 | 286.90 | 298.66 |
| July 2029 | 283.75 | 294.65 | 306.73 |
| August 2029 | 291.41 | 302.60 | 315.01 |
| September 2029 | 299.28 | 310.77 | 323.52 |
| October 2029 | 307.36 | 319.17 | 332.25 |
| November 2029 | 315.65 | 327.78 | 341.22 |
| December 2029 | 324.18 | 336.63 | 350.43 |
| January 2030 | 332.93 | 345.72 | 359.90 |
MultiversX Price Prediction 2030
Venturing into the next decade with 2030, the odyssey of MultiversX’s valuation takes a promising leap. The year is earmarked with a minimum price of $329.27, indicating a steadfast trajectory. The tale meanders through an average landscape of $390.64, embodying the essence of market stability. The journey peaks at a maximum price of $464.60, painting a picture of unparalleled growth and investor optimism.
| Month | Minimum Price | Average Price | Maximum Price |
|---|---|---|---|
| February 2030 | 329.27 | 341.92 | 355.94 |
| March 2030 | 338.16 | 351.15 | 365.55 |
| April 2030 | 347.29 | 360.63 | 375.42 |
| May 2030 | 356.67 | 370.37 | 385.55 |
| June 2030 | 366.30 | 380.37 | 395.96 |
| July 2030 | 376.19 | 390.64 | 406.66 |
| August 2030 | 386.34 | 401.19 | 417.63 |
| September 2030 | 396.77 | 412.02 | 428.91 |
| October 2030 | 407.49 | 423.14 | 440.49 |
| November 2030 | 418.49 | 434.57 | 452.38 |
| December 2030 | 429.79 | 446.30 | 464.60 |
| January 2031 | 441.39 | 458.35 | 477.14 |
MultiversX Price Prediction 2031
As we approach 2031, the narrative around MultiversX’s market valuation deepens. A minimum price of $436.54 lays a robust foundation for the year, setting a tone of unwavering progress. The storyline unfolds with an average price of $517.90, a testament to consistent market health. The narrative climaxes at a maximum price of $615.95, symbolizing a year of remarkable achievements and bullish trends.
| Month | Minimum Price | Average Price | Maximum Price |
|---|---|---|---|
| February 2031 | 436.54 | 453.31 | 471.89 |
| March 2031 | 448.32 | 465.55 | 484.63 |
| April 2031 | 460.43 | 478.12 | 497.72 |
| May 2031 | 472.86 | 491.03 | 511.16 |
| June 2031 | 485.62 | 504.28 | 524.96 |
| July 2031 | 498.74 | 517.90 | 539.13 |
| August 2031 | 512.20 | 531.88 | 553.69 |
| September 2031 | 526.03 | 546.24 | 568.64 |
| October 2031 | 540.24 | 560.99 | 583.99 |
| November 2031 | 554.82 | 576.14 | 599.76 |
| December 2031 | 569.80 | 591.69 | 615.95 |
| January 2032 | 585.19 | 607.67 | 632.58 |
MultiversX Price Prediction 2032
Gazing into 2032, the tale of MultiversX’s financial journey reaches new heights. The year begins with a minimum price of $578.75, anchoring the asset’s growth trajectory. The narrative flourishes at an average price of $686.62, mirroring a balanced and mature market. The plot culminates with a maximum price of $816.62, heralding a period of unprecedented prosperity and market leadership.
| Month | Minimum Price | Average Price | Maximum Price |
|---|---|---|---|
| February 2032 | 578.75 | 600.99 | 625.63 |
| March 2032 | 594.38 | 617.22 | 642.52 |
| April 2032 | 610.43 | 633.88 | 659.87 |
| May 2032 | 626.91 | 651.00 | 677.69 |
| June 2032 | 643.84 | 668.57 | 695.98 |
| July 2032 | 661.22 | 686.62 | 714.78 |
| August 2032 | 679.07 | 705.16 | 734.08 |
| September 2032 | 697.41 | 724.20 | 753.90 |
| October 2032 | 716.24 | 743.76 | 774.25 |
| November 2032 | 735.58 | 763.84 | 795.16 |
| December 2032 | 755.44 | 784.46 | 816.62 |
| January 2033 | 775.83 | 805.64 | 838.67 |
The Main Questions Of Critical Thinking When We Talk About MultiversX Price Forecast
In the rapidly evolving landscape of cryptocurrency, critical thinking is paramount when forecasting the future price of EGLD. By questioning the underlying assumptions and evaluating the myriad of factors influencing the market, investors and analysts can better navigate the complexities of EGLD’s potential growth trajectory.
- What factors could potentially drive MultiversX’s price upwards in the forecast period?
- How might global economic trends impact the value of EGLD in the coming years?
- Are there any regulatory changes on the horizon that could affect MultiversX’s market position?
- What technological advancements within the blockchain sector could influence EGLD’s price trajectory?
- How does the current adoption rate of MultiversX compare to its competitors, and what does that mean for its future price?
- Considering EGLD’s historical price volatility, what risk management strategies should investors consider?
- What role do partnerships and collaborations play in shaping MultiversX’s market value and reputation?
- How might changes in user sentiment and social media trends impact the demand and price of EGLD?
- In what ways could the scalability and transaction speed of MultiversX influence its attractiveness to new users and investors?
- What are the potential implications of geopolitical tensions on the stability and growth of EGLD’s market price?
- How do the tokenomics of MultiversX, including supply mechanisms and token burns, affect its long-term value?
- What impact could competition from emerging cryptocurrencies and blockchain projects have on EGLD’s market share and price?
- Could innovations in decentralized finance (DeFi) and non-fungible tokens (NFTs) associated with MultiversX drive its price growth?
- How might changes in energy consumption and environmental concerns related to blockchain technology affect the perception and value of EGLD?
- What are the potential risks and rewards of investing in MultiversX during a bear market versus a bull market?
- How does the development roadmap and future updates of EGLD align with its price predictions?
- What influence do major institutional investors and whales have on the liquidity and price swings of MultiversX?
- Considering EGLD’s use case and adoption in decentralized applications (dApps), how might this drive demand and price?
- How resilient is MultiversX’s network to cybersecurity threats, and what impact could a major breach have on its price?
- What are the implications of central bank digital currencies (CBDCs) and other regulatory developments on the future utility and value of EGLD?
Concluding, the process of scrutinizing EGLD’s price forecast through a critical lens empowers stakeholders to make more informed investing decisions. By addressing these pivotal questions, individuals can uncover deeper insights and foster a more nuanced understanding of EGLD’s place in the broader cryptocurrency ecosystem.
MultiversX (EGLD) Future Price Predictions by Experts
Jumping into the busy world of crypto, I’ve been keeping an ear to the ground, listening to what the experienced crypto folks have to say about MultiversX (EGLD).
- GOV Capital: According to GOV Capital’s MultiversX future price predictions, the EGLD price is anticipated to reach $182.61 by the end of 2024.
- Wallet Investor: Wallet Investor’s analysis on MultiversX (EGLD) suggests that a long-term increase in price is not expected, projecting the price to be around $39.88 by the end of 2024.
- Digital Coin Price: Digital Coin Price’s forecast, considering the current market dynamics, posits that the EGLD price could peak at $181.56 by 2027, with a potential dip to a minimum of $152.53. The average price is expected to stabilize at approximately $173.17.
Here’s a bit of investment advice from one investor to another: it’s good to listen to what the experts are saying, but don’t just take their word for it. Their views can help guide you, but the real effort has to come from you. Do your own digging, get a sense of the market vibes, and that’s when things will start to click for your investments.
Decoding the Charts: MultiversX Technical Price Analysis
Diving into the world of MultiversX, it’s like piecing together a puzzle where every bit of data tells a story. When we talk about technical analysis, it’s not just about numbers; it’s about understanding the heartbeat of the market. Here are some tools that act like our secret code breakers:
- Candlestick Patterns: These are the Morse code of the trading world, giving us hints about market sentiment and potential reversals.
- Moving Averages: Think of these as the market’s pulse rate, showing us the health trend over time.
- Volume Analysis: This tells us how loud the market is talking, with high volume signaling strong interest and potential moves.
- Support and Resistance Levels: These are like the floors and ceilings in price, where the market takes a breather before making its next move.
- Trend Analysis: It’s about catching the wave and seeing where the current is taking us, up or down.
- Chart Patterns: These are the market’s footprints, showing us where it’s been and hinting at where it’s going.
- Timeframes: Each timeframe gives us a different chapter of the story, from the quick flips to the long hauls.
Technical Indicators: Origin and Purpose
In the bustling world of trading, technical indicators are like the trusty tools in a sailor’s navigational kit. They emerged from the collective wisdom of countless traders over the years, each adding their own twist to chart analysis. These indicators serve as beacons, illuminating patterns in the chaotic sea of market data. Whether it’s a simple moving average that smooths out price fluctuations to reveal underlying trends or the complex Fibonacci retracements uncovering hidden support and resistance levels, each indicator has its unique backstory and utility.
At their core, technical indicators are designed to do two things: simplify and predict. They simplify by distilling vast amounts of price data into manageable signals and predict by using historical price actions to forecast future movements. It’s like looking at the trail left by a ship on the sea and predicting its next turn based on the patterns of its wake. Whether you’re charting the course for MultiversX or any other asset, understanding the origin and purpose of these navigational aids can significantly enhance your trading strategy.
The Role of Technical Indicators in Financial Markets
Technical indicators are our trusty compass in the vast sea of financial markets. Born from the need to make sense of the endless waves of price movements, these tools are the lighthouses guiding traders through stormy or calm waters. They crunch past and current price data to forecast future market directions, acting as our first mate in the journey of trading.
How Technical Indicators Can Help Predict EGLD Price
When it comes to EGLD, using technical indicators is like having a crystal ball, but one that requires skill and insight to interpret. They help us cut through the noise and focus on what matters, identifying potential entry and exit points. By applying these indicators, we can get a clearer picture of where EGLD might be heading, making our investment decisions not just guesses but informed choices. Whether it’s spotting a bullish trend with a moving average crossover or catching a reversal with RSI divergence, these tools are invaluable for anyone looking to navigate the EGLD market waters.
During my crypto journey, I’ve picked up a couple of straightforward strategies that really help make sense of those complex charts. Now, I’m not saying these are a surefire win, but they’ve definitely helped me see through the market’s rollercoaster ride. My investing advice? Mix and match these techniques with a keen eye on the broader market trends.
Let me walk you through a few of these handy tricks. We’ll explore how they can shed some light on where EGLD’s price might be heading next. Think of this as a casual chat between friends, where I’m sharing some insights that might just make navigating the crypto market’s ups and downs a tad easier for you.
Moving Averages (MAs) for MultiversX Price Prediction
Moving Averages (MAs) are like the bread and butter of the trading world, offering a smoothed-out line over the price chart to highlight the trend direction. By averaging the closing prices over a set period, MAs can help you see beyond the daily price fluctuations to the bigger trend at play. Whether you’re using a simple moving average (SMA) or an exponential moving average (EMA), the goal is to pinpoint potential trend reversals or confirm ongoing trends.
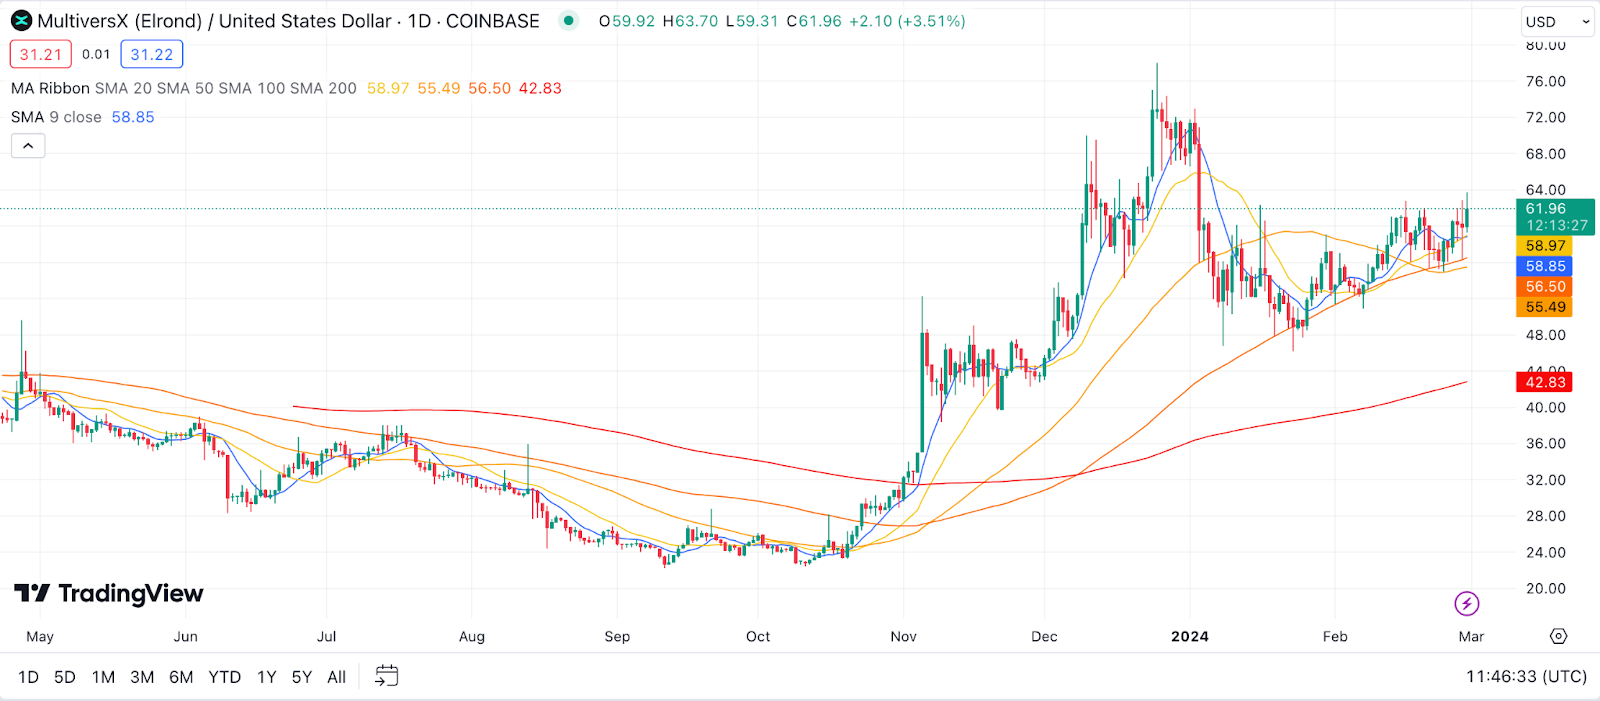
Example: Let’s say MultiversX (EGLD) has been on a rollercoaster, but you’re eyeing the 50-day MA and notice it’s been steadily climbing over the past two weeks. This could be your hint that despite the daily ups and downs, EGLD’s overall trend is pointing up, suggesting a potentially good time to consider jumping in.
Relative Strength Index (RSI) for MultiversX Price Prediction
The Relative Strength Index (RSI) is your go-to gauge for figuring out if MultiversX is being overbought or oversold. By moving within a range of 0 to 100, the RSI tells you when the market might be due for a reversal. Generally, an RSI above 70 suggests that EGLD might be overbought (and due for a price drop), while an RSI below 30 indicates it could be oversold (and ready for a price increase).
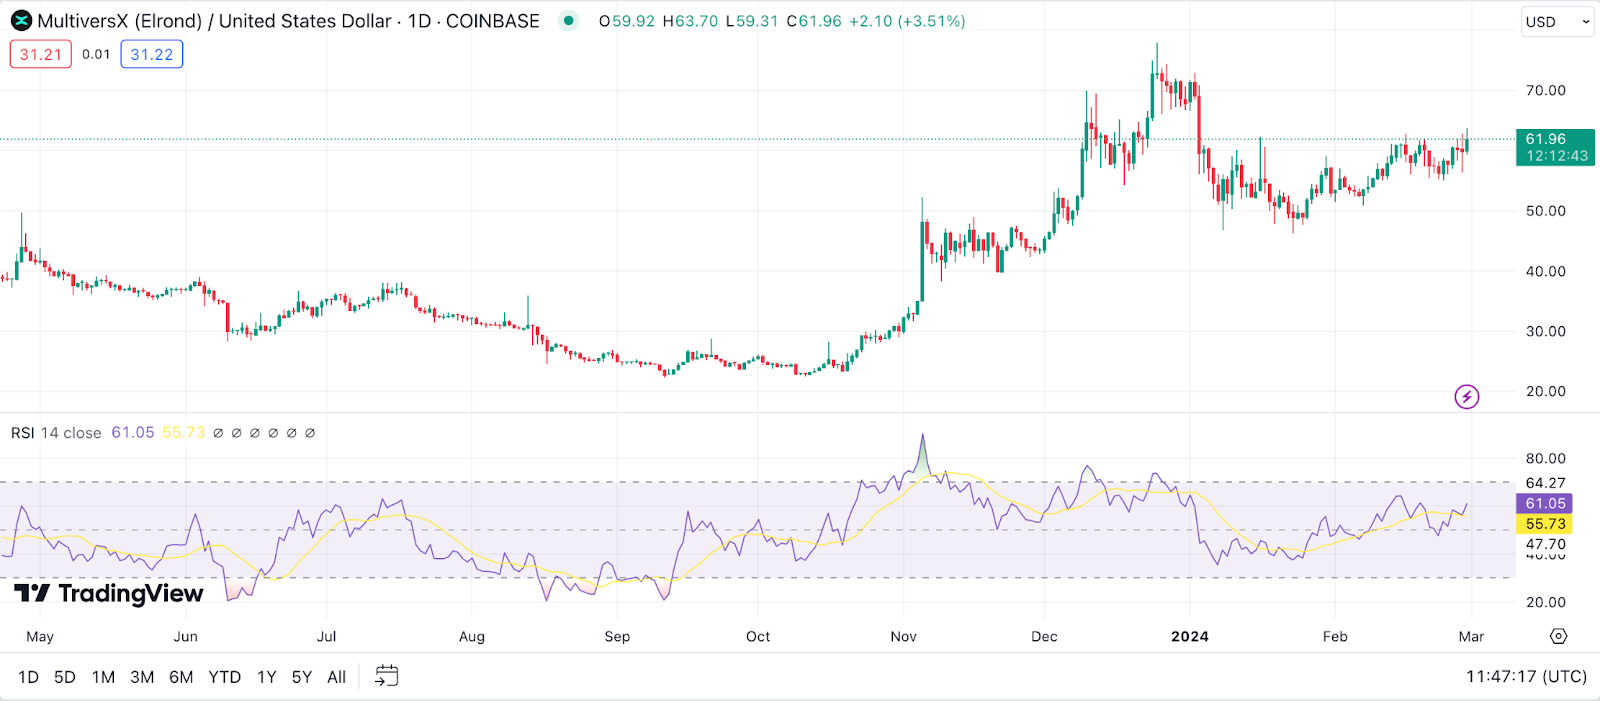
Example: Imagine you’re looking at EGLD’s chart and see the RSI dipping below 30. This might be your signal that the selling pressure has been a bit too much, and EGLD could be gearing up for a bounce back. It’s like a little nudge, telling you to keep a closer eye on EGLD for a potential buy opportunity.
Moving Average Convergence Divergence (MACD) for MultiversX Price Prediction
Moving Average Convergence Divergence (MACD) is a bit like having a conversation between two moving averages, with the aim of spotting momentum shifts before they happen. The MACD line (the difference between two EMAs) and the signal line (an EMA of the MACD line) dance around each other, and their crossovers can signal potential buy or sell opportunities.
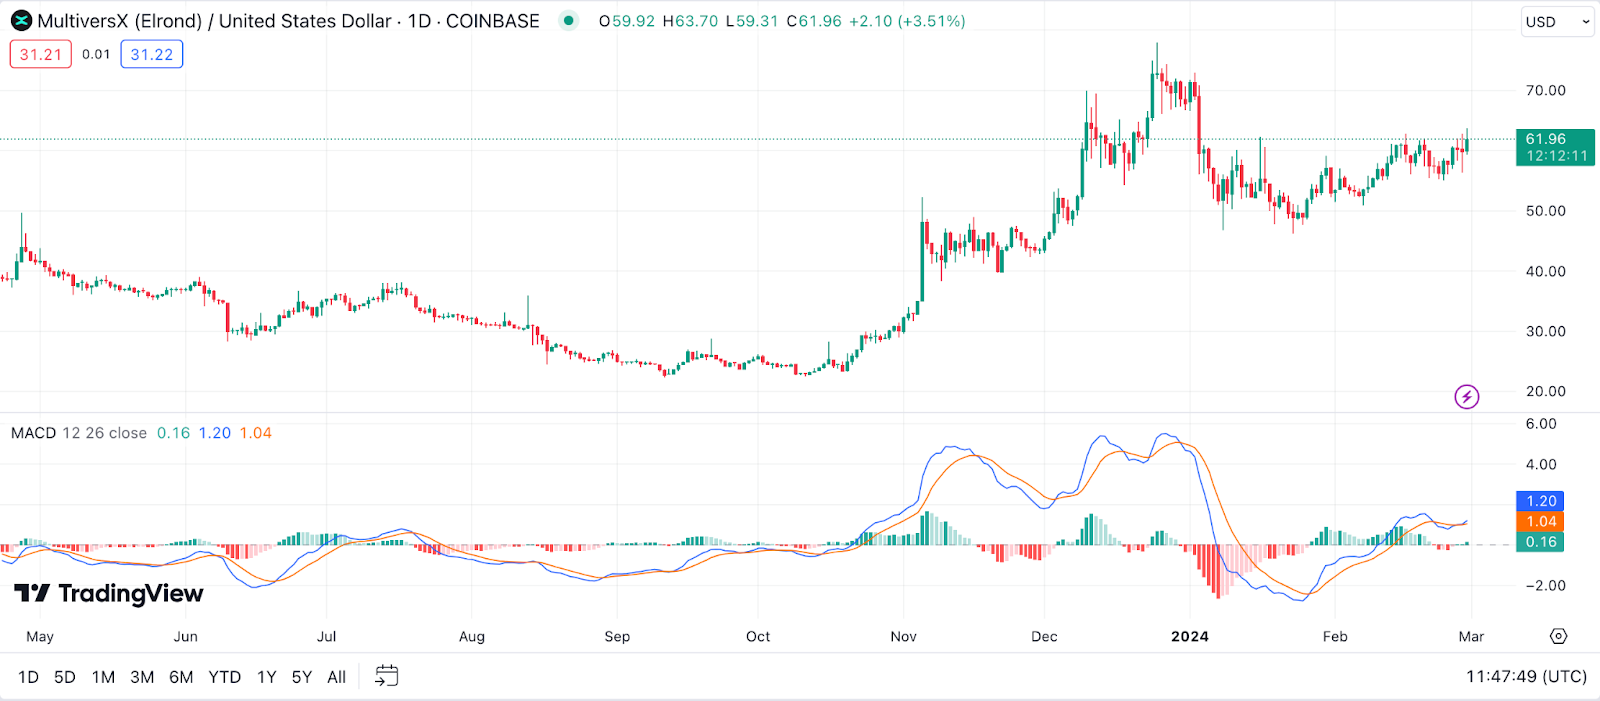
Example: If you’re tracking EGLD and notice the MACD line crossing above the signal line, it’s like the market whispering, “Hey, the momentum might be shifting in EGLD’s favor.” This crossover could be your cue to consider EGLD a bit more seriously, as it might indicate an upcoming upward trend.
Bollinger Bands for MultiversX Price Prediction
Bollinger Bands wrap around the price chart of MultiversX like a comforting blanket, offering insights into the market’s volatility. These bands expand during volatile periods and contract when the market calms down, essentially providing a visual representation of the ‘breathing’ market. The price tends to bounce between the upper and lower bands, and when it hugs the edges too closely, it might be hinting at a potential price reversal.
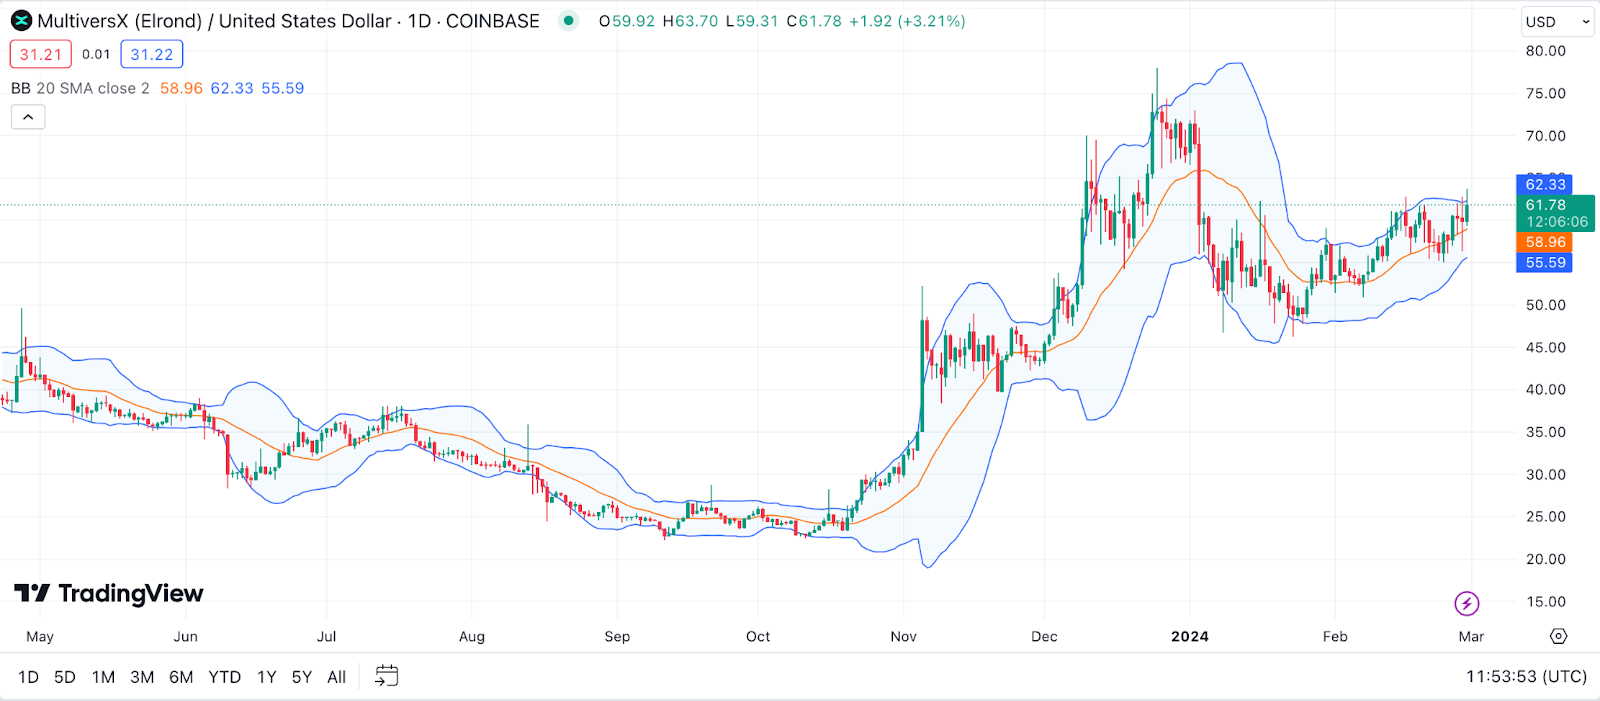
Example: When EGLD’s price starts poking at or even breaches the upper Bollinger Band, it’s like the market is hinting that EGLD might be a bit too hot, and a cool-down could be on the cards. Conversely, if the price dips to touch the lower band, it might be signaling that EGLD is undervalued and could soon see an uptick.
Stochastic Oscillator for MultiversX Price Prediction
The Stochastic Oscillator is all about momentum, comparing the closing price of MultiversX to its price range over a given period. This handy tool oscillates between 0 and 100, and similar to RSI, it helps identify overbought or oversold conditions. When the stochastic lines cross above 80, the market might be overbought; below 20, and it could be oversold.
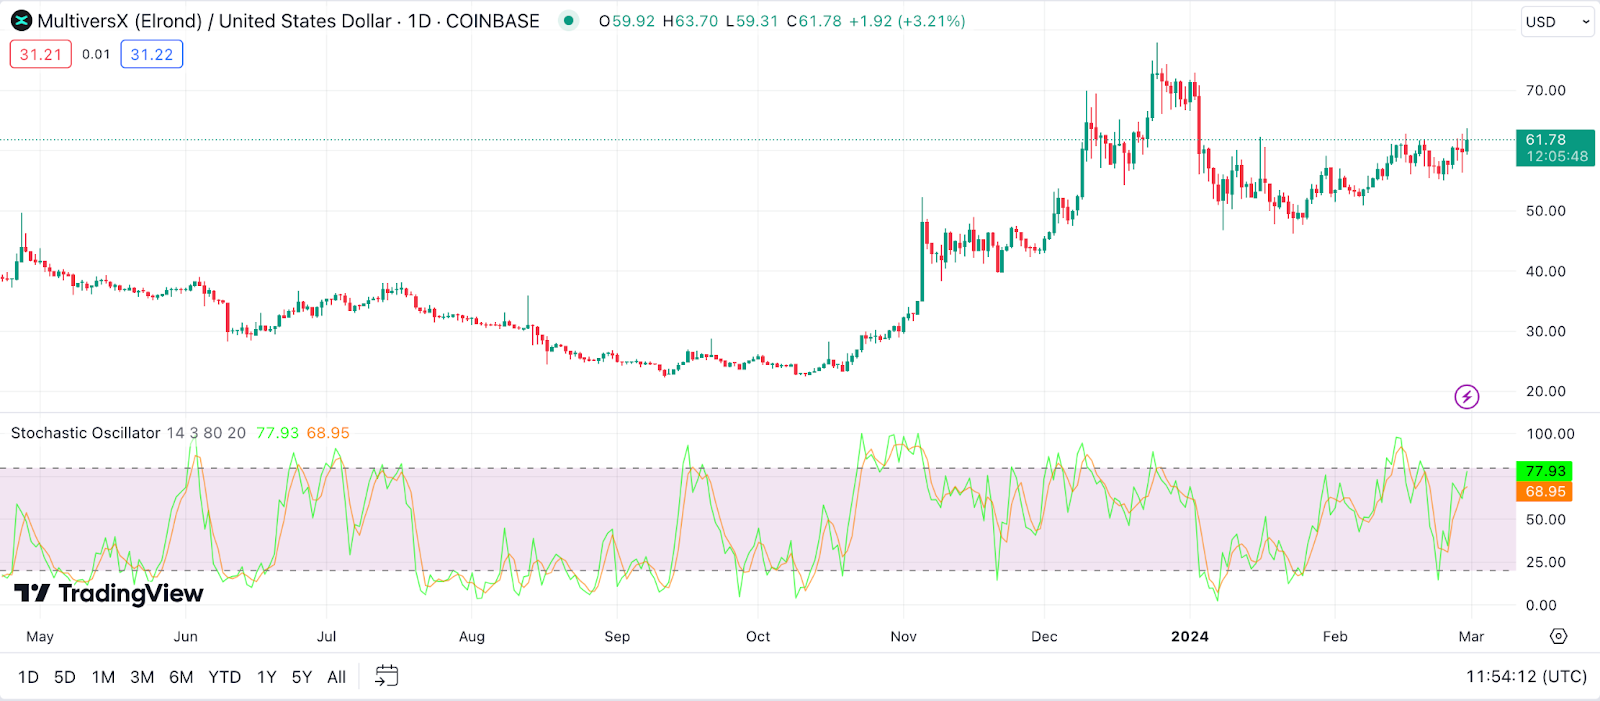
Example: Picture this: EGLD’s stochastic lines just made a bullish crossover below the 20 mark. This little dance move suggests that EGLD’s price might have been pushed too low and could be gearing up for a rally. It’s like the market’s way of winking at you, hinting that it might be time to pay closer attention to EGLD.
Parabolic SAR (Stop and Reverse) for MultiversX Price Prediction
Parabolic SAR is like your trusty trail guide through the hills and valleys of the MultiversX price chart. It places dots on the chart that help determine the direction of the price movement. When the dots flip from one side of the price to the other, it signals a potential change in the market direction. This tool is especially useful for spotting potential stop and reverse points in a trending market.
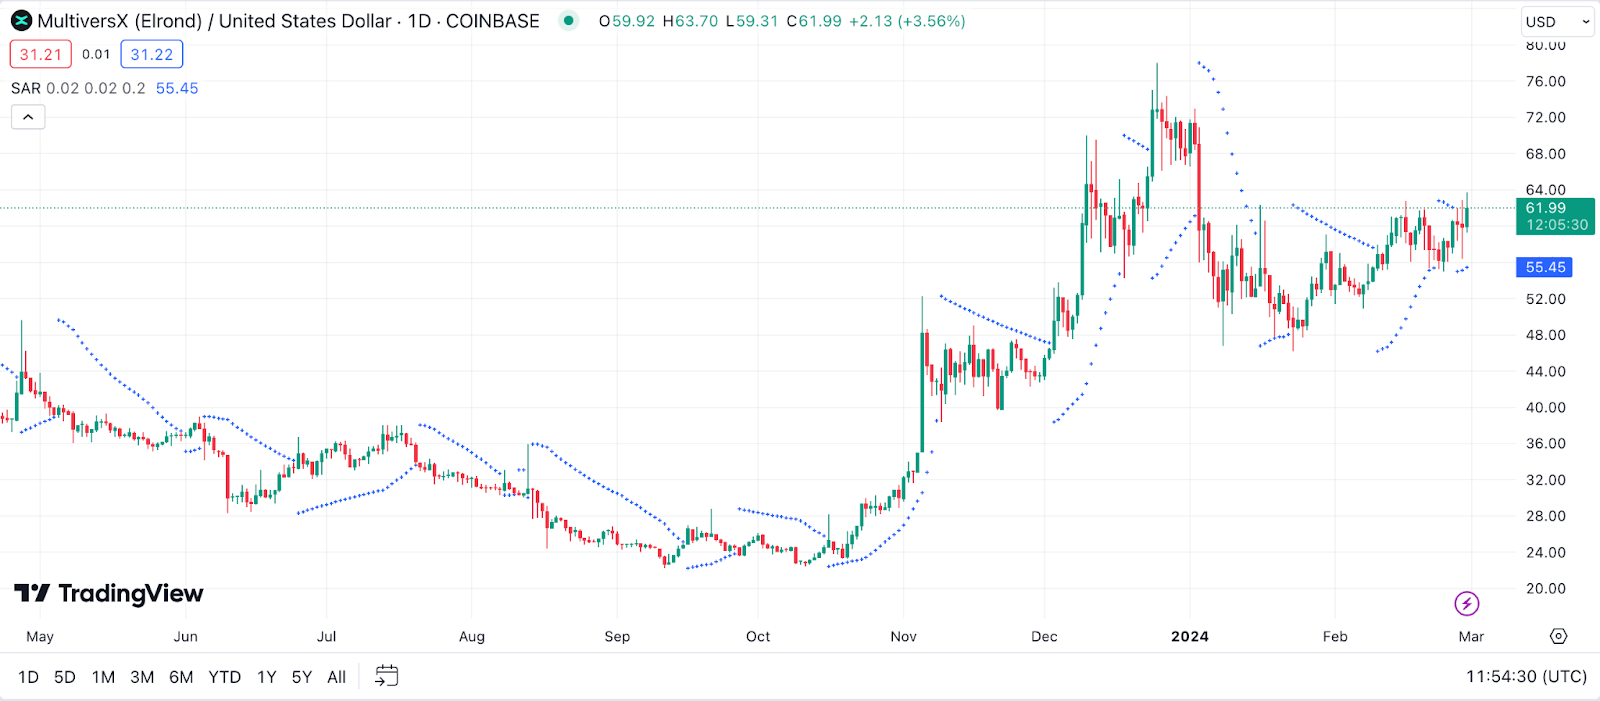
Example: Let’s say you’re watching EGLD and the dots have been below the price, guiding it upwards like little stepping stones. Suddenly, they jump above the price. This shift could be the market’s way of saying, “Hold up, we might be changing course here.” It’s a visual cue that the uptrend might be losing steam, and it could be time to reassess your EGLD strategy.
Ichimoku Cloud for MultiversX Price Prediction
The Ichimoku Cloud is like a weather forecast for the MultiversX market, offering a glance at potential support and resistance levels, trend direction, and momentum all at once. With its five lines weaving a tapestry across the price chart, the cloud (or ‘Kumo’) can indicate bullish scenarios when the price is above it and bearish scenarios when the price falls below.
Example: If you’re eyeing EGLD and notice it’s breaking through the top of the cloud, it’s akin to the market breaking into a clear, sunny day, suggesting a strong buying signal. Conversely, if EGLD dips below the cloud, it might be like a storm warning, indicating it’s time to batten down the hatches or consider your exit strategy.
Fibonacci Retracement for MultiversX Price Prediction
Fibonacci Retracement is like the market’s way of taking a breather on its marathon run. By drawing lines at key Fibonacci levels (like 23.6%, 38.2%, 61.8%), traders can identify potential reversal points based on past price movements. It’s a favorite for spotting where the market might pause or reverse, offering a strategic map for entry and exit points.
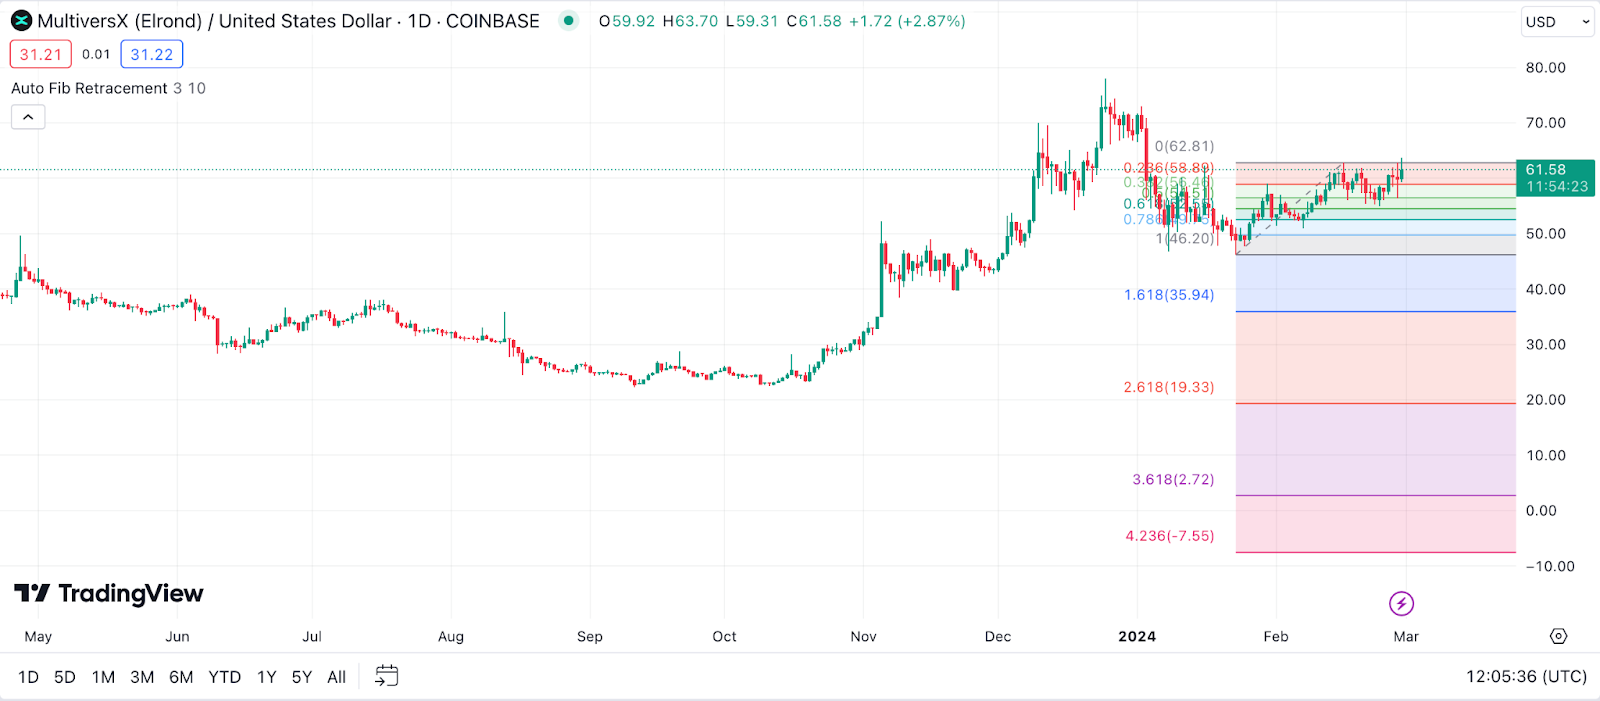
Example: Imagine EGLD has had a nice run-up and starts to pull back. You plot the Fibonacci levels and notice it’s retracing to the 61.8% level, a golden zone. This could be the market’s way of catching its breath before running again, signaling a potential spot to jump in if you believe in EGLD’s continued upward trajectory.
Average Directional Index (ADX) for MultiversX Price Prediction
The Average Directional Index (ADX) is like the compass for navigating the strength of the market’s trends. With its scale from 0 to 100, a higher ADX value indicates a stronger trend, whether it’s up or down. It’s particularly useful for distinguishing between trending and range-bound markets, helping traders to adjust their strategies accordingly.
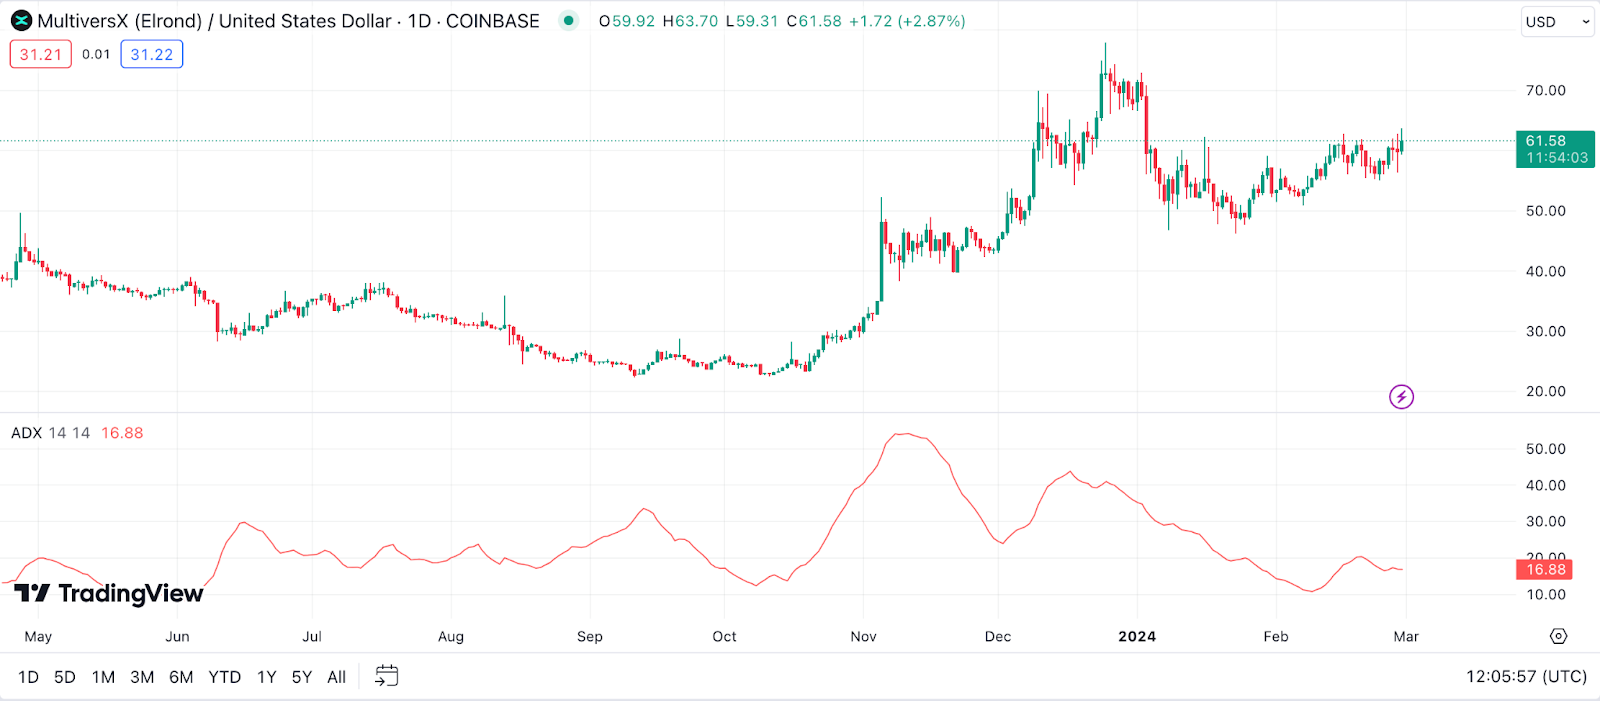
Example: If you’re tracking EGLD and the ADX starts creeping above 25, it’s like the market’s pulse is quickening, signaling a strong trend is in place. Whether it’s pointing up or down, this could be your cue to strap in and ride the trend, or to be cautious and tighten your stops, depending on your market position and strategy.
On Balance Volume (OBV) for MultiversX Price Prediction
On Balance Volume (OBV) acts like a heartbeat monitor for the market, tracking the pulse of trading volume in relation to price movements. It’s a cumulative indicator that adds volume on up days and subtracts on down days, offering insights into the buying and selling pressure behind price trends. A rising OBV suggests strong buyer enthusiasm, while a falling OBV indicates growing selling pressure.
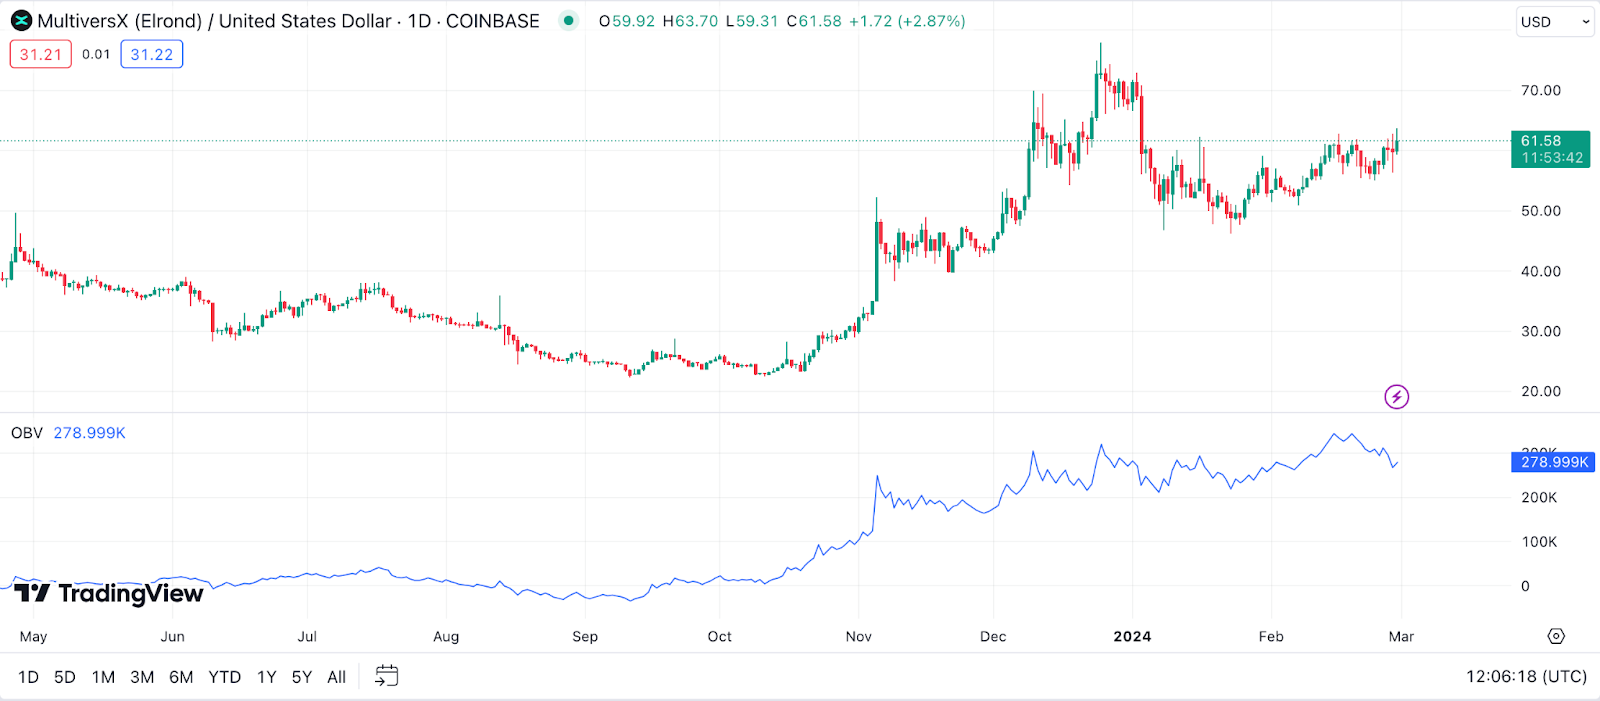
Example: If you notice the OBV for EGLD is on an upward trajectory while the price is also climbing, it’s like the crowd is cheering EGLD on, suggesting a solid foundation for the uptrend. However, if the OBV starts to dip while the price is still rising, it might be a sign that the rally is not as strong as it appears, hinting at potential caution ahead.
Rate of Change (ROC) for MultiversX Price Prediction
Rate of Change (ROC) is like a speedometer for the market, measuring the velocity of price movements over a specific period. It compares the current price to a price “n” periods ago, providing a straightforward indicator of momentum. A rising ROC indicates acceleration in the price, signaling bullish momentum, while a falling ROC suggests a slowdown, indicating bearish momentum.
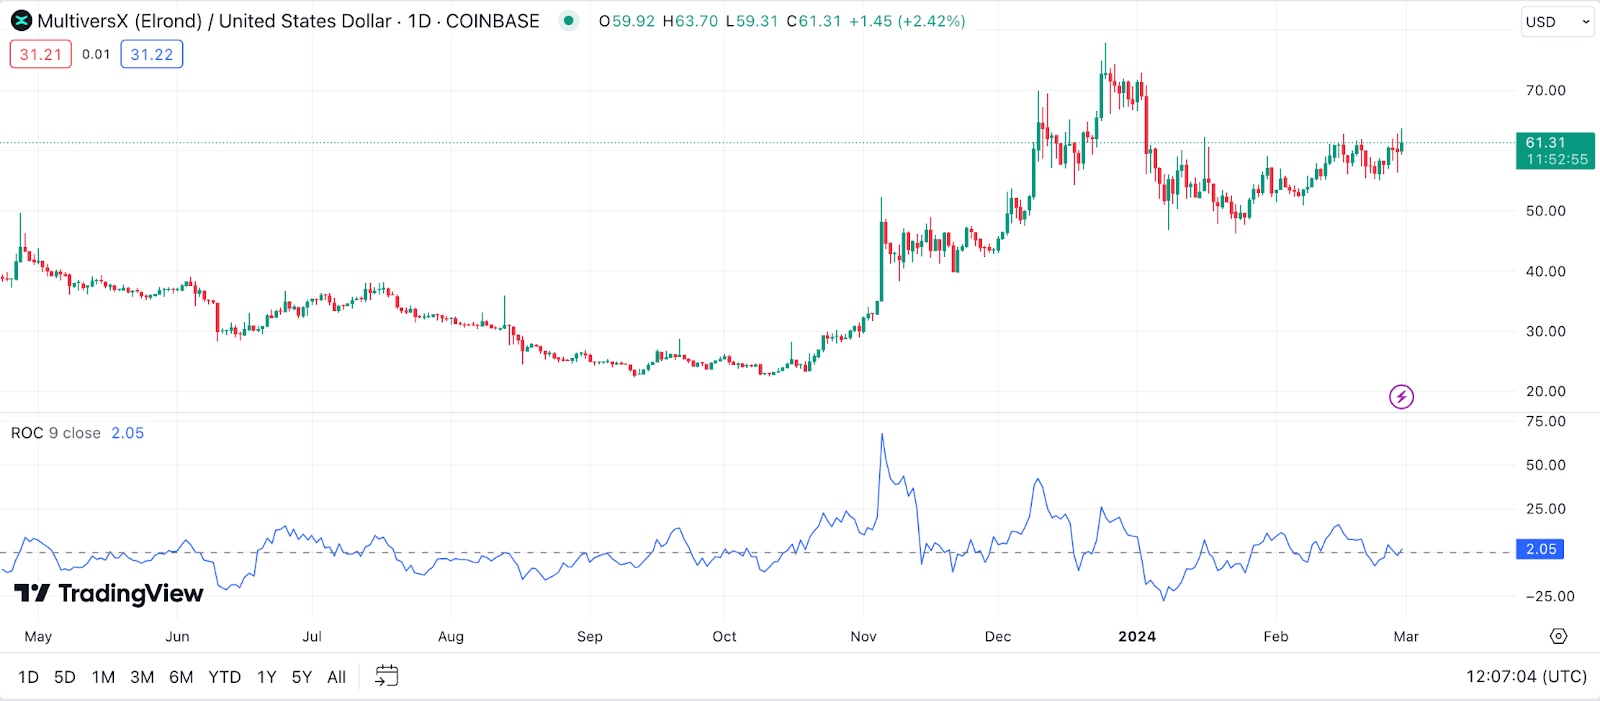
Example: When EGLD’s ROC swings upwards, it’s like the asset is putting the pedal to the metal, potentially signaling a good time to join the ride if you’re bullish on its prospects. Conversely, if the ROC starts to decline, it might be time to ease off the gas and reassess, as it could indicate slowing momentum and possibly a trend reversal.
Commodity Channel Index (CCI) for MultiversX Price Prediction
The Commodity Channel Index (CCI) navigates the price movement of MultiversX relative to its average statistical price over a given period. Acting as a versatile oscillator, the CCI moves above and below zero, highlighting moments of overbought or oversold conditions. Typically, readings above +100 indicate that the price is well above its average, suggesting overbought conditions, while readings below -100 signal oversold conditions.
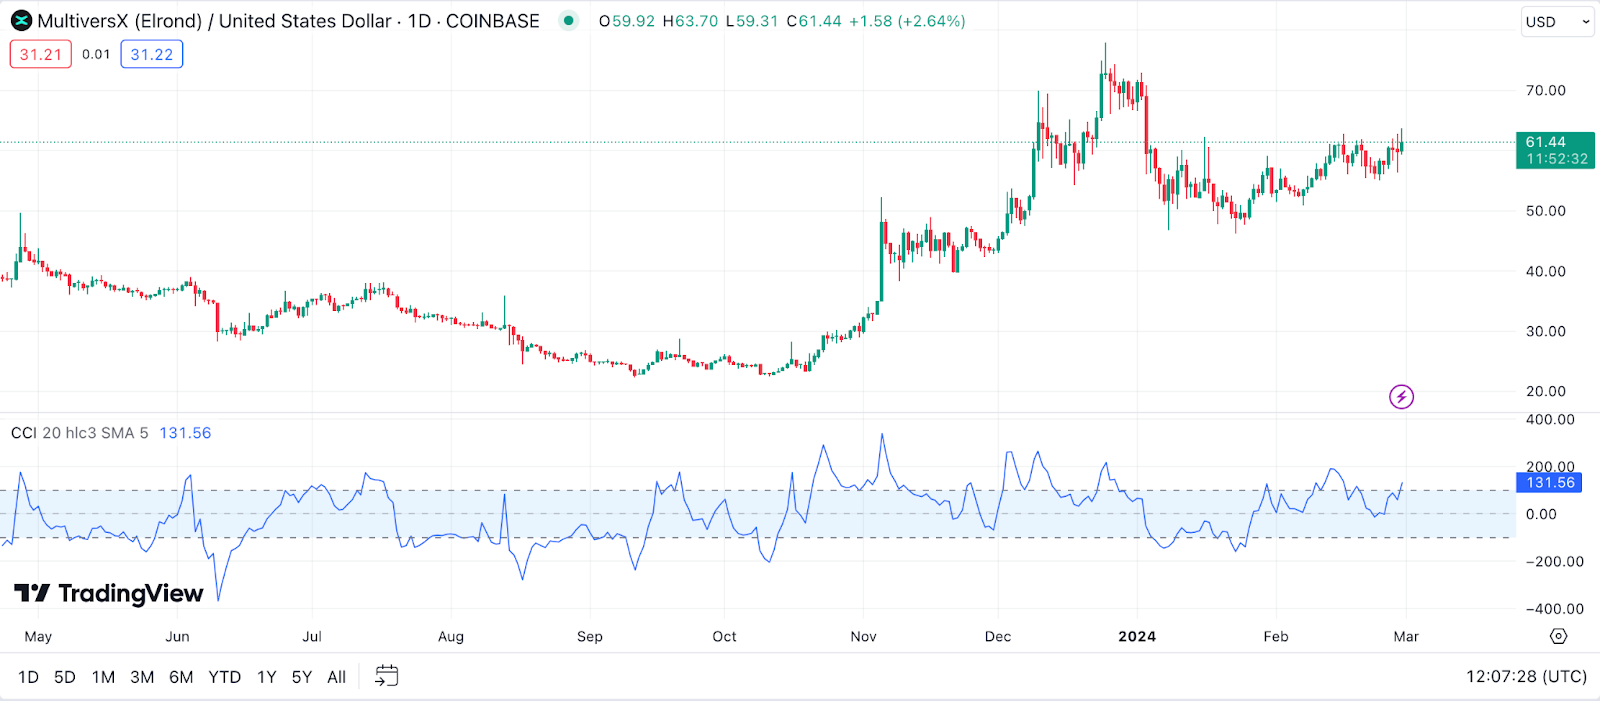
Example: If EGLD’s CCI catapults above +100, it’s like the market is signaling that EGLD might be getting ahead of itself, possibly pointing to a pullback or correction. On the flip side, if the CCI plunges below -100, it could be hinting that EGLD is in the bargain bin, potentially a good pickup point for those bullish on its long-term prospects.
Accumulation/Distribution Line (A/D Line) for MultiversX Price Prediction
The Accumulation/Distribution Line (A/D Line) is like a detective, uncovering the stealthy movements of money in and out of MultiversX. It takes into account both the closing price and trading volume to determine whether MultiversX is being accumulated (bought) or distributed (sold). A rising A/D Line suggests accumulation, indicating strong buyer demand, while a falling A/D Line points to distribution, hinting at selling pressure.
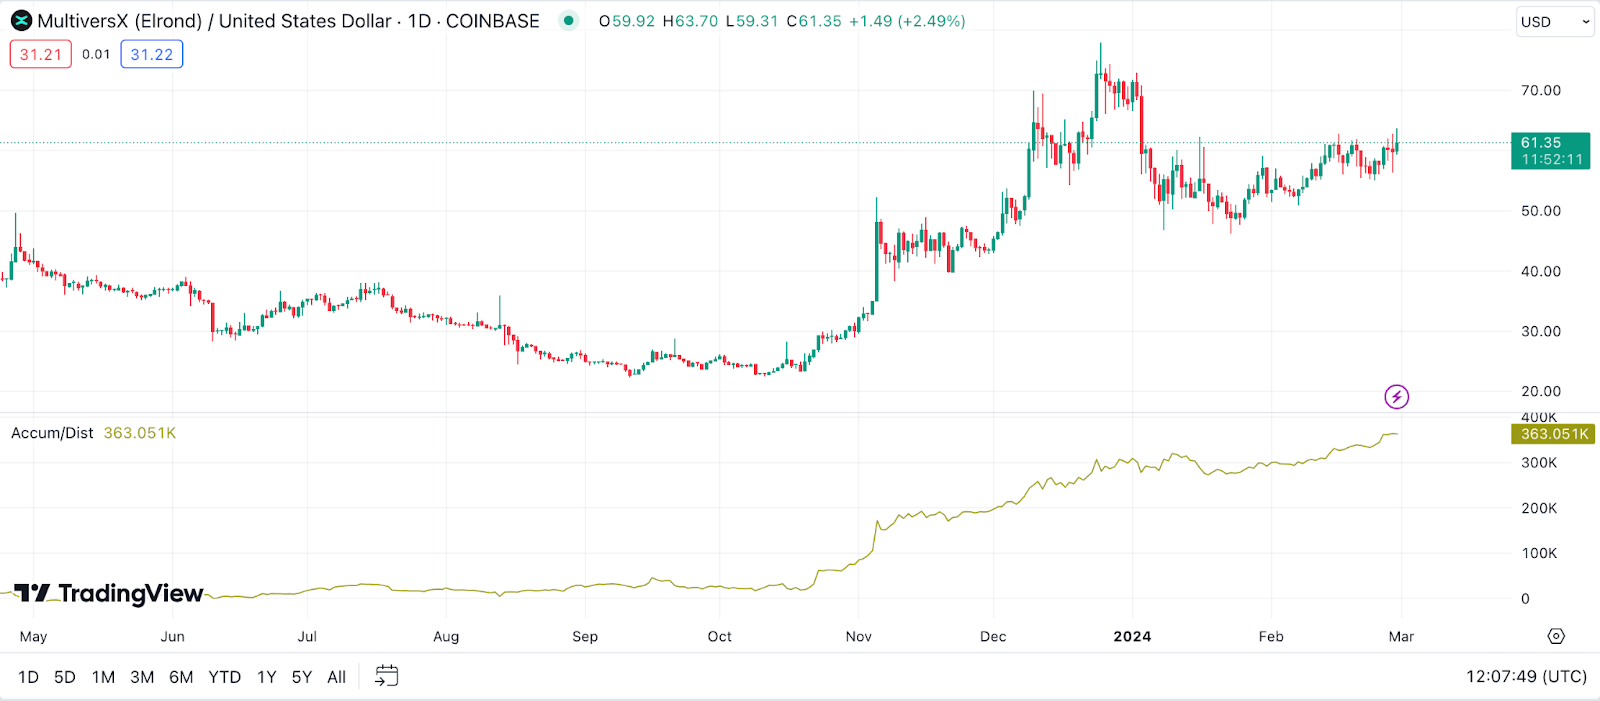
Example: If you see the A/D Line for EGLD trending upwards, it’s like uncovering hidden footsteps leading towards a treasure, suggesting that despite what the price action might indicate, there’s underlying strength as more investors are buying in. Conversely, a downward trend could signal caution, as it might mean investors are quietly heading for the exits.
Pivot Points for MultiversX Price Prediction
Pivot Points serve as the navigational stars for traders, guiding them through the market’s tumultuous seas by providing key levels of support and resistance. These are calculated using the previous period’s high, low, and close prices to predict potential turning points. Traders often watch these levels closely for signs of price reversal or continuation.
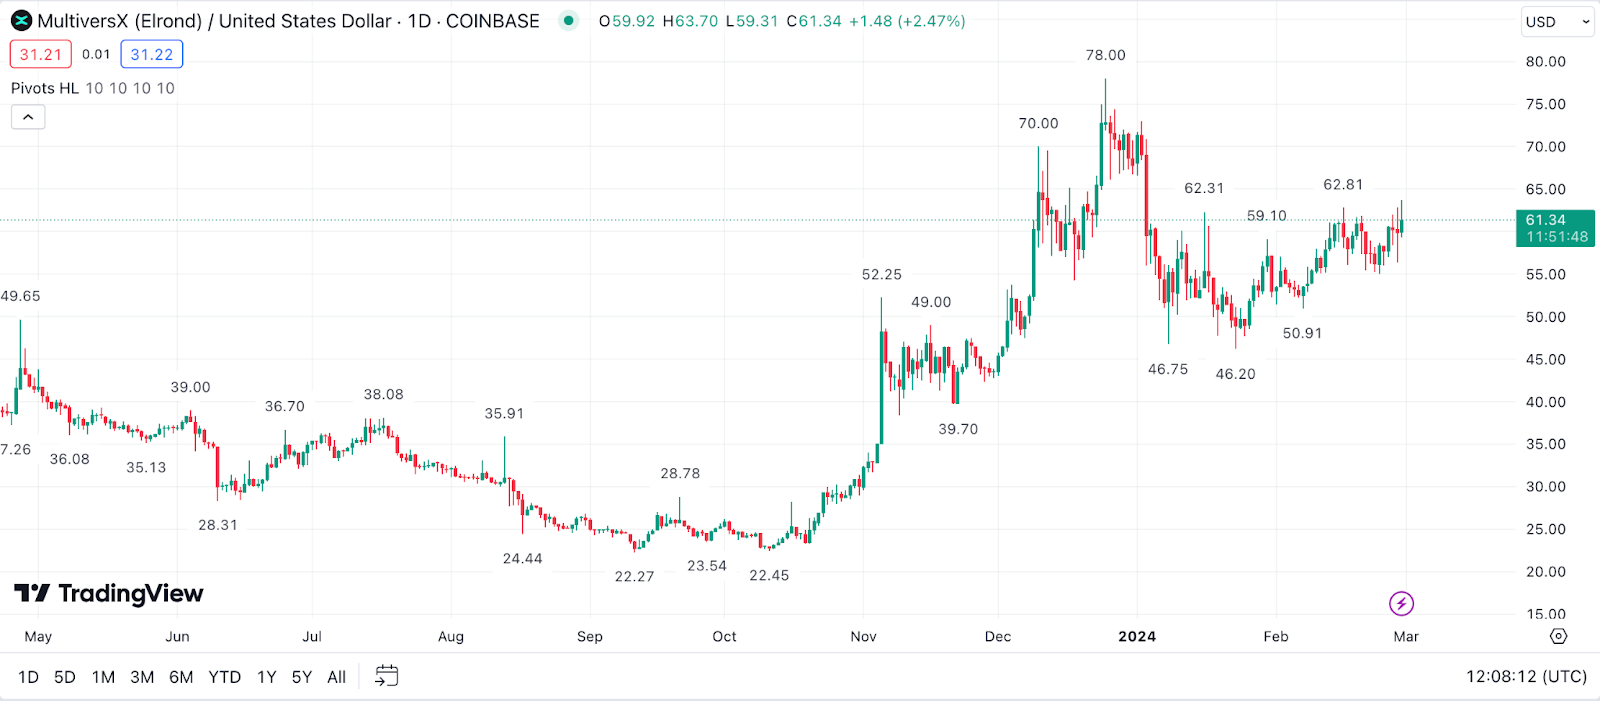
Example: When EGLD’s price approaches a pivot point from below and starts to stall or bounce off, it’s like a signal flare, indicating resistance and potentially a moment to reassess bullish positions. If the price breaks through a pivot point upwards, it could be a green light, suggesting strength and a possible continuation of the uptrend.
Chaikin Money Flow (CMF) for MultiversX Price Prediction
Chaikin Money Flow (CMF) is akin to having a backstage pass to the market, offering a glimpse into the buying and selling pressure behind the curtains. By combining price and volume, the CMF indicates whether MultiversX is under accumulation or distribution over a set period. A positive CMF value suggests buying pressure (accumulation), while a negative value points to selling pressure (distribution).
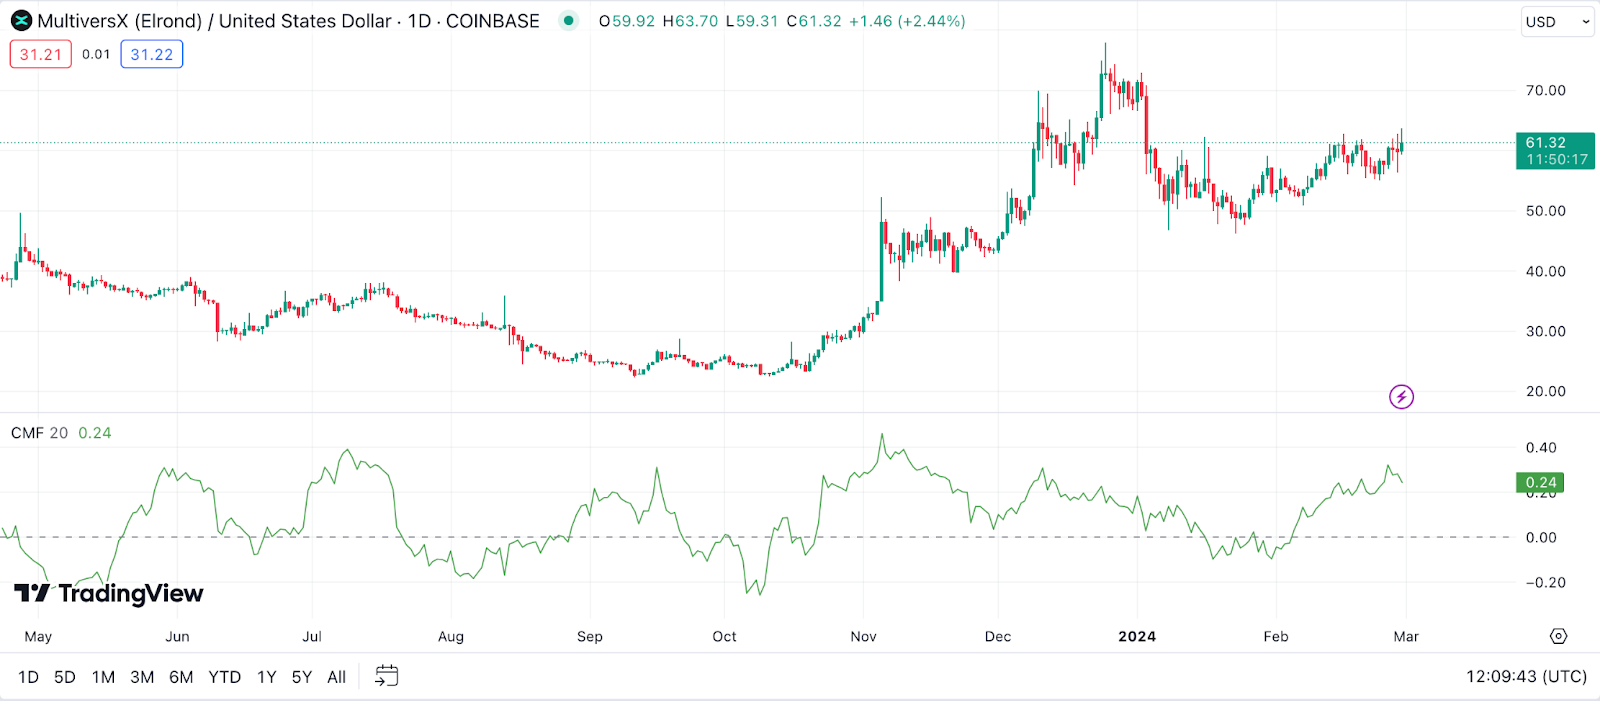
Example: If EGLD’s CMF value hovers above zero for an extended period, it’s like the crowd is chanting in favor, hinting at strong buyer interest and potentially higher prices ahead. On the other hand, a sustained negative CMF could be akin to a silent auditorium, suggesting waning interest and possibly lower prices to come.
Aroon Indicator for MultiversX Price Prediction
The Aroon Indicator acts like a seasoned guide in the realm of technical analysis, adept at pointing out when MultiversX is setting new highs or lows. It consists of two lines: Aroon Up and Aroon Down, each ranging between 0 to 100. A high Aroon Up value indicates a strong upward trend, while a high Aroon Down value signals a strong downward trend. It’s particularly useful for identifying the start of a new trend or the continuation of an ongoing one.
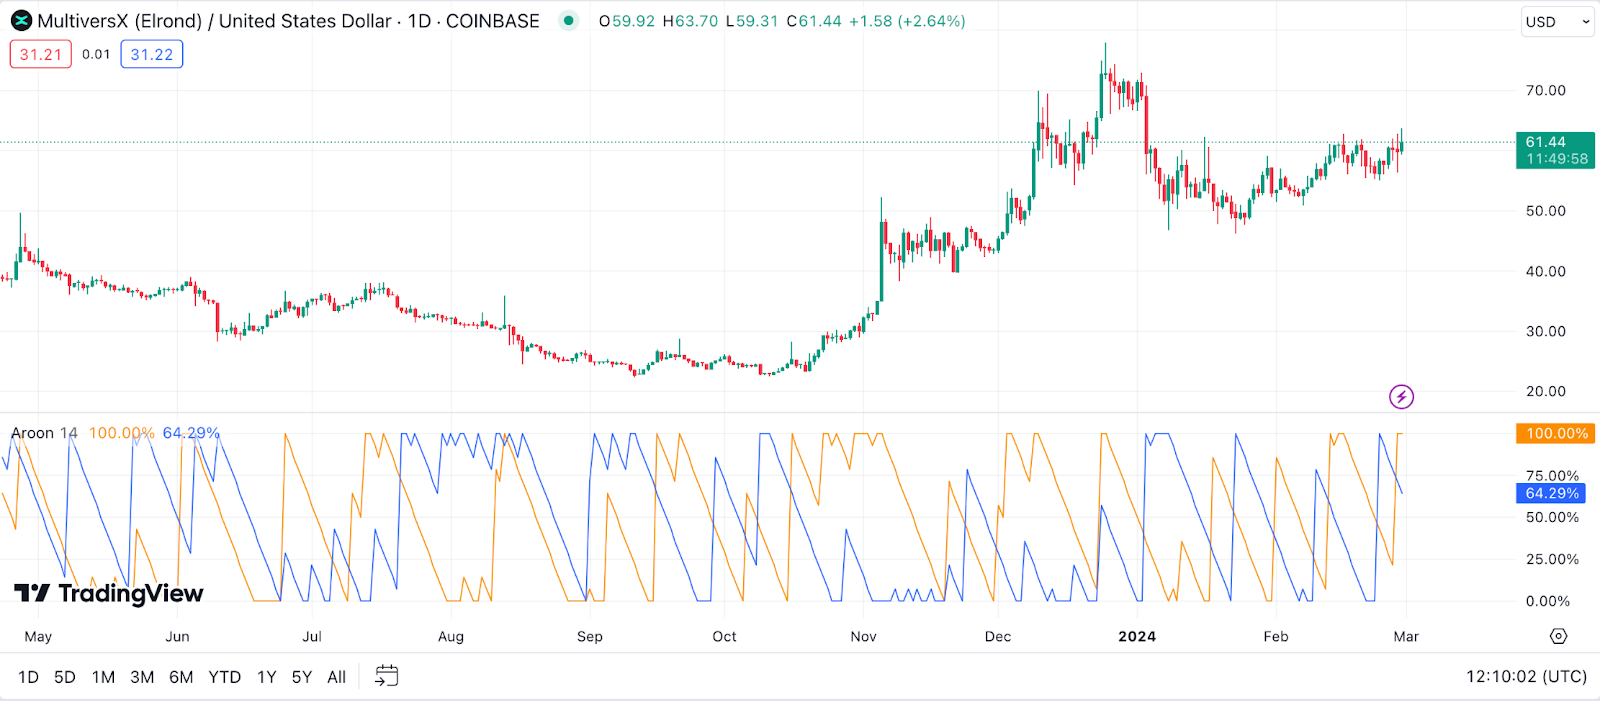
Example: If you notice the Aroon Up line for EGLD soaring above the 70 mark while the Aroon Down line dips, it’s like the market’s way of shining a spotlight on an emerging uptrend, suggesting that EGLD might be gearing up for a rally. This could be a cue to dig deeper and consider EGLD’s potential for growth.
Gann Fan for MultiversX Price Prediction
The Gann Fan is a unique tool that draws from the mystical and the mathematical, overlaying a fan of lines at specific angles over a price chart. These lines represent potential support and resistance levels based on time and price movements. The Gann Fan is rooted in the theory that price and time move in harmony, and by identifying these geometric angles, traders can anticipate key turning points.
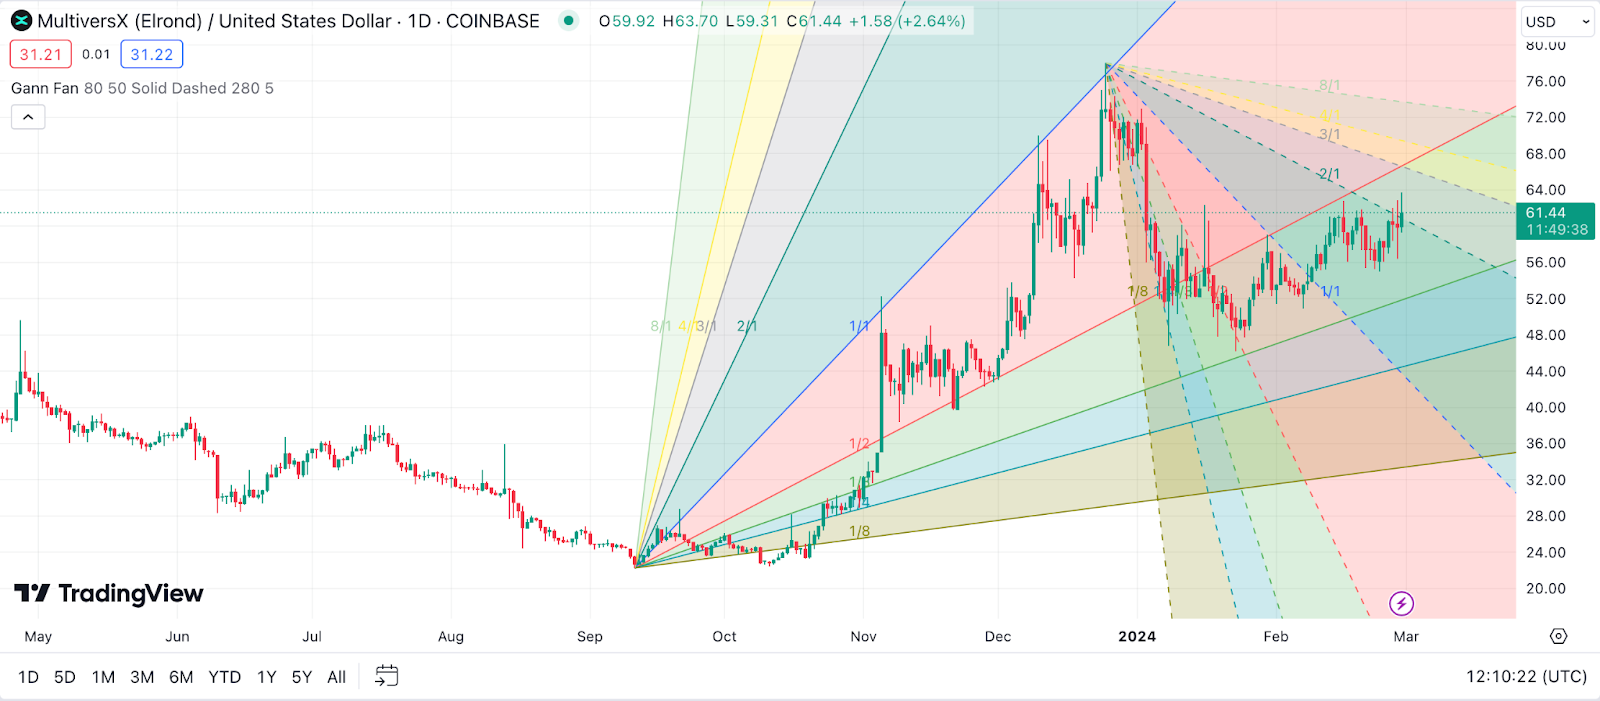
Example: When EGLD’s price intersects with one of the upward Gann Fan lines and holds, it’s akin to finding a hidden path in a maze, suggesting support and potential upward momentum. Conversely, if EGLD breaks through a downward fan line, it might be signaling resistance and potential downward pressure, guiding your investment decisions accordingly.
Keltner Channel for MultiversX Price Prediction
Keltner Channels envelop the price movement of MultiversX like a river’s banks, guiding its flow and highlighting potential breakout points. Comprising three lines – a central moving average line flanked by two boundary lines set at a distance based on average true range (ATR) – these channels help in identifying the trend’s direction and volatility. A move above the upper channel line indicates bullish momentum, while a drop below the lower line suggests bearish momentum.
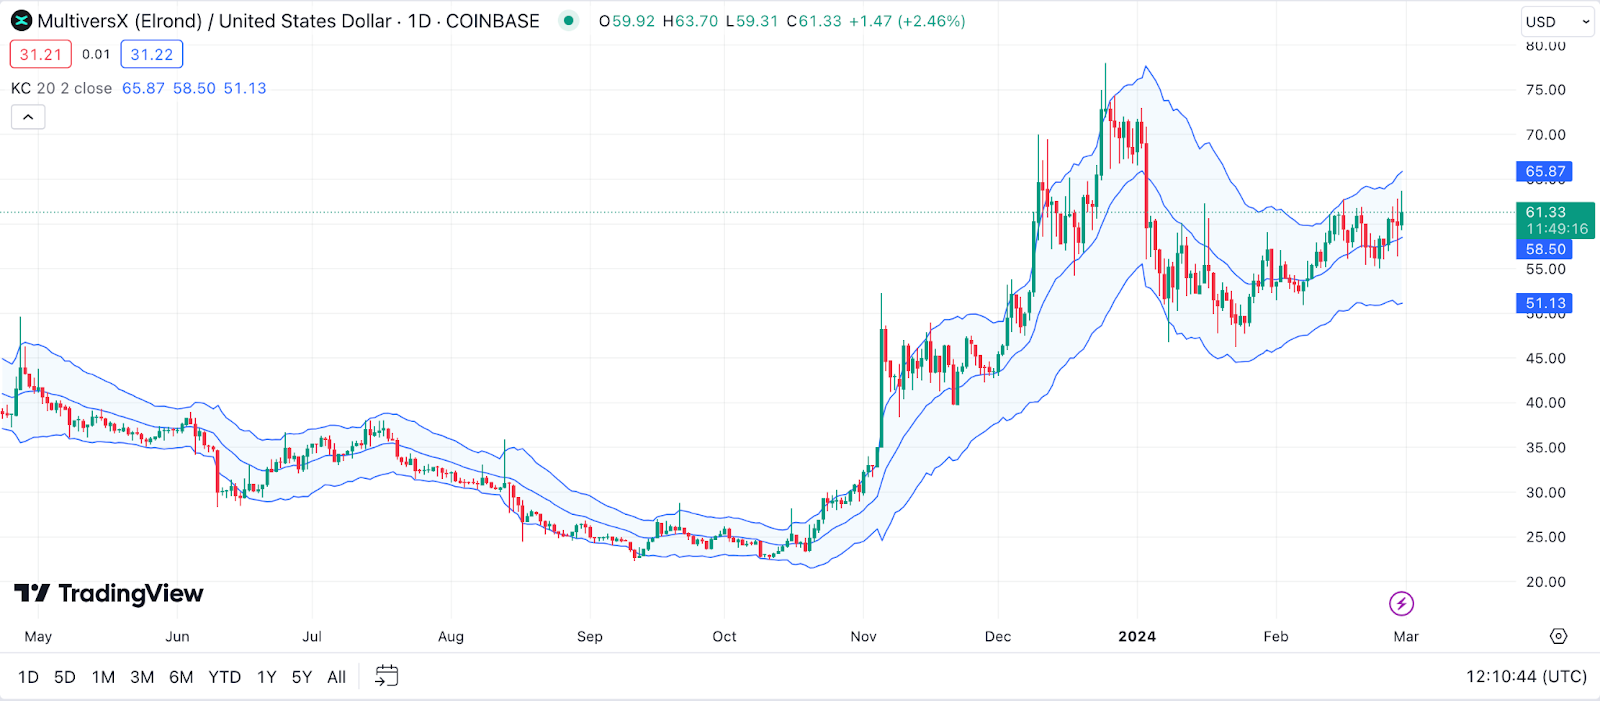
Example: If EGLD’s price starts to consistently push against or even break through the upper Keltner Channel boundary, it’s like a burst of energy propelling a boat downstream, hinting at strong buying pressure and a possible uptrend. On the flip side, if the price frequently touches or falls below the lower boundary, it could be a sign that the tide is turning bearish, potentially signaling a time to reassess your position on EGLD.
Money Flow Index (MFI) for MultiversX Price Prediction
The Money Flow Index (MFI) is like having a financial detective at your side, scrutinizing the flow of money in and out of MultiversX. This indicator combines price and volume to measure the buying and selling pressure. Operating on a scale from 0 to 100, the MFI can signal overbought conditions above 80 and oversold conditions below 20, much like a thermometer gauging the market’s temperature.
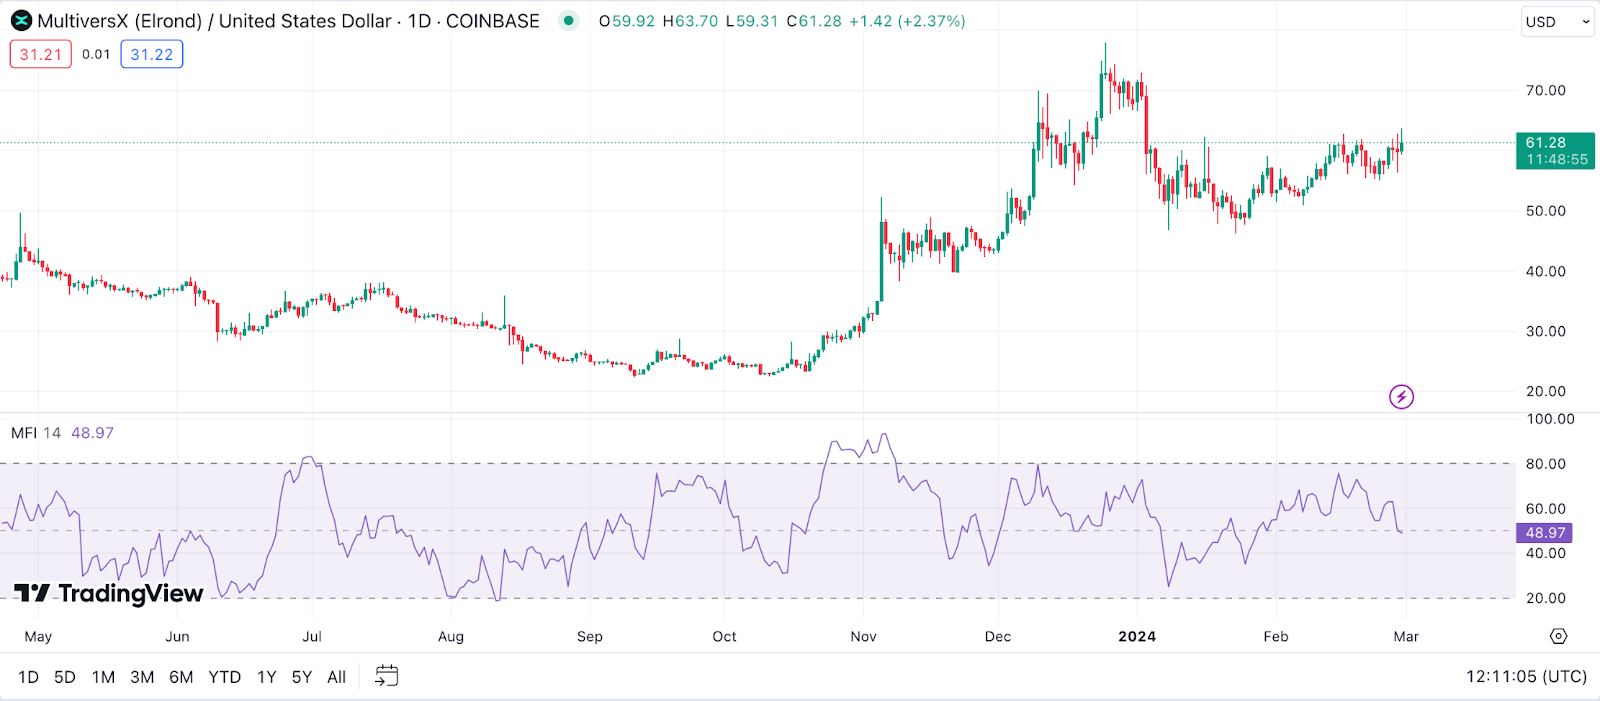
Example: When the MFI for EGLD climbs above 80, it’s akin to a crowded room getting too hot, suggesting that EGLD might be overbought and a cooldown could be on the horizon. Conversely, an MFI reading under 20 might indicate that EGLD is oversold, like a deserted market square that’s too cold, potentially signaling a buying opportunity.
TRIX for MultiversX Price Prediction
TRIX is your smooth operator in the world of technical indicators, filtering out market noise to highlight the core trend of MultiversX’s price. This momentum oscillator shows the rate of change of a triple exponentially smoothed moving average, helping to identify bullish or bearish trends and their strength. When the TRIX line crosses above the zero line, it suggests a bullish trend, and a cross below indicates a bearish trend.
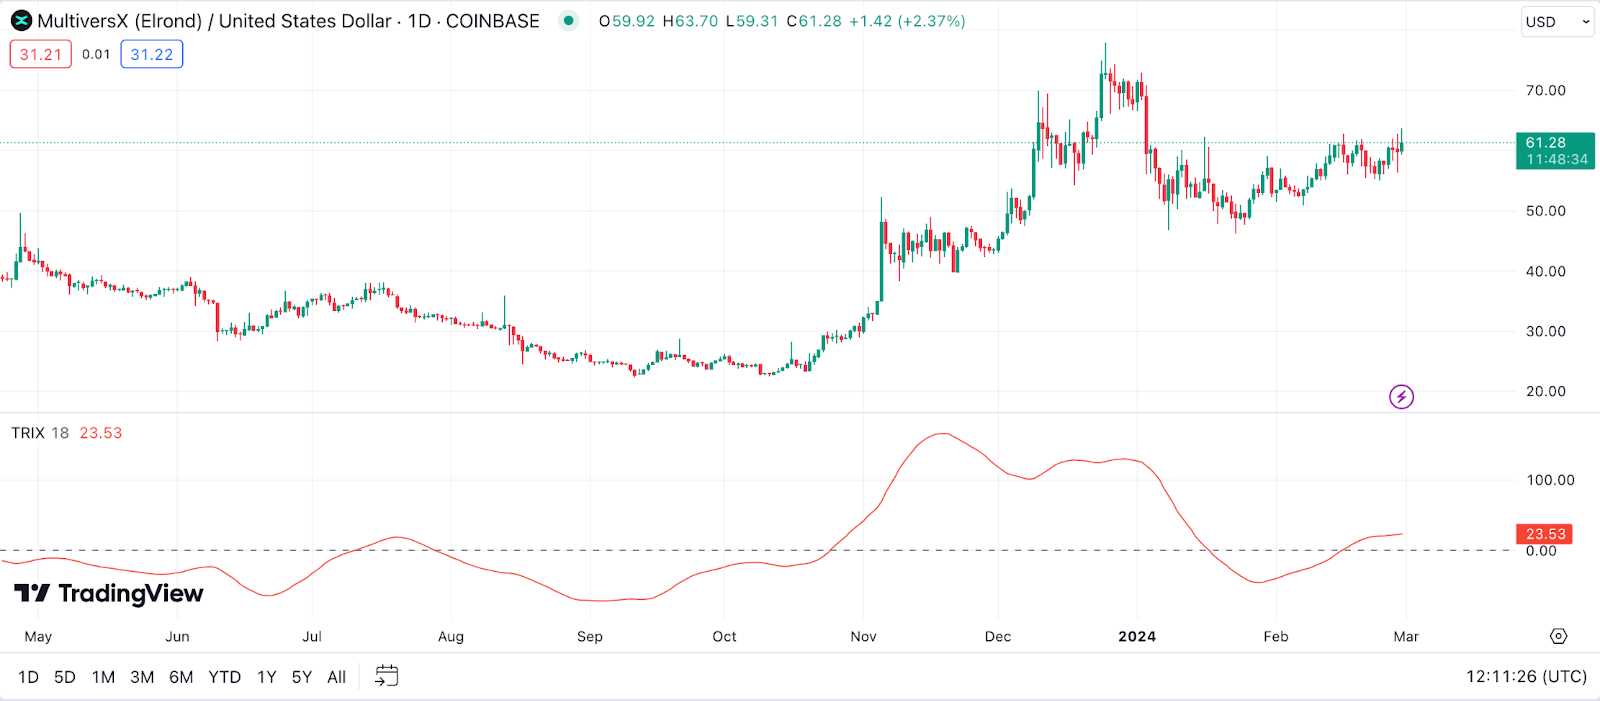
Example: If you see the TRIX line for EGLD making a decisive upward cross through zero, it’s like the moment a plane takes off, signaling that EGLD’s price might be setting up for an upward trajectory. This could be a signal to consider EGLD’s momentum and evaluate it as part of your portfolio.
The Zig Zag indicator for MultiversX Price Prediction
The Zig Zag indicator is like a cartographer mapping out the significant highs and lows of MultiversX’s price journey, stripping away minor fluctuations to reveal the underlying trend. By connecting these pivot points, the Zig Zag provides a clearer picture of where the market has been and where it might be headed, making it easier to spot reversals and continuation patterns.
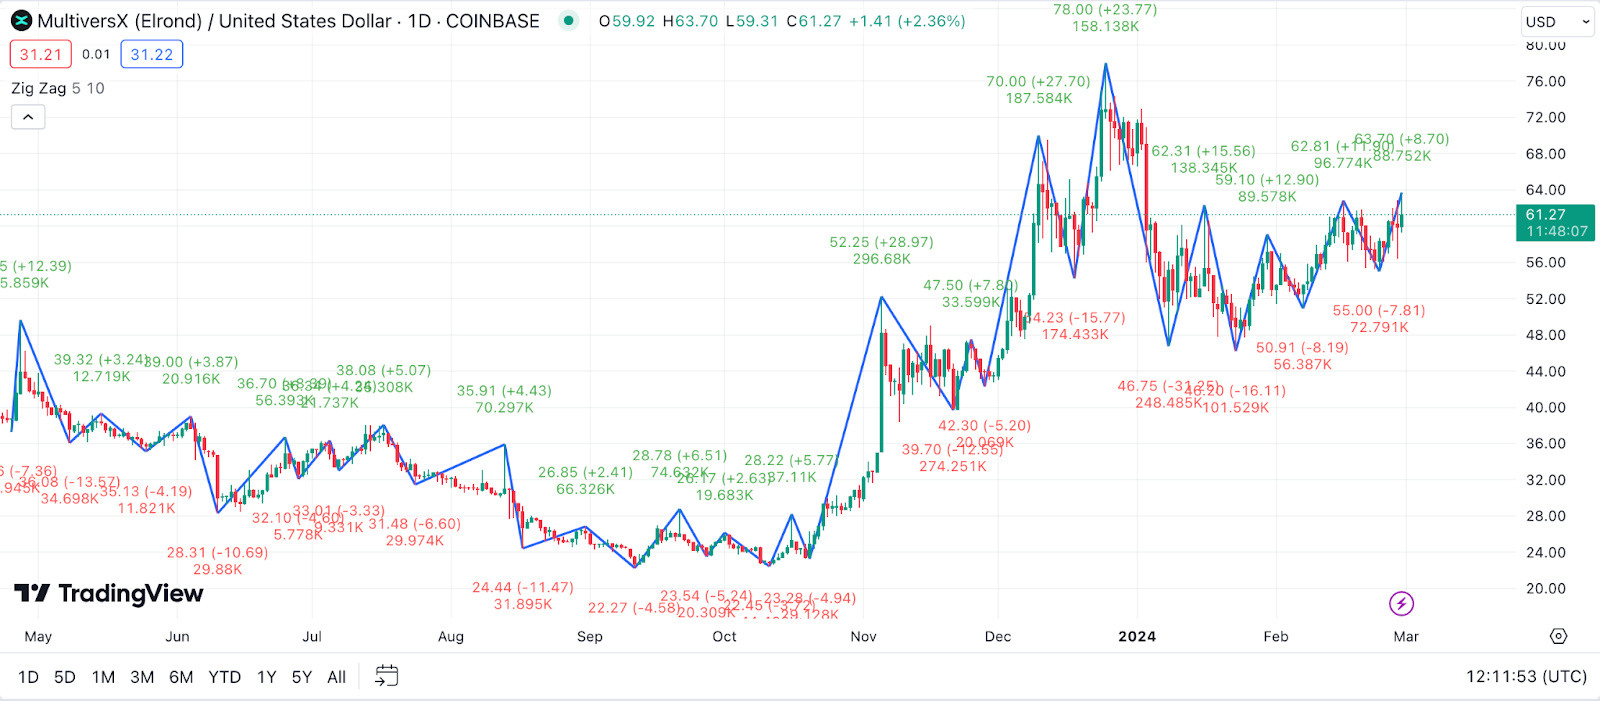
Example: If the Zig Zag lines for EGLD start to form higher lows and higher highs, it’s like watching a mountain range that’s steadily rising, suggesting an upward trend in the making. This visual cue can help you discern the broader market direction amidst the day-to-day price movements, potentially guiding your investment strategy for EGLD.
Detrended Price Oscillator (DPO) for MultiversX Price Prediction
The Detrended Price Oscillator (DPO) is like a time machine for traders, isolating the cyclical movements in MultiversX’s price by eliminating longer-term trends. This oscillator aims to identify the peaks and troughs of price cycles by comparing past prices to a shifted moving average. It’s especially handy for pinpointing the timing of short-term fluctuations without the distraction of overarching trends.
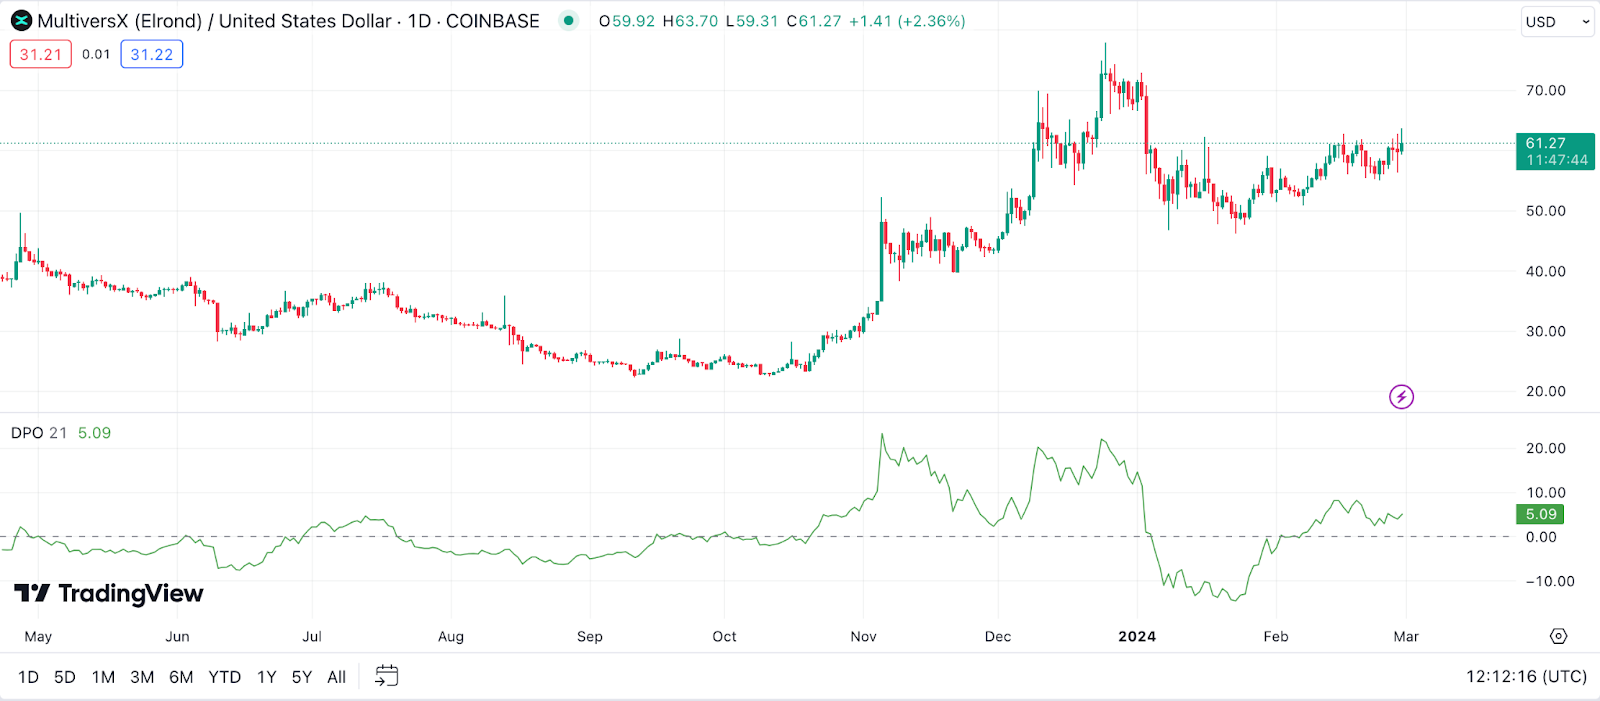
Example: If the DPO for EGLD starts to peak, it’s akin to spotting the crest of a wave before it breaks. This peak might suggest that EGLD is at a short-term high, potentially about to cycle down, offering a cue for timing your trades with the rhythm of the market’s ebbs and flows.
Vortex Indicator (VI) for MultiversX Price Prediction
The Vortex Indicator (VI) whirls into the trading scene like a tornado, capturing the dynamic movements between highs and lows to signal the start of new trends. By comparing the range of current price movements to previous periods, the VI plots two lines: one for upward trend movement (VI+) and one for downward trend movement (VI-). A crossover of these lines can indicate a change in trend direction.
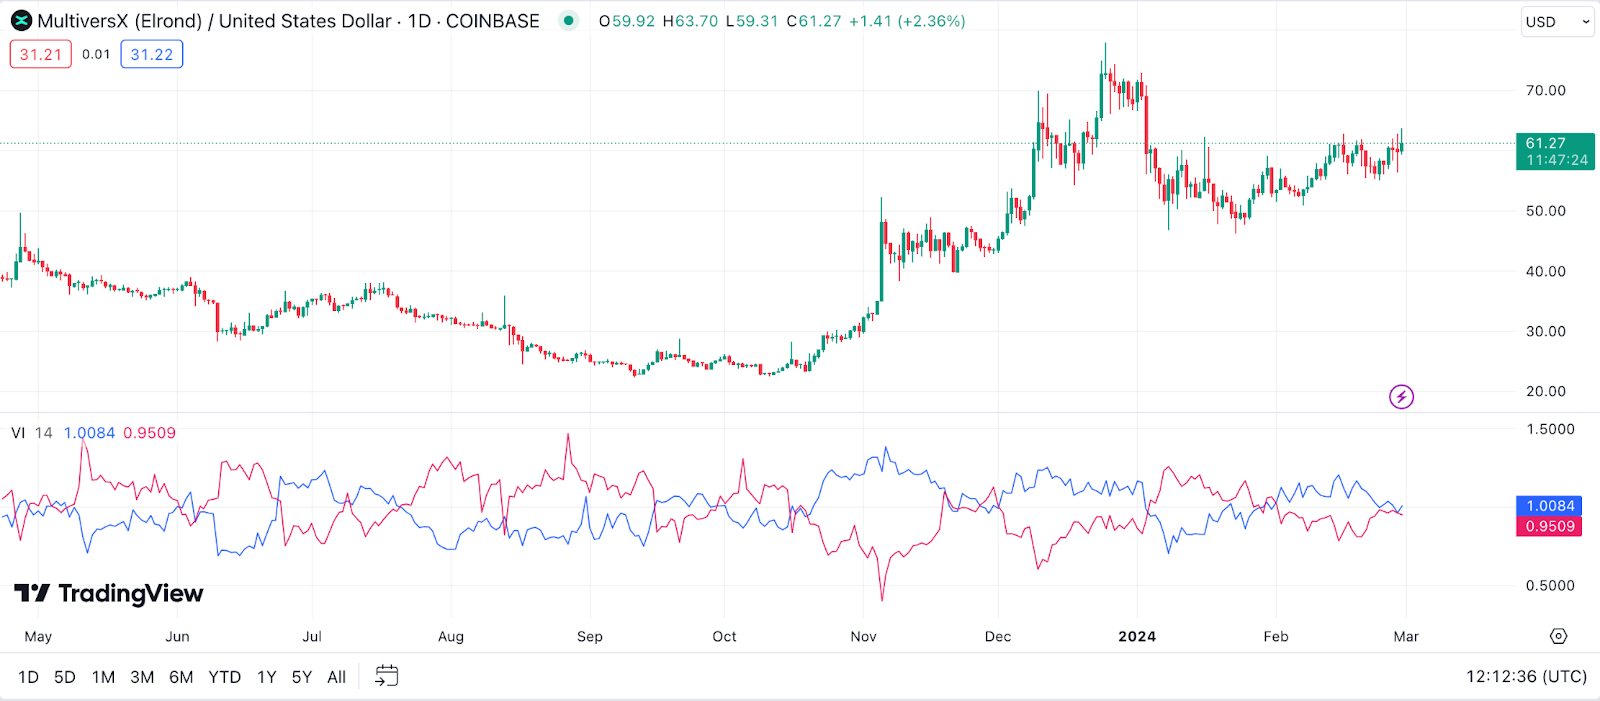
Example: When the VI+ line for EGLD crosses above the VI- line, it’s as if a gust of wind has changed direction, signaling a potential upward trend in the making. This shift could be your signal to take a closer look at EGLD, as it might be gearing up for a climb, offering a strategic point of entry.
Elder’s Force Index (EFI) for MultiversX Price Prediction
Elder’s Force Index (EFI) brings the power of momentum to your trading toolkit, combining price change, direction, and volume to measure the ‘force’ behind MultiversX’s price movements. It’s like feeling the tug of the market’s currents, where a high positive value indicates strong buying pressure, and a high negative value suggests strong selling pressure.
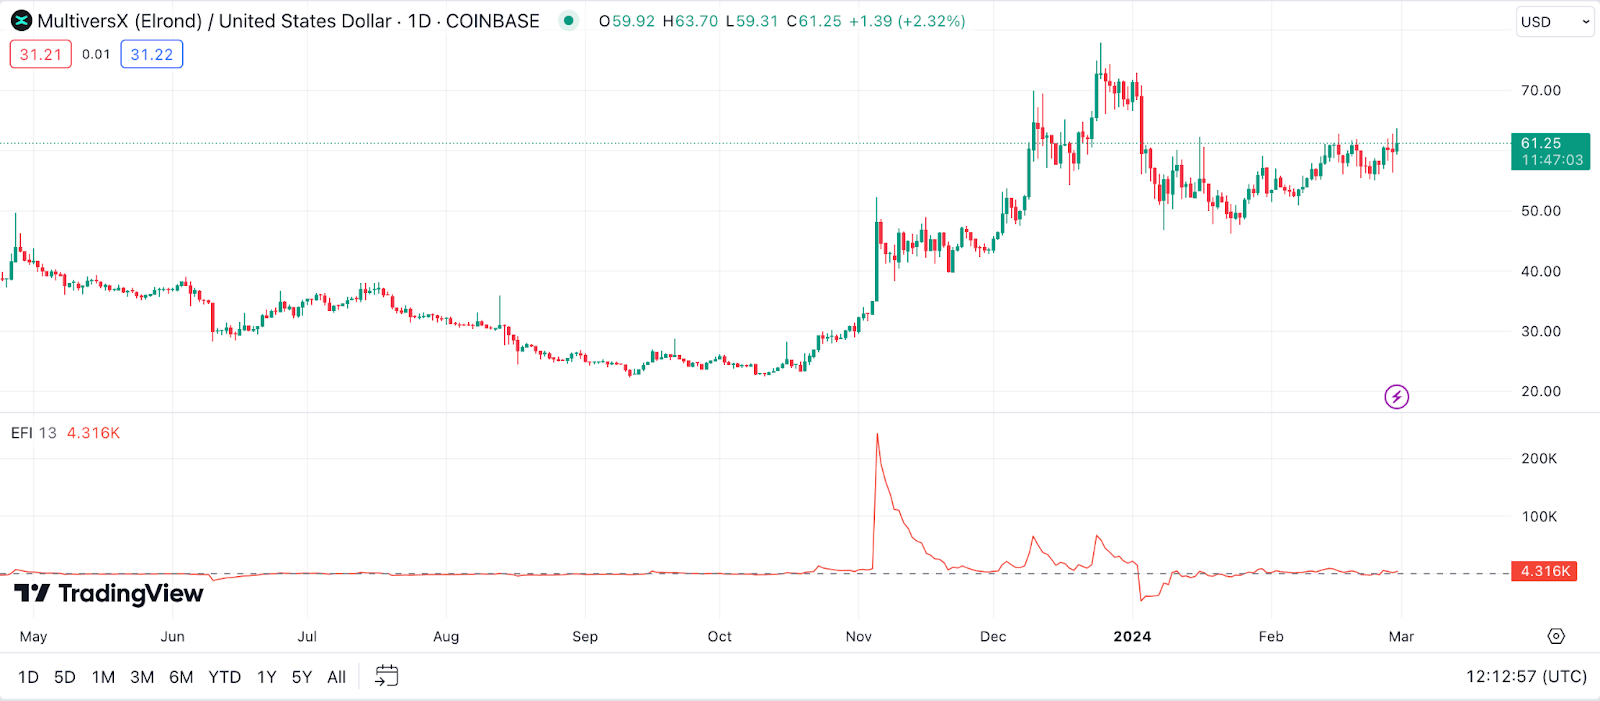
Example: If the EFI for EGLD spikes positively, it’s like sensing a strong undercurrent pulling the market upward, indicating strong buying activity that could drive EGLD’s price higher. This surge in force might suggest an opportune moment to consider EGLD, especially if other indicators align, signaling robust market support for an upward trend.
Williams %R for MultiversX Price Prediction
The Williams %R, often likened to a high-speed roller coaster, offers a thrilling perspective on market momentum, specifically pinpointing overbought and oversold conditions for MultiversX. This momentum indicator oscillates wildly between 0 and -100, where readings above -20 suggest that EGLD is overbought, and readings below -80 indicate it’s oversold. It’s like a gauge for the market’s emotional extremes, highlighting moments of euphoria or panic.
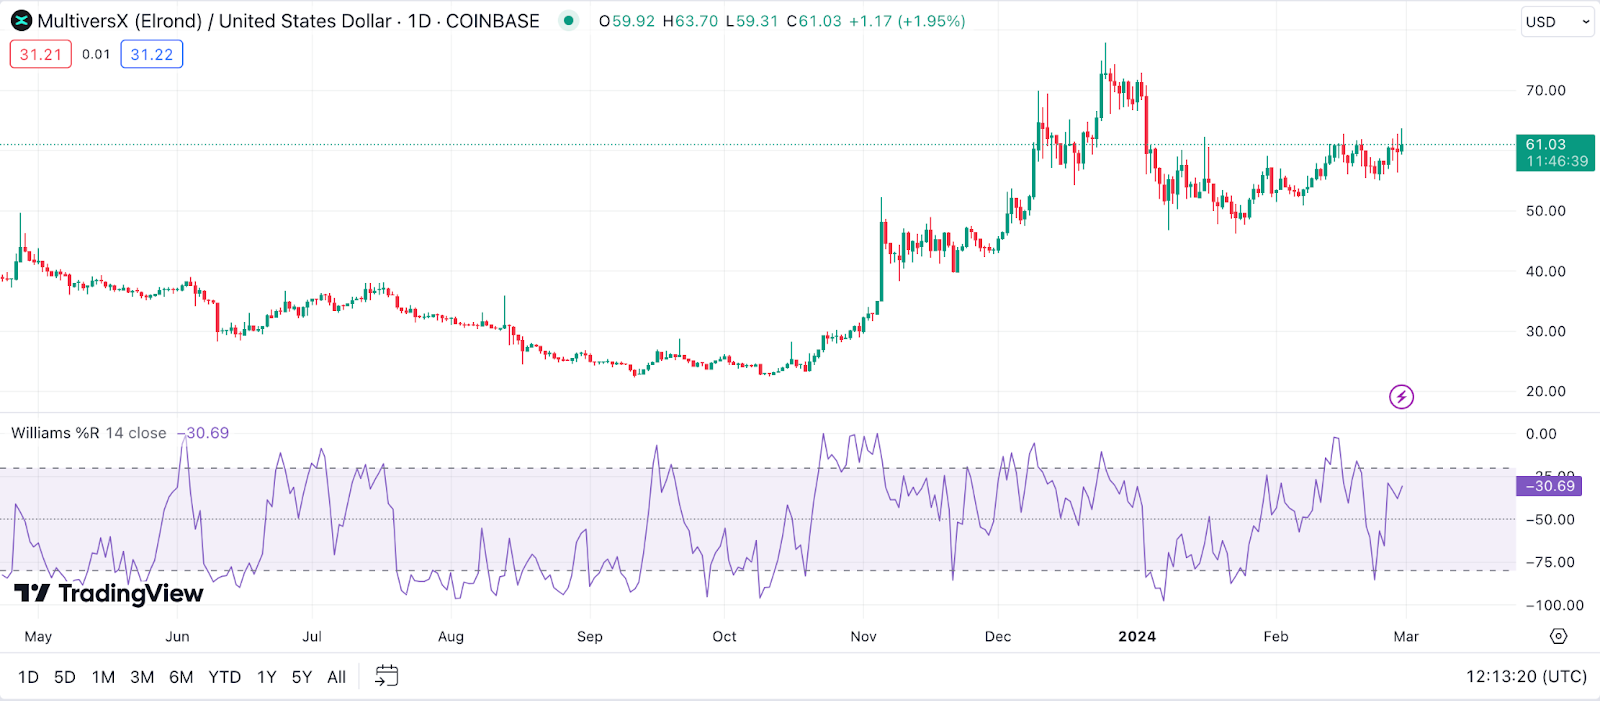
Example: When the Williams %R for EGLD dips below the -80 mark, it’s akin to a diver reaching the ocean’s depths, suggesting that EGLD might be undervalued and potentially ripe for a rebound. This extreme point could signal a buying opportunity, akin to catching a wave just before it swells, offering a strategic entry point for those bullish on EGLD’s future trajectory.
Combining Technical Indicators for Accurate MultiversX Price Prediction
When I first dipped my toes into the vast ocean of cryptocurrency trading, the sheer number of technical indicators available felt like trying to decipher an ancient script. But here’s a nugget of wisdom I picked up along the way: using a single indicator to predict the price of MultiversX (EGLD) is like trying to paint a masterpiece with just one color. It’s the blend that brings out the true picture.
The Importance of Using Multiple Technical Indicators
Let me lay it out straight—relying on just one indicator is a bit like putting all your eggs in one basket and then juggling that basket while riding a unicycle. Sure, it might work for a while, but it’s risky. Each indicator has its strengths and blind spots, so when you start layering them, it’s like suddenly seeing the market in 3D. This approach can help smooth out false signals and provide a more nuanced view of EGLD’s potential price movements.
How to Combine Various Indicators for a Comprehensive Analysis
Now, let’s get into the nitty-gritty of mixing and matching these tools. Here’s a little roadmap I’ve put together based on my own trials and errors:
- Start with Trend Indicators: Kick things off with a broad view. Use something like Moving Averages or the ADX to get a sense of the overall trend. It’s like setting the stage before the main actors come on.
- Layer in Momentum Indicators: Once you’ve got the trend down, it’s time to check the market’s pulse. Tools like the RSI or MACD can show you if EGLD is running hot or cooling off, helping you time your moves.
- Refine with Volume Indicators: Volume speaks volumes. Incorporating indicators like the On Balance Volume (OBV) can give you insights into the strength behind price movements, offering clues about potential reversals or continuations.
- Pinpoint with Oscillators: Now that you’ve got a good lay of the land, use oscillators like Stochastic or Williams %R to identify specific entry and exit points. These can be your signal flags for when it might be time to make a move.
- Don’t Forget Support and Resistance: Tools like Fibonacci Retracement or Pivot Points can help you identify key levels where the price might take a breather or bounce. It’s like knowing where the market’s speed bumps and launch ramps are located.
Remember, the key here isn’t to slap on every indicator you find but to select a few that complement each other. It’s a bit like cooking—a pinch of this, a dash of that, until you find the perfect recipe that suits your taste. And just like in the kitchen, practice makes perfect. So, keep experimenting, keep learning, and most importantly, keep enjoying the ride.
The Pillars of MultiversX Prediction: Fundamental Factors
Navigating the world of MultiversX predictions feels like piecing together a grand cosmic puzzle. Beyond the whirlwind of charts and graphs lies a bedrock of fundamental factors that truly shape EGLD’s journey. Let’s dive into these pillars, shall we?
Adoption Rate
Peering into the adoption rate of EGLD is akin to mapping the growth rings of a sprawling forest, each layer telling a story of expansion and vitality. Here’s where to cast your gaze:
- Developer Activity: The buzz of developers flocking to MultiversX, contributing code, and crafting innovations is a telltale sign of a thriving ecosystem. It’s like watching a city come alive at dawn, bustling with potential.
- Institutional Interest: When big players and institutions start to dip their toes into EGLD, it’s as though the quiet murmur of the crowd turns into a roar of approval, signaling a vote of confidence that can spur wider adoption.
- Mainstream Media Coverage: The spotlight of mainstream media can act as a beacon, drawing in curious onlookers and converting them into participants. It’s the difference between a well-kept secret and a celebrated treasure.
- Global Reach: Expansion into new countries and markets is like planting flags on uncharted territories, each one representing a community of potential adopters and ambassadors for EGLD.
- Educational Resources: The availability and quality of educational materials surrounding MultiversX can lower the barrier to entry, inviting more enthusiasts to join the fold. It’s like opening the doors of a grand library, welcoming all who seek knowledge.
By keeping an eye on these indicators, you can gauge the depth and breadth of EGLD’s adoption. It’s not just about numbers on a chart; it’s about the vibrant tapestry of users, developers, and believers weaving together the future of MultiversX. Each story of adoption adds a thread to this tapestry, enriching its design and strengthening its weave.
Regulatory Developments
Navigating the shifting sands of regulatory landscapes for EGLD is akin to reading the weather patterns before setting sail. The winds of change can either propel the market forward or bring it to a standstill. Here’s what could be on the horizon:
- International Collaboration on Crypto Regulation: When nations start singing from the same hymn sheet on crypto regulation, it’s like a chorus that resonates across the globe. This harmony can either bolster the market with clear, supportive policies or introduce stringent measures that ripple through EGLD’s valuation.
- Central Bank Digital Currencies (CBDCs): The advent of CBDCs could be a double-edged sword. On one hand, they validate the concept of digital currency, potentially lifting boats like EGLD. On the other, they might compete directly, influencing how decentralized cryptocurrencies are perceived and used.
- Securities Classification: If EGLD were to be classified as a security in key markets, it would be akin to a seismic shift, altering everything from regulatory compliance to investor base. It’s like a game where the rules suddenly change, affecting how players make their moves.
- Decentralized Finance (DeFi) Scrutiny: As DeFi platforms burgeon, the regulatory lens might zoom in, especially on those intertwined with EGLD. It’s as if a magnifying glass were held to the intricate workings of a clock, with each cog (DeFi platform) undergoing inspection for its role in the larger mechanism.
- Privacy and Security Regulations: In an era where data is king, regulations focusing on privacy and security could shape how EGLD and its associated platforms operate. It’s like setting the boundaries of a playground, defining what’s safe and what’s off-limits.
Keeping a pulse on these developments is crucial. It’s about reading the tea leaves, understanding not just the letter of the law but the spirit behind it, and how it could sculpt the landscape in which EGLD thrives or faces challenges.
Utility
Exploring the utility of EGLD is like uncovering the layers of an ancient city, each stratum revealing new functions and purposes that cater to its inhabitants’ needs. Here’s a deeper dive into the practical magic EGLD brings to the table:
- Smart City Initiatives: Imagine EGLD at the heart of smart cities, facilitating everything from utility payments to public services. It’s like embedding the currency with superpowers that extend its reach into the very fabric of daily life, making transactions seamless and efficient.
- Supply Chain Solutions: By leveraging EGLD in supply chain logistics, companies can ensure transparency and traceability from manufacturer to consumer. It’s akin to having a crystal clear stream where every droplet’s journey is known, enhancing trust and efficiency in the process.
- Gaming and Esports: In the realm of gaming and esports, EGLD could serve as the backbone for in-game economies, enabling secure, instant transactions and true ownership of digital assets. It’s like turning virtual worlds into thriving economic hubs, where every item and achievement has real-world value.
- Tokenization of Assets: EGLD could revolutionize how we own and trade assets by facilitating the tokenization of everything from real estate to art. This is akin to breaking down the walls of traditional marketplaces, allowing pieces of the world to be owned and traded on the blockchain.
- Decentralized Autonomous Organizations (DAOs): With EGLD, DAOs can flourish, enabling communities to govern themselves transparently and efficiently without centralized control. It’s like witnessing the birth of digital democracies, where every voice has the power to shape the future.
The utility of EGLD is only limited by the imagination. It’s about peeling back the layers to reveal a core of endless possibilities, where each use case adds another dimension to its value, painting a picture of a future where EGLD is interwoven into the very tapestry of society.
Market Sentiment: How EGLD News Prediction Works
Tuning into the market sentiment around EGLD is akin to listening to the heartbeat of a vast, interconnected community. It’s about capturing the collective mood, where each whisper, shout, and murmur contributes to the overarching narrative. Here’s how to keep your finger on the pulse:
- Algorithmic Sentiment Analysis: In today’s digital age, algorithms sift through terabytes of data, from tweets to blog posts, analyzing the sentiment toward EGLD. It’s like having a supercomputer decoding the global conversation, turning abstract feelings into actionable insights.
- Investor Surveys and Polls: Sometimes, going straight to the source is best. Surveys and polls among the EGLD community can offer a direct line to the investors’ thoughts and feelings, providing a snapshot of the prevailing sentiment. It’s akin to gathering the tribe around a campfire, sharing stories and gauging the collective spirit.
- Trading Volumes and Liquidity Fluctuations: Beyond words, actions speak volumes. A surge or drop in trading volumes can be a tangible measure of sentiment, reflecting the community’s eagerness or hesitation to engage with EGLD. It’s like watching the tides, where the ebb and flow of the sea mirrors the traders’ confidence or caution.
- Technical vs. Fundamental Analysis Debate: The ongoing debate between technical and fundamental analysts can itself be a barometer of market sentiment. When one side gains the upper hand in the conversation, it might indicate a shift in market perspective, like witnessing the scales of justice tilt in favor of one argument over another.
- Global Economic Indicators: Sometimes, the sentiment toward EGLD is a reflection of the broader economic climate. Turbulence or tranquility in global markets can sway sentiment, much like the weather can influence the mood of a city. It’s about seeing EGLD not in isolation but as part of a larger ecosystem, where external pressures shape internal perceptions.
By weaving together these threads, you can begin to understand the complex tapestry of market sentiment surrounding EGLD. It’s not just about what’s being said, but also who’s saying it, how loudly they’re speaking, and the context in which they’re speaking. This holistic approach allows you to navigate the nuanced landscape of EGLD sentiment, armed with a deeper understanding of the forces at play.
The Bottom Line: Making Your Own MultiversX Price Predictions
Wrapping up our deep dive into the swirling currents of MultiversX price prediction, it’s been quite the journey, hasn’t it? We’ve huddled with the experts, deciphered the cryptic messages of technical charts, and sifted through the sands of fundamental factors. It’s like we’ve been on an epic quest, gathering pieces of an ancient map that leads to treasure.
But remember, in this vast ocean of crypto, the winds can shift at a moment’s notice. So, take these insights as your compass, but navigate with your eyes wide open, your mind sharp, and your instincts tuned to the whispers of the market. Here’s to charting your course in the ever-unpredictable, ever-fascinating world of MultiversX.
FAQ
When Will EGLD Go Up?
Ah, the million-dollar question! If I had a crystal ball, I’d be sipping mojitos on a yacht. But here’s the deal: EGLD’s price movement, like any cryptocurrency, is a dance with market dynamics, news, and investor sentiment. Keep an eye on adoption trends, technological advancements within the MultiversX ecosystem, and the broader crypto market’s health. It’s all about timing and trends, so stay informed and ready to ride the wave when it comes.
Should I Buy EGLD?
Deciding to buy EGLD is a bit like choosing a new adventure novel. You’ve got to look at the cover, read the synopsis, and maybe check out a few reviews. In crypto terms, this means doing your homework on EGLD’s fundamentals, current market conditions, and your own investment strategy. Remember, every investment carries risk, especially in the volatile world of crypto, so never invest more than you can afford to lose.
How High Can EGLD Go?
Predicting the peak of EGLD is like guessing the highest note a singer can hit during a live performance. There are historical highs and expert analyses to consider, but the crypto market’s inherent volatility makes precise predictions tricky. Factors like network upgrades, adoption rates, and the overall market environment play significant roles. Keep an eye on these indicators, and who knows? You might just be in for a pleasant surprise.
Will EGLD Crash Again in 2024?
Talking about crashes in crypto is like discussing plot twists in a thriller novel; they’re unexpected but part of the narrative. While it’s impossible to say for certain if EGLD will face a downturn in 2024, it’s wise to prepare for all scenarios in the crypto market. Diversify your portfolio, keep abreast of market trends, and remember that the crypto journey is more of a roller coaster than a calm canal ride. Stay strapped in, and don’t let the dips throw you off course.