Hello, dear readers! Today, we embark on an intriguing journey through the realm of Kaspa Price Prediction for the years 2024-2030, focusing on the KAS forecast. Predicting the price movements of cryptocurrencies like KAS is no small feat, given their notorious volatility and the myriad factors influencing their market behavior. Hence, our exploration today delves deep into the annals of Kaspa’s history, tracing its origins and the core purpose that drives its existence. We’ll unravel the methodologies and the arsenal of tools that seasoned traders and analysts employ to chart the possible trajectories of KAS value.
Understanding the nuances of KAS price prediction is more than just a speculative endeavor; it’s about grasping the potential future of this digital asset within the broader tapestry of the cryptocurrency market. The significance of such forecasts lies in their ability to guide investment decisions, shape market strategies, and provide insights into the evolving dynamics of the crypto ecosystem.
Why is it so crucial to get a handle on where KAS might be heading in the coming years, you ask? The answer is twofold: for one, it helps investors and enthusiasts alike to make informed decisions, aligning their moves with their financial goals and risk appetites. Moreover, it offers a glimpse into the technological and economic potential that Kaspa embodies, shedding light on its role in shaping the future of digital transactions and blockchain innovation.
So, I warmly invite you to dive into this article with an open mind and a keen sense of curiosity. Together, let’s peel back the layers of complexity surrounding KAS price predictions and uncover the insights that could chart the course for future investments and innovations in the crypto space. Join me on this fascinating exploration, and let’s decode the future of Kaspa together!
Kaspa (KAS) Overview
| KAS Price | $0.0744 |
| KAS Price Change 24h | -2.91% |
| KAS Price Change 7d | -2.73% |
| KAS Market Cap | $1,961,968,314.54 |
| KAS Circulating Supply | 26,387,862,135.25 |
| KAS Trading Volume | $80,628,505.92 |
| KAS All-Time High (ATH) | $0.154 |
| KAS All-Time Low (ATL) | $0.0001699 |
A Brief History: Kaspa and Its Purpose
Diving into the world of Kaspa, we’re peeling back the layers of a digital currency that’s as enigmatic as it is promising. At its core, Kaspa isn’t just another name in the vast sea of cryptocurrencies; it’s a beacon of innovation, designed to push the boundaries of what we perceive as the norm in blockchain technology.
Born from a desire to overcome the limitations of existing blockchain infrastructures, Kaspa emerged as a solution aiming for unprecedented scalability, speed, and security. It’s a project that whispers the future of decentralized finance, offering a glimpse into a world where transactions are not just fast, but instantaneous, and where scalability issues are a thing of the past.
Kaspa’s purpose is as bold as its technological foundation. It seeks to democratize financial transactions, making them accessible, efficient, and, above all, inclusive. In a digital age where speed is synonymous with success, Kaspa aims to be the linchpin that ensures no one is left behind in the financial revolution. It’s not just about creating a cryptocurrency; it’s about crafting an ecosystem that fosters innovation, supports growth, and champions the decentralization of power in the financial world.
Significant Fluctuations in KAS Price
The journey of KAS value is akin to a thrilling roller coaster ride, marked by significant peaks and troughs that outline its volatile nature. Here are some of the most memorable fluctuations in KAS coin’s price:
- A remarkable surge in early 2021, setting new benchmarks for its market cap.
- Unexpected dips following regulatory announcements, reflecting the sensitivity of crypto markets to policy changes.
- Recovery phases, where KAS demonstrated resilience, bouncing back from lows with promising growth trajectories.
- Periods of stagnation, offering a breather and a time for reflection within the community.
Kaspa – KAS Price Prediction For Today, Tomorrow, This Week, and Next 30 Days
| Date | Price | Change |
|---|---|---|
| July 02, 2025 | 0.0744 | 0.01% |
| July 03, 2025 | 0.0742 | -0.24% |
| July 04, 2025 | 0.0742 | -0.04% |
| July 05, 2025 | 0.0740 | -0.24% |
| July 06, 2025 | 0.0738 | -0.26% |
| July 07, 2025 | 0.0738 | -0.10% |
| July 08, 2025 | 0.0736 | -0.26% |
| July 09, 2025 | 0.0733 | -0.42% |
| July 10, 2025 | 0.0737 | 0.66% |
| July 11, 2025 | 0.0744 | 0.91% |
| July 12, 2025 | 0.0745 | 0.12% |
| July 13, 2025 | 0.0750 | 0.66% |
| July 14, 2025 | 0.0754 | 0.60% |
| July 15, 2025 | 0.0752 | -0.28% |
| July 16, 2025 | 0.0758 | 0.77% |
| July 17, 2025 | 0.0754 | -0.53% |
| July 18, 2025 | 0.0749 | -0.73% |
| July 19, 2025 | 0.0750 | 0.19% |
| July 20, 2025 | 0.0743 | -0.97% |
| July 21, 2025 | 0.0743 | 0.00% |
| July 22, 2025 | 0.0744 | 0.14% |
| July 23, 2025 | 0.0745 | 0.23% |
| July 24, 2025 | 0.0746 | 0.08% |
| July 25, 2025 | 0.0739 | -0.94% |
| July 26, 2025 | 0.0737 | -0.29% |
| July 27, 2025 | 0.0737 | 0.02% |
| July 28, 2025 | 0.0736 | -0.19% |
| July 29, 2025 | 0.0742 | 0.93% |
| July 30, 2025 | 0.0745 | 0.28% |
| July 31, 2025 | 0.0750 | 0.67% |
Kaspa Price Prediction 2024
Venturing into the Kaspa forecast for 2024 feels like setting out on a grand adventure, much like unraveling the twists and turns of a gripping mystery novel. Here I stand, your dedicated guide through the intricate world of cryptocurrency predictions, ready to shed light on the future of Kaspa. And let me tell you, the journey we’re about to embark on is nothing short of a thrill ride.
Brace yourselves, as it seems Kaspa might encounter some choppy waters, with a potential dip to $0.0669. But don’t let that deter you. The real revelation lies in Kaspa’s potential to average out at $0.0781. And for those of you who thrive on a bit of risk, there’s a possibility that KAS could soar to a high of $0.0892.
Gazing into the future, the outlook for Kaspa in 2024 is laced with a hopeful undertone. We’re not anticipating the kind of dramatic, heart-stopping fluctuations that keep you on the edge of your seat. Rather, it looks like we’re in for a smoother ride, akin to a serene walk through gently undulating landscapes. For those seeking a sprinkle of excitement in their crypto portfolio, Kaspa might just be the ticket to an exhilarating journey.
However, a friendly piece of investment advice: tread carefully. If Kaspa has piqued your interest and you’re considering diving into its waters, remember to take it slow. The world of cryptocurrency is famed for its unpredictability. The best strategy? Equip yourself with thorough research and stay informed.
| Month | Minimum Price | Average Price | Maximum Price |
|---|---|---|---|
| February 2024 | 0.1356 | 0.1408 | 0.1466 |
| March 2024 | 0.1393 | 0.1446 | 0.1505 |
| April 2024 | 0.1430 | 0.1485 | 0.1546 |
| May 2024 | 0.1469 | 0.1525 | 0.1588 |
| June 2024 | 0.1508 | 0.1566 | 0.1631 |
| July 2024 | 0.1549 | 0.1609 | 0.1675 |
| August 2024 | 0.1591 | 0.1652 | 0.1720 |
| September 2024 | 0.1634 | 0.1697 | 0.1766 |
| October 2024 | 0.1678 | 0.1742 | 0.1814 |
| November 2024 | 0.1723 | 0.1790 | 0.1863 |
| December 2024 | 0.1770 | 0.1838 | 0.1913 |
| January 2025 | 0.1818 | 0.1887 | 0.1965 |
January 2024: Kaspa Price Forecast
As we step into the new year, Kaspa seems to be steadying its ship with a minimum price point projected at $0.1228, suggesting a stable footing. The average price hovers at a comfortable $0.1356, indicating a steady interest from traders and investors. Meanwhile, the maximum price of $0.1408 could be within reach, should market winds blow favorably, presenting a potentially lucrative opportunity for the eagle-eyed.
KAS Price Forecast for February 2024
Moving into February, Kaspa’s forecast paints a picture of slight progression, with the minimum price nudging up to $0.1356. The average price is expected to float around $0.1408, hinting at a consolidating market sentiment. As for the maximum price, a peek at $0.1466 seems plausible, offering a glimmer of growth potential in the frosty month.
March 2024: Kaspa Price Forecast
March brings a whiff of growth for Kaspa, as the minimum price climbs to $0.1393. The average price is pegged at $0.1446, suggesting a burgeoning confidence among Kaspa enthusiasts. And should the stars align, a maximum price of $0.1505 isn’t just a pipedream, but a reachable target for those keeping a keen watch.
KAS Price Forecast for April 2024
April’s showers may well bring May flowers, and for Kaspa, the forecast suggests a bloom with the minimum price reaching $0.1430. The average price forecast at $0.1485 speaks of a growing trust in Kaspa’s potential, while a maximum price of $0.1546 hints at the possibility of a spring surge.
May 2024: Kaspa Price Forecast
The merry month of May looks promising for Kaspa, with a forecasted minimum price of $0.1469. The average price is expected to blossom to $0.1525, perhaps as the market shakes off any residual cold. The maximum price could potentially reach $0.1588, painting a rosy picture for the mid-spring period.
KAS Price Forecast for June 2024
As we swing into the summer months, June has Kaspa’s minimum price forecasted to step up to $0.1508. The average price, sitting at $0.1566, could be indicative of warming investor interest. The maximum price, on the other hand, suggests a sunny outlook peaking at $0.1631.
July 2024: Kaspa Price Forecast
July sees Kaspa maintaining its upward trajectory with a minimum price of $0.1549. The average price is pegged at $0.1609, which could signal a steady mid-summer interest in Kaspa. Optimists will eye the maximum price of $0.1675, hoping for a hot streak in the market.
KAS Price Forecast for August 2024
As the heat persists, August forecasts Kaspa’s minimum price to be at $0.1591, with the average price slightly simmering at $0.1652. Those looking for a maximum thrill might find it at $0.1720, should Kaspa catch the summer trading wave.
September 2024: Kaspa Price Forecast
When September rolls around, Kaspa might see its minimum price mature to $0.1634. The average price, nestled at $0.1697, could reflect a post-vacation return to crypto trading vigor. And for the high rollers, a maximum price of $0.1766 is on the horizon, hinting at a potentially fruitful harvest season.
KAS Price Forecast for October 2024
October brings a crisp outlook for Kaspa, with the minimum price expected to carve out at $0.1678. The average price, akin to a stable autumnal climate, is forecasted at $0.1742. And should the market trends favor the bold, a maximum price of $0.1814 could be the treat after the tricks.
November 2024: Kaspa Price Forecast
As we near the year’s end, November’s chill doesn’t seem to affect Kaspa, which is expected to hold a minimum price of $0.1723. The average price could warm up to $0.1790, while a maximum price of $0.1863 might just set the stage for a festive season ahead.
KAS Price Forecast for December 2024
Rounding off the year, December’s forecast for Kaspa looks merry and bright with a minimum price of $0.1770. The average price, sitting cozy at $0.1838, may reflect a year-end optimism. And if the holiday spirit catches on, the maximum price could jingle all the way to $0.1913, ending the year with a bang.
Kaspa Price Prediction 2025
Gazing into the financial crystal ball for 2025, Kaspa seems poised for a steady climb. The forecast suggests a minimum price of $0.1798, reflecting a solid base of support. Meanwhile, the average price is expected to hover at $0.2133, which could indicate a sustained interest from a broader investment audience. For those looking towards the higher echelons, a maximum price of $0.2537 looms on the horizon, potentially rewarding the patient and the optimistic.
| Month | Minimum Price | Average Price | Maximum Price |
|---|---|---|---|
| February 2025 | 0.1798 | 0.1867 | 0.1944 |
| March 2025 | 0.1847 | 0.1917 | 0.1996 |
| April 2025 | 0.1896 | 0.1969 | 0.2050 |
| May 2025 | 0.1948 | 0.2022 | 0.2105 |
| June 2025 | 0.2000 | 0.2077 | 0.2162 |
| July 2025 | 0.2054 | 0.2133 | 0.2221 |
| August 2025 | 0.2110 | 0.2191 | 0.2281 |
| September 2025 | 0.2167 | 0.2250 | 0.2342 |
| October 2025 | 0.2225 | 0.2311 | 0.2405 |
| November 2025 | 0.2285 | 0.2373 | 0.2470 |
| December 2025 | 0.2347 | 0.2437 | 0.2537 |
| January 2026 | 0.2410 | 0.2503 | 0.2605 |
Kaspa Price Prediction 2026
As we look towards 2026, the trajectory of Kaspa’s value appears to continue its ascent. A minimum price of $0.2383 sets the stage for what could be another year of growth. The average price is seen at $0.2828, suggesting a steady momentum in market confidence. Those with an eye on the prize might be thrilled by a possible maximum price of $0.3363, which could signal another lucrative year for Kaspa holders.
| Month | Minimum Price | Average Price | Maximum Price |
|---|---|---|---|
| February 2026 | 0.2383 | 0.2475 | 0.2577 |
| March 2026 | 0.2448 | 0.2542 | 0.2646 |
| April 2026 | 0.2514 | 0.2611 | 0.2718 |
| May 2026 | 0.2582 | 0.2681 | 0.2791 |
| June 2026 | 0.2652 | 0.2753 | 0.2866 |
| July 2026 | 0.2723 | 0.2828 | 0.2944 |
| August 2026 | 0.2797 | 0.2904 | 0.3023 |
| September 2026 | 0.2872 | 0.2983 | 0.3105 |
| October 2026 | 0.2950 | 0.3063 | 0.3189 |
| November 2026 | 0.3029 | 0.3146 | 0.3275 |
| December 2026 | 0.3111 | 0.3231 | 0.3363 |
| January 2027 | 0.3195 | 0.3318 | 0.3454 |
Kaspa Price Prediction 2027
Peering further into the decade, 2027 holds promise for Kaspa’s evolution in the crypto market. The forecast pinpoints a minimum price of $0.3160, indicative of Kaspa’s growing adoption. With an average price of $0.3749, it seems that Kaspa could be cementing its position as a stable asset in investors’ portfolios. And a maximum price of $0.4459? That could be the sweet spot for those aiming high.
| Month | Minimum Price | Average Price | Maximum Price |
|---|---|---|---|
| February 2027 | 0.3160 | 0.3281 | 0.3416 |
| March 2027 | 0.3245 | 0.3370 | 0.3508 |
| April 2027 | 0.3333 | 0.3461 | 0.3603 |
| May 2027 | 0.3423 | 0.3554 | 0.3700 |
| June 2027 | 0.3515 | 0.3650 | 0.3800 |
| July 2027 | 0.3610 | 0.3749 | 0.3903 |
| August 2027 | 0.3708 | 0.3850 | 0.4008 |
| September 2027 | 0.3808 | 0.3954 | 0.4116 |
| October 2027 | 0.3910 | 0.4061 | 0.4227 |
| November 2027 | 0.4016 | 0.4170 | 0.4341 |
| December 2027 | 0.4125 | 0.4283 | 0.4459 |
| January 2028 | 0.4236 | 0.4399 | 0.4579 |
Kaspa Price Prediction 2028
The year 2028 shows no signs of slowing down for Kaspa if the predictions hold true. The minimum price is projected at $0.4189, laying a robust foundation for the year. An average price of $0.4970 could signal a year of unwavering interest, while a maximum price of $0.5911 would suggest that Kaspa’s potential is being realized, possibly setting a new benchmark for the asset.
| Month | Minimum Price | Average Price | Maximum Price |
|---|---|---|---|
| February 2028 | 0.4189 | 0.4350 | 0.4529 |
| March 2028 | 0.4303 | 0.4468 | 0.4651 |
| April 2028 | 0.4419 | 0.4588 | 0.4777 |
| May 2028 | 0.4538 | 0.4712 | 0.4906 |
| June 2028 | 0.4661 | 0.4840 | 0.5038 |
| July 2028 | 0.4786 | 0.4970 | 0.5174 |
| August 2028 | 0.4916 | 0.5104 | 0.5314 |
| September 2028 | 0.5048 | 0.5242 | 0.5457 |
| October 2028 | 0.5185 | 0.5384 | 0.5605 |
| November 2028 | 0.5325 | 0.5529 | 0.5756 |
| December 2028 | 0.5468 | 0.5678 | 0.5911 |
| January 2029 | 0.5616 | 0.5832 | 0.6071 |
Kaspa Price Prediction 2029
Approaching the end of the decade, 2029’s forecast for Kaspa depicts a continuing upward trend. The minimum price is slated to be $0.5554, showing potential for enduring stability. The average price, sitting at $0.6589, might reflect a maturing market sentiment. And for the go-getters, a maximum price of $0.7837 could epitomize the pinnacle of Kaspa’s success story.
| Month | Minimum Price | Average Price | Maximum Price |
|---|---|---|---|
| February 2029 | 0.5554 | 0.5768 | 0.6004 |
| March 2029 | 0.5704 | 0.5923 | 0.6166 |
| April 2029 | 0.5858 | 0.6083 | 0.6333 |
| May 2029 | 0.6016 | 0.6248 | 0.6504 |
| June 2029 | 0.6179 | 0.6416 | 0.6679 |
| July 2029 | 0.6346 | 0.6589 | 0.6860 |
| August 2029 | 0.6517 | 0.6767 | 0.7045 |
| September 2029 | 0.6693 | 0.6950 | 0.7235 |
| October 2029 | 0.6874 | 0.7138 | 0.7430 |
| November 2029 | 0.7059 | 0.7330 | 0.7631 |
| December 2029 | 0.7250 | 0.7528 | 0.7837 |
| January 2030 | 0.7446 | 0.7732 | 0.8049 |
Kaspa Price Prediction 2030
Welcoming the new decade, 2030’s Kaspa price prediction carries a tone of optimism. With a minimum price of $0.7364, it suggests that Kaspa has navigated the tumultuous crypto seas successfully. The average price could level out at $0.8737, hinting at a consensus of value amongst traders. The maximum price, aiming at $1.0391, provides an ambitious target for Kaspa, possibly reflecting breakthroughs or heightened adoption.
| Month | Minimum Price | Average Price | Maximum Price |
|---|---|---|---|
| February 2030 | 0.7364 | 0.7647 | 0.7961 |
| March 2030 | 0.7563 | 0.7854 | 0.8176 |
| April 2030 | 0.7767 | 0.8066 | 0.8396 |
| May 2030 | 0.7977 | 0.8283 | 0.8623 |
| June 2030 | 0.8192 | 0.8507 | 0.8856 |
| July 2030 | 0.8413 | 0.8737 | 0.9095 |
| August 2030 | 0.8641 | 0.8973 | 0.9340 |
| September 2030 | 0.8874 | 0.9215 | 0.9593 |
| October 2030 | 0.9113 | 0.9464 | 0.9852 |
| November 2030 | 0.9360 | 0.9719 | 1.0118 |
| December 2030 | 0.9612 | 0.9982 | 1.0391 |
| January 2031 | 0.9872 | 1.0251 | 1.0671 |
Kaspa Price Prediction 2031
Venturing into 2031, Kaspa’s forecast indicates a continuation of its progressive streak. The minimum price stands firm at $0.9763, which may be indicative of its resilience in the market. With the average price predicted at $1.1583, it’s clear that Kaspa’s journey could be gaining a steady stream of followers. And if the stars align for a maximum price of $1.3776, it could be a testament to Kaspa’s robustness and allure in the crypto universe.
| Month | Minimum Price | Average Price | Maximum Price |
|---|---|---|---|
| February 2031 | 0.9763 | 1.0139 | 1.0554 |
| March 2031 | 1.0027 | 1.0412 | 1.0839 |
| April 2031 | 1.0298 | 1.0693 | 1.1132 |
| May 2031 | 1.0576 | 1.0982 | 1.1432 |
| June 2031 | 1.0861 | 1.1279 | 1.1741 |
| July 2031 | 1.1155 | 1.1583 | 1.2058 |
| August 2031 | 1.1456 | 1.1896 | 1.2384 |
| September 2031 | 1.1765 | 1.2217 | 1.2718 |
| October 2031 | 1.2083 | 1.2547 | 1.3061 |
| November 2031 | 1.2409 | 1.2886 | 1.3414 |
| December 2031 | 1.2744 | 1.3234 | 1.3776 |
| January 2032 | 1.3088 | 1.3591 | 1.4148 |
Kaspa Price Prediction 2032
As we set our sights on 2032, the Kaspa price prediction seems to underscore a narrative of growth and potential. The forecasted minimum price of $1.2944 could speak volumes about the long-term confidence in Kaspa. An average price of $1.5357 suggests a persistent upward trajectory in market valuation. And a maximum price of $1.8264? That would mark yet another year of possible highs for those invested in the Kaspa saga.
| Month | Minimum Price | Average Price | Maximum Price |
|---|---|---|---|
| February 2032 | 1.2944 | 1.3441 | 1.3992 |
| March 2032 | 1.3294 | 1.3804 | 1.4370 |
| April 2032 | 1.3652 | 1.4177 | 1.4758 |
| May 2032 | 1.4021 | 1.4560 | 1.5157 |
| June 2032 | 1.4400 | 1.4953 | 1.5566 |
| July 2032 | 1.4788 | 1.5357 | 1.5986 |
| August 2032 | 1.5188 | 1.5771 | 1.6418 |
| September 2032 | 1.5598 | 1.6197 | 1.6861 |
| October 2032 | 1.6019 | 1.6634 | 1.7316 |
| November 2032 | 1.6451 | 1.7084 | 1.7784 |
| December 2032 | 1.6896 | 1.7545 | 1.8264 |
| January 2033 | 1.7352 | 1.8018 | 1.8757 |
The Main Questions Of Critical Thinking When We Talk About Kaspa Price Forecast
In the ever-evolving landscape of cryptocurrency, critical thinking is paramount, especially when forecasting the future price of assets like KAS. It’s vital to approach Kaspa price predictions with a blend of skepticism and curiosity, questioning the factors that could sway its market value in either direction.
- What market trends could significantly impact the forecasted price of KAS?
- How does Kaspa’s underlying technology compare to current market leaders, and could this affect its price?
- Are there any upcoming developments within the KAS ecosystem that could influence its future value?
- What regulatory changes could pose a risk or benefit to Kaspa’s market price in the coming years?
- How might the entry of new competitors into the market affect the price of KAS?
- In what ways could global economic events shape the demand for Kaspa?
- What historical price movements of KAS can inform us about its potential future performance?
- How does Kaspa’s market capitalization correlate with its trading volume and price movements?
- Could technological advancements or setbacks in blockchain technology impact KAS price predictions?
- What role does investor sentiment play in the fluctuation of Kaspa’s price?
- How might changes in the utility and adoption of KAS alter its price forecast?
- What are the risks of Kaspa facing scalability issues, and how would this affect its price?
- How could the overall growth of the cryptocurrency market influence KAS price projections?
- Are there any known plans for Kaspa to forge new partnerships or collaborations that could affect its valuation?
- What influence do major cryptocurrency exchanges have over the liquidity and price of KAS?
- How might Kaspa’s community engagement and growth impact its price over the long term?
- Could potential forks or updates to the KAS protocol create price volatility?
- What are the implications of network security issues on the perceived value of Kaspa?
- How does the supply and demand dynamic specifically for KAS play into its price prediction models?
- Can the level of technological adoption and integration of Kaspa in mainstream finance affect its future price?
When we dissect Kaspa price predictions, it becomes evident that they are not just about numbers and charts; they’re about understanding a complex ecosystem. The right questions can illuminate pathways through the fog of speculation, guiding us towards more informed and thoughtful investment strategies in the world of cryptocurrencies.
Kaspa (KAS) Future Price Predictions by Experts
Stepping into the buzzing world of crypto, I’ve taken into account Kaspa (KAS) forecasts of some of the experienced folks who’ve been around the block.
- AMBCrypto: According to the analysis by AMBCrypto, Kaspa is projected to reach a high of $0.14 by the year 2030.
- OvenAdd: The website OvenAdd, as featured on CoinMarketCap, forecasts that Kaspa will achieve highs of $0.1729 in 2025 and escalate to highs of $0.4003 by 2030.
- Crypto Bulls Club: The Crypto Bulls Club has put forth a prediction suggesting that KAS may conclude the year 2025 with a high valuation of $0.285 and may surge to highs of $0.7148 in the year 2030.
- Price Prediction: Gracie Perez, contributing to the Price Prediction website, has made a forecast indicating that Kaspa is expected to hit the $1 mark in 2028 and could reach a high of $2.56 in 2030.
- CCN: CCN has compiled various price predictions for Kaspa from multiple sources, with a consolidated outlook suggesting that KAS might kick off the year 2030 at a price of $0.88.
Here’s a tip from what I’ve learned: even though the investment advice from these experts is really valuable, don’t just take their word for it as the only truth. Their knowledge is like finding a rare coin—it’s great to have, but it’s not everything. Make sure you do your own research, too. It’s the best way to really understand what you’re getting into.
Decoding the Charts: Kaspa Technical Price Analysis
When you’re looking to get the lay of the land in Kaspa’s price movements, the charts are your best friends. Now, let me walk you through the toolkit every savvy chart analyst has at their disposal. We’re talking about the must-have gadgets that can turn a jumble of numbers and lines into a clear picture.
- Candlestick Patterns: These are the hieroglyphs of the trading world, offering insight into market sentiment and potential price movement directions. By reading these patterns, we can get a glimpse into the tug-of-war between buyers and sellers.
- Moving Averages: These act as the smoothing sandpaper over the rough surface of daily price fluctuations, helping to highlight ongoing trends by averaging prices over a specific period.
- Volume Analysis: This is like the pulse check of the market, gauging the strength or weakness behind price trends based on the amount of trade activity.
- Support and Resistance Levels: These are the invisible barriers in the market. Support levels are like a safety net, catching falling prices, while resistance levels are the ceiling that prices might struggle to break through.
- Trend Analysis: It’s the compass for chart navigators, helping to identify which direction the market is moving so traders can sail along with the current.
- Chart Patterns: These are the constellations in the night sky of market analysis, where traders look for recognizable formations that can signal potential future price movements.
- Timeframes: In the realm of trading, time is of the essence. Different timeframes can tell different stories, from the short bursts of a minute chart to the epic tales of a monthly chart.
Technical Indicators: Origin and Purpose
Now, let’s talk about technical indicators—the spices that can turn a bland chart into a flavorful forecast. These mathematical calculations based on past prices, volume, or open interest can give you a fresh angle on the market.
The Role of Technical Indicators in Financial Markets
In the financial markets, technical indicators are like the compass and binoculars on a ship’s bridge. They help traders and investors to navigate through choppy market seas and spot distant opportunities or threats. Indicators can confirm what you see in the charts or, sometimes, warn you about something you’ve missed.
How Technical Indicators Can Help Predict KAS Price
When it comes to KAS price predictions, technical indicators are part of your toolkit. They’re like the gauges in a car’s dashboard, giving you different readings—momentum, trend strength, overbought or oversold conditions—that can help in deciding when to hit the gas or when to brake on your trades. Use them wisely, and they can be powerful allies in your quest for profit in the Kaspa markets.
In my journey through the world of trading, I’ve picked up a really important tip: the tools we use to look at charts and figures are like little lights that help us see in a dark room. They don’t promise we’ll find something amazing, but they sure help us look. The best approach is to use these tools along with other ways of understanding the market, always trying to see the big picture.
I want to share a few tools that have really helped me out. I’ll show you some clear examples of how to use these tools to get a better idea of where KAS prices might be heading. I’m here to share some tips so you can navigate the ups and downs of the crypto world a bit more easily.
Moving Averages (MAs) for Kaspa Price Prediction
Moving Averages (MAs) are like the steady hands of a seasoned sailor, guiding you through the choppy waters of the crypto market. They smooth out price data over a specific period to give you a clear view of the overall trend, free from the distracting noise of daily price fluctuations. Whether it’s a Simple Moving Average (SMA) or an Exponential Moving Average (EMA), these MAs help you understand whether Kaspa’s price is on an uptrend, downtrend, or simply meandering sideways.
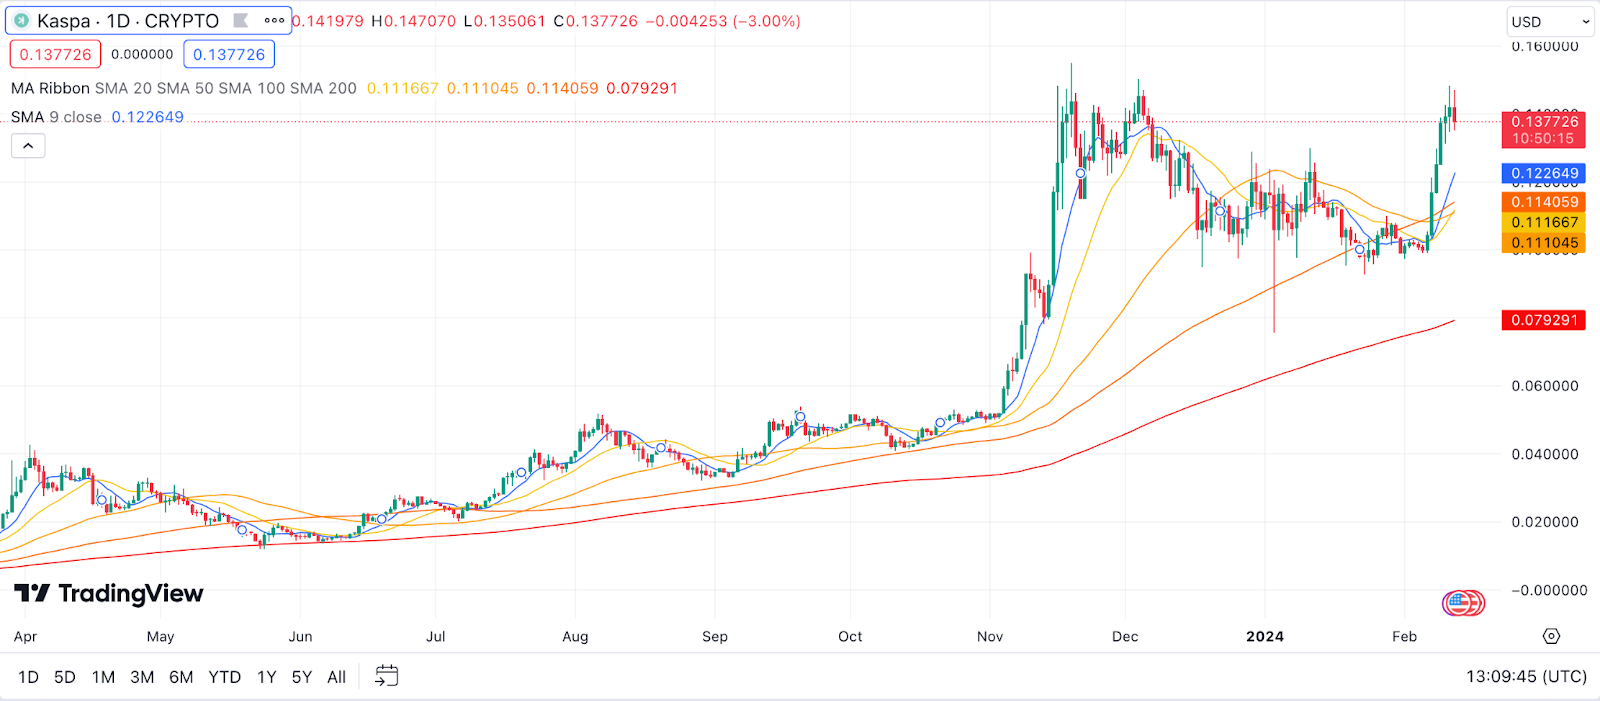
Example: Imagine you’re looking at a chart and you see the 50-day MA for KAS gliding smoothly above the 200-day MA. This could be a bullish signal, suggesting that Kaspa’s price might be gearing up for a steady climb. It’s like spotting a lighthouse in the distance, indicating safer waters ahead for your investment journey.
Relative Strength Index (RSI) for Kaspa Price Prediction
The Relative Strength Index (RSI) is your financial sixth sense, whispering to you when Kaspa might be overbought or oversold. By oscillating between 0 and 100, the RSI gives you the lowdown on the momentum of price movements. A reading above 70 typically screams “overbought,” while a dip below 30 hints that the asset might be “oversold.” It’s a nifty tool for timing your trades, helping you decide when to jump in or bow out gracefully.
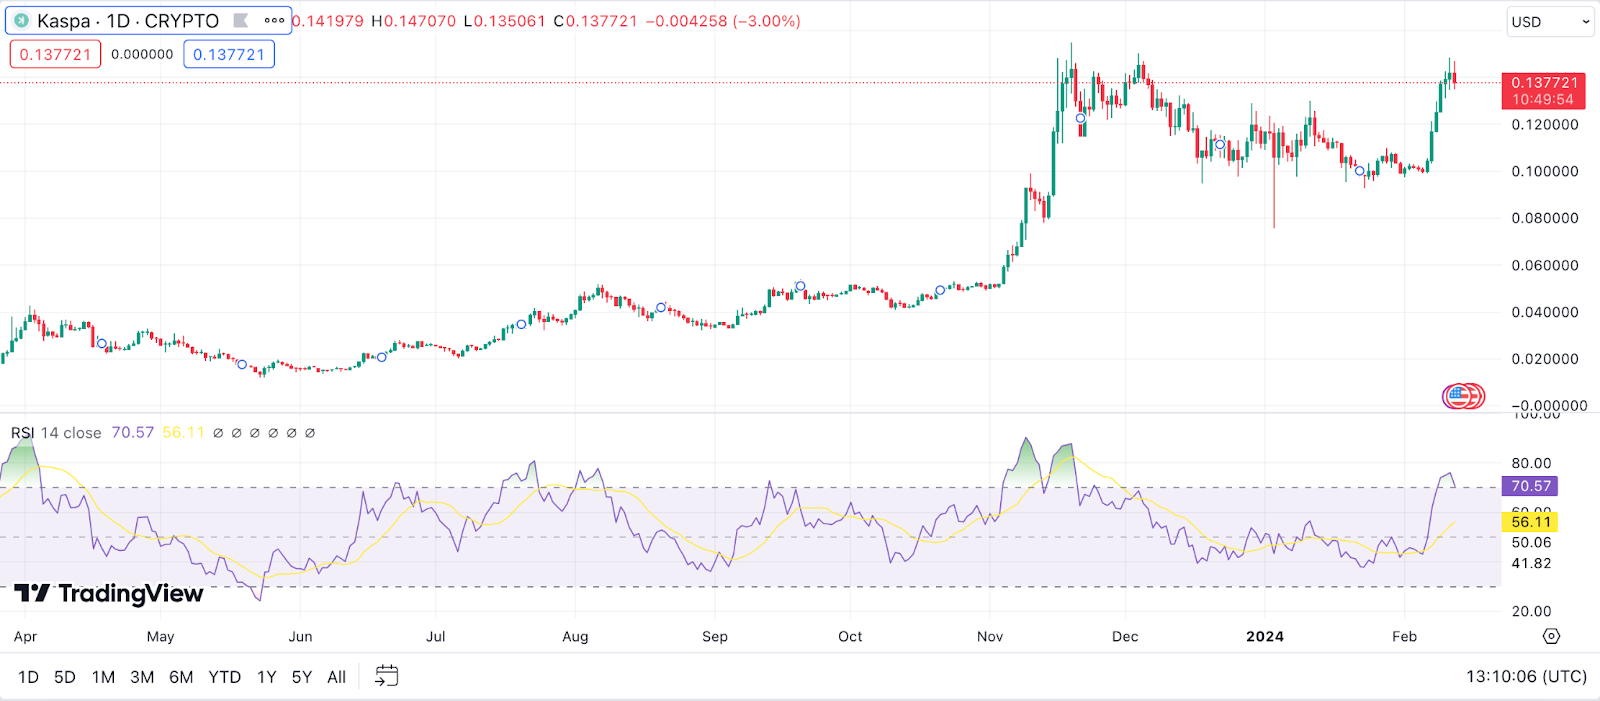
Example: Let’s say the RSI for KAS dips below 30. This could be your cue that the market is feeling a bit pessimistic about Kaspa, potentially overdoing the sell-off. It might be a golden opportunity to buy in, akin to finding a rare coin at a garage sale, poised for value appreciation once the market mood swings back.
Moving Average Convergence Divergence (MACD) for Kaspa Price Prediction
Diving into the Moving Average Convergence Divergence (MACD) feels like unlocking a secret code. The MACD takes two moving averages and turns them into a momentum oscillator by subtracting the longer MA from the shorter one. This gives you not just the direction of the trend, but also the momentum behind it. When the MACD line crosses above the signal line, it’s a bullish signal; a cross below could spell bearish times ahead.
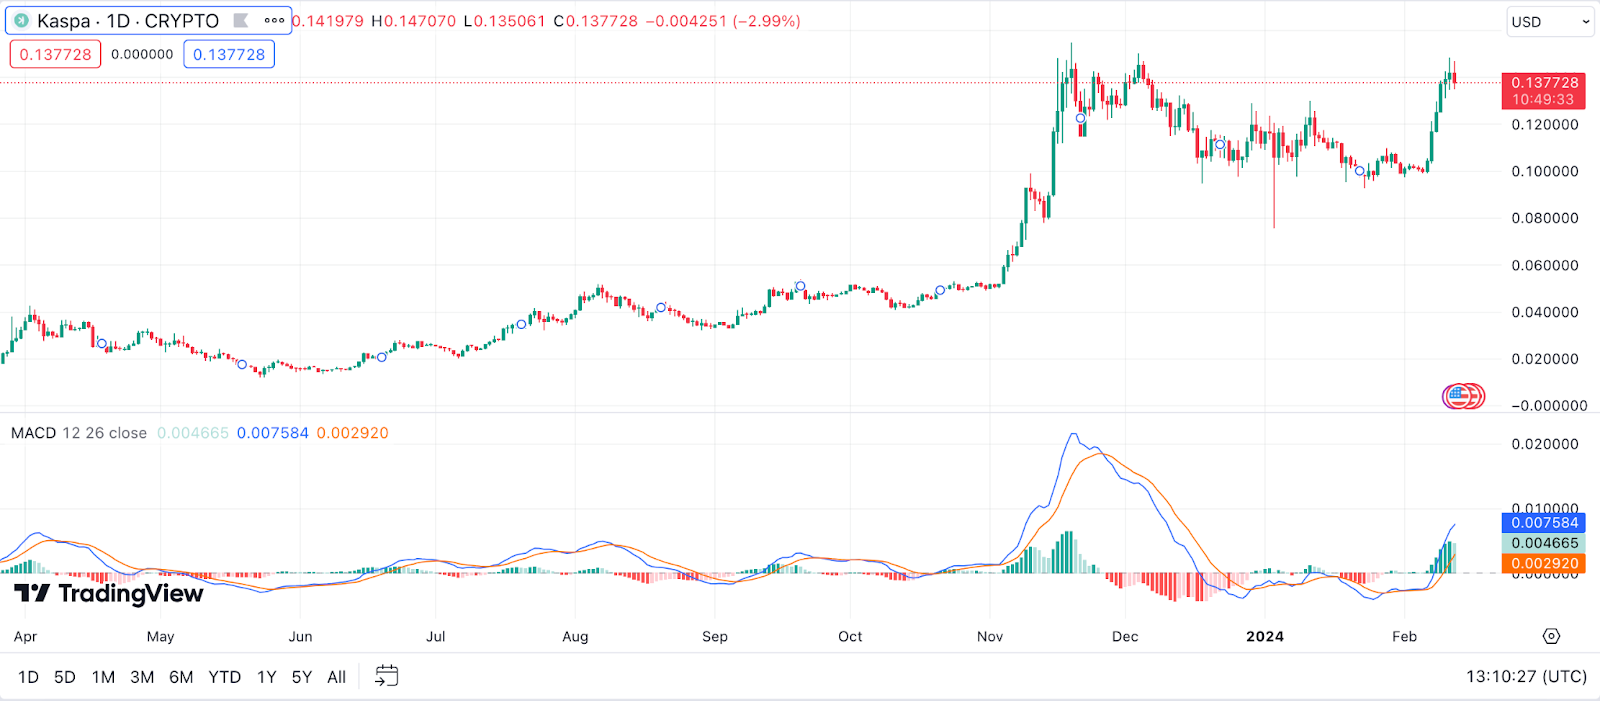
Example: Picture a scenario where the MACD line for KAS crosses above the signal line, right as the histogram turns positive. This convergence could signal that Kaspa’s price is picking up steam, potentially embarking on an upward trajectory. It’s akin to catching the first note of your favorite song on the radio, signaling the start of something good.
Bollinger Bands for Kaspa Price Prediction
Bollinger Bands are like the guardrails on your trading highway, keeping you in check as you navigate the volatility of the Kaspa market. These bands expand and contract based on market volatility, with the price of KAS typically oscillating between the upper and lower bands. The middle band, usually a Simple Moving Average, serves as a baseline. When KAS touches the upper band, it might be considered overbought; nearing the lower band could indicate it’s oversold.
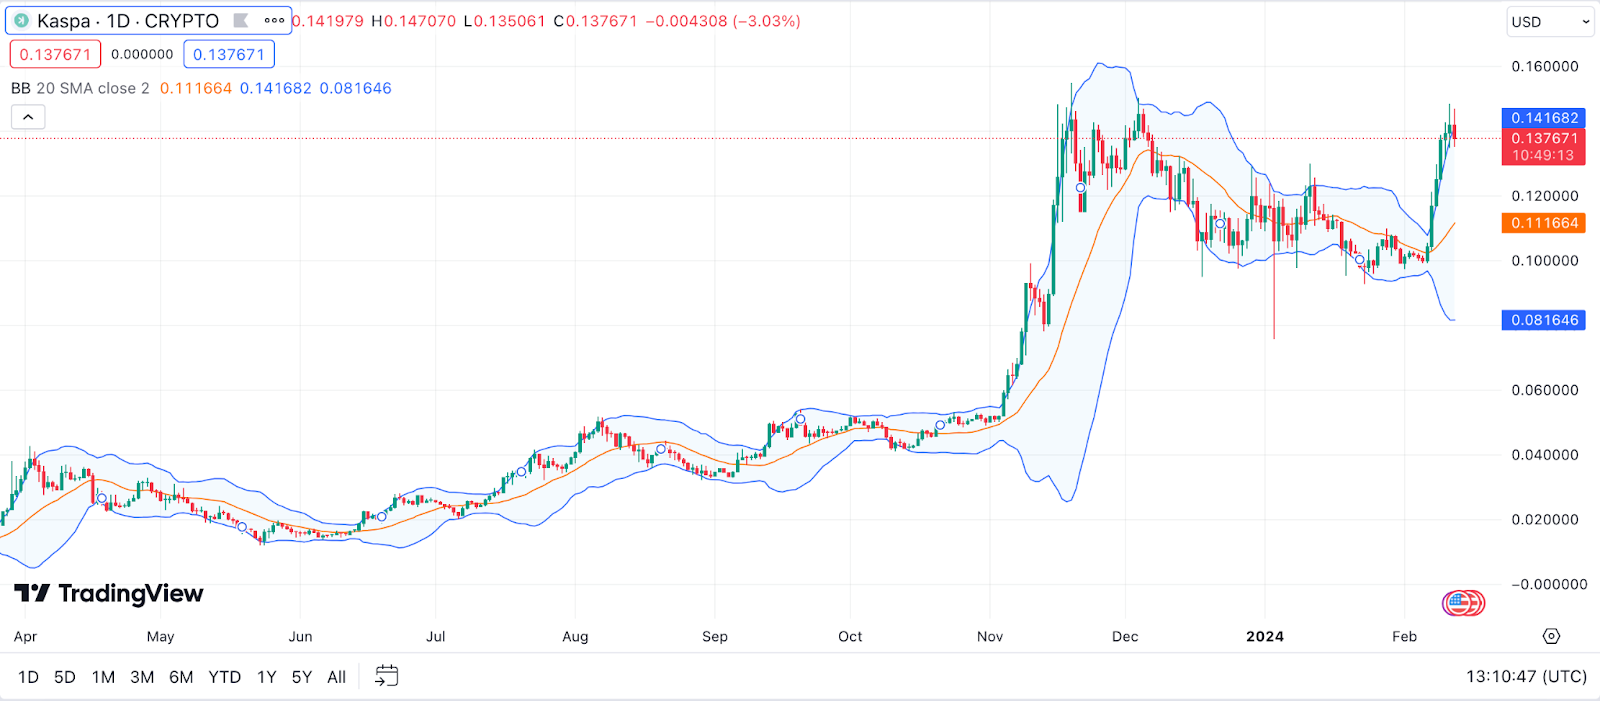
Example: If you notice Kaspa’s price hugging the upper Bollinger Band, it’s like seeing the foam at the top of a wave—it might be reaching its peak before a potential pullback. This could be a signal to brace for a bit of a dip, or if you’re daring, to consider taking some profits before the market corrects itself.
Stochastic Oscillator for Kaspa Price Prediction
The Stochastic Oscillator is your market mood ring, changing colors based on the current sentiment around Kaspa’s price. It compares the closing price of KAS to its price range over a given period, aiming to predict price turning points by identifying conditions of overbuying or overselling. With values ranging from 0 to 100, readings above 80 suggest overbuying, while those below 20 indicate overselling.
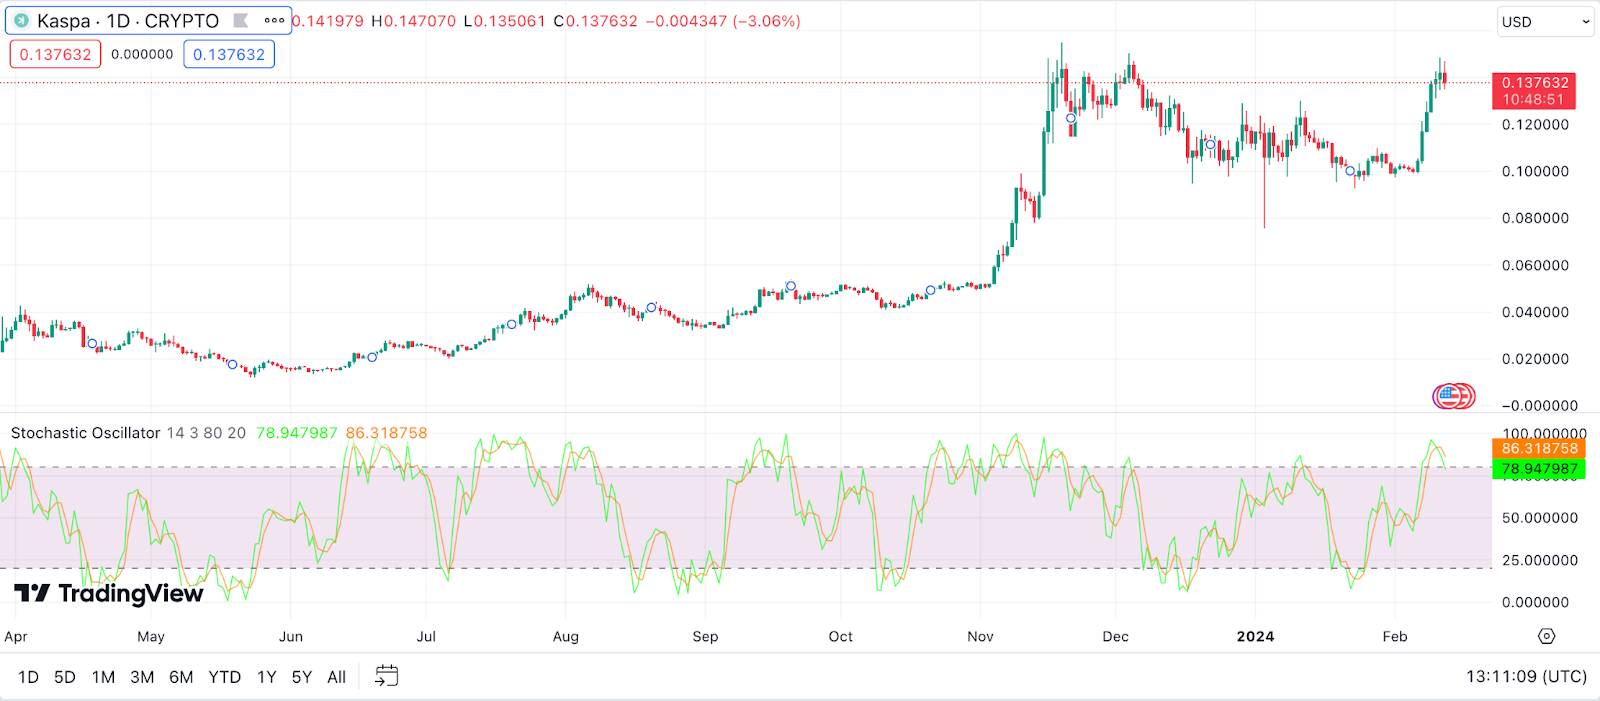
Example: When the Stochastic lines for Kaspa cross above 80, it’s akin to a crowded room getting a bit too noisy—perhaps too many buyers are piling in, and it’s getting overheated. This might suggest it’s time to look for an exit and wait for a quieter moment to re-enter, akin to stepping out for a breath of fresh air.
Parabolic SAR (Stop and Reverse) for Kaspa Price Prediction
The Parabolic SAR is like your trusty trail marker, guiding you through the twists and turns of the Kaspa market. It places dots on the chart that help to identify potential reversals in the price movement of KAS. When these dots flip positions, moving from above the price to below it, or vice versa, it signals a potential shift in the market’s direction, offering a clear ‘stop and reverse’ signal.
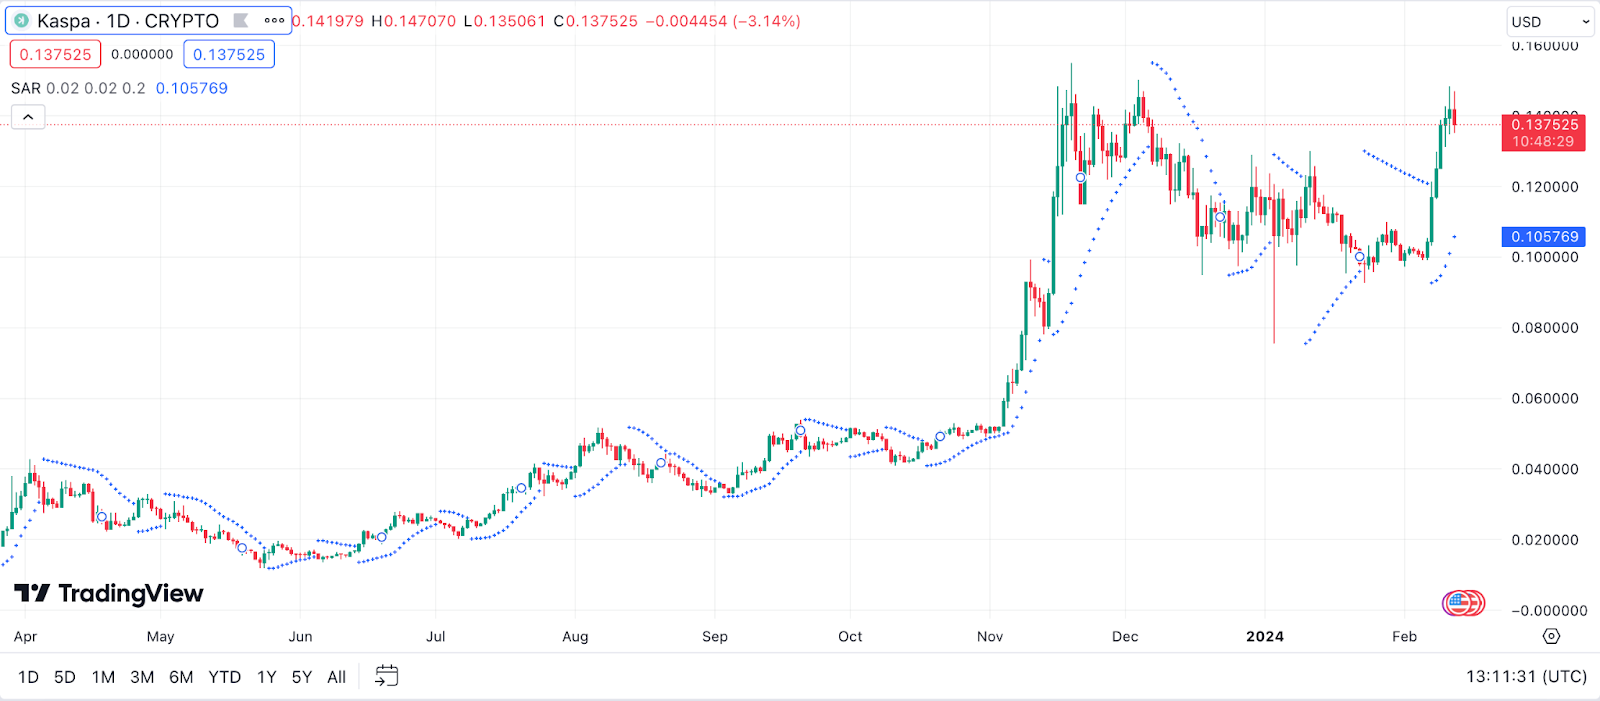
Example: Imagine you’re tracking KAS and the dots of the Parabolic SAR jump from beneath the price to above it. It’s as if you’ve hit a checkpoint in a maze, signaling it’s time to change course. This could be your hint to consider securing your position or preparing to pivot, much like a hiker spotting a trail sign and deciding it’s time to take a different path.
Ichimoku Cloud for Kaspa Price Prediction
The Ichimoku Cloud is like having a weather forecast for the Kaspa market, offering a multi-dimensional view of the future. This complex indicator provides information on support and resistance levels, trend direction, momentum, and potential buy or sell signals—all through its unique combination of lines and “clouds.” When KAS price is above the cloud, it’s sunny days ahead, indicating a bullish trend. Conversely, if the price is below the cloud, it might be time to pack an umbrella for bearish weather.
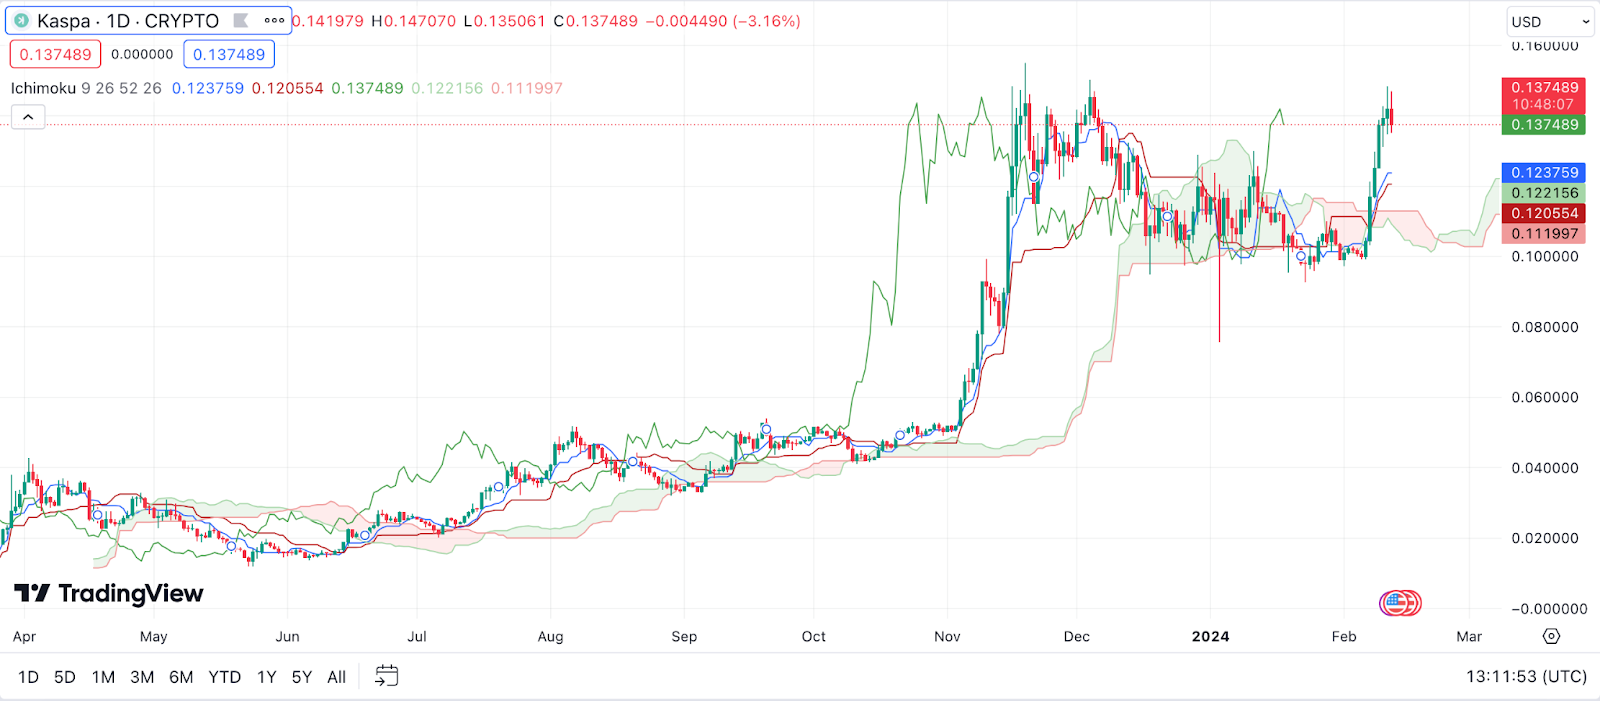
Example: If you see Kaspa’s price breaking through the top of the cloud, it’s like the sun breaking through the clouds after a stormy day—things might be looking up. This could be a signal that the market sentiment is turning positive, and it might be a good time to consider your entry points, akin to stepping outside to enjoy the sunshine.
Fibonacci Retracement for Kaspa Price Prediction
Fibonacci Retracement is like the ebb and flow of the ocean’s tides, guided by the moon’s gravitational pull. This tool helps traders identify potential support and resistance levels based on the Fibonacci sequence, a series of numbers that has been found to have a surprising amount of application in nature, art, and now, financial markets. In the context of KAS, these retracement levels can indicate where the price might pause or reverse during a pullback.
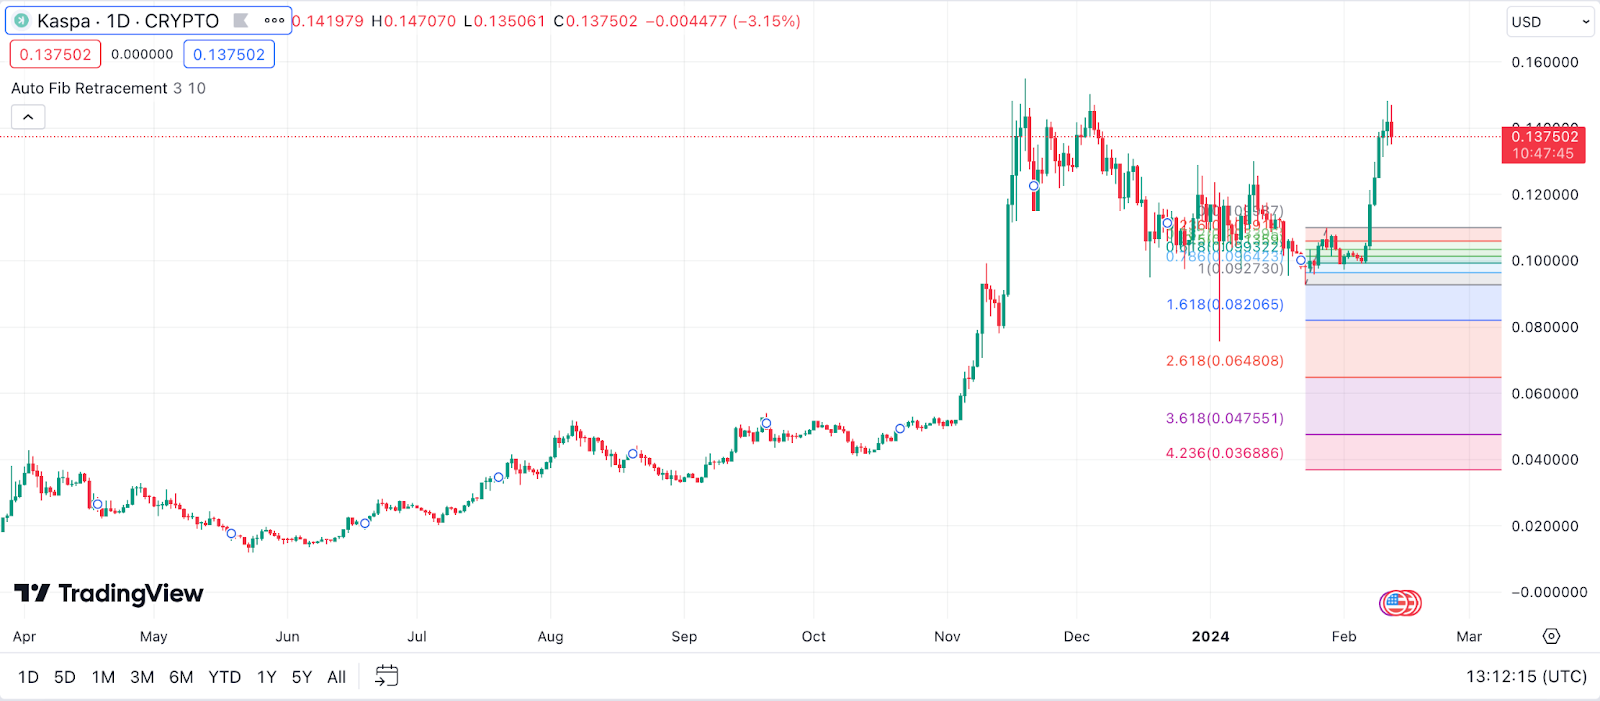
Example: Imagine Kaspa is on an uptrend, but then it starts to pull back. By drawing Fibonacci retracement levels, you might find that KAS finds support at the 61.8% level, like a wave gathering strength before rolling back to shore. This could be an opportune moment to “catch the wave” and ride the next upswing, akin to timing your swim with the ocean’s rhythms.
Average Directional Index (ADX) for Kaspa Price Prediction
The Average Directional Index (ADX) is your compass in the vast sea of the crypto market, helping you gauge the strength of a trend. It doesn’t tell you the direction of the trend, but rather how strong or weak the current trend is. An ADX value above 25 typically indicates a strong trend, either up or down, while a value below this suggests a weaker trend or a market that’s mostly moving sideways.

Example: If the ADX for Kaspa climbs above 25, it’s like the wind picking up, signaling that the current trend, whether bullish or bearish, is gathering force. This could be your cue to adjust your sails and prepare for more pronounced moves in the direction of the trend, much like a sailor setting course with the wind at their back.
On Balance Volume (OBV) for Kaspa Price Prediction
On Balance Volume (OBV) acts like a crowd meter for the Kaspa market, giving you a sense of the volume flow and its potential impact on price movements. Think of it as tracking the hustle and bustle in a marketplace: a rising OBV suggests that buyers are in control, pushing the price up, much like a bustling market where demand is high. Conversely, a falling OBV indicates sellers are dominating, possibly driving the price down, similar to a market winding down as shoppers head home.
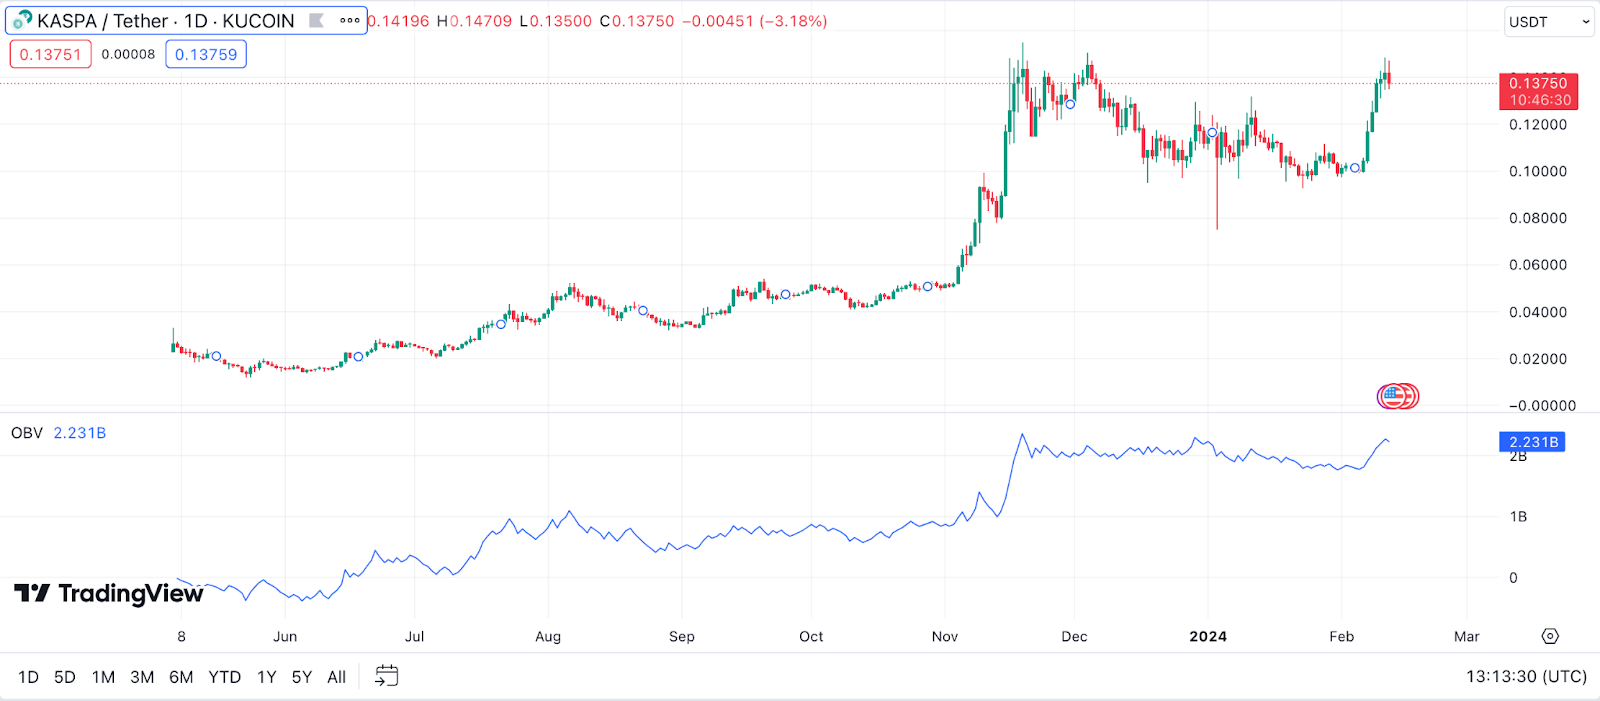
Example: If the OBV for Kaspa starts climbing while the price is also going up, it’s like seeing more and more people rushing into a store for a hot sale. This could signal strong buyer interest and might be a bullish sign, suggesting the price could rise further as the buying frenzy continues.
Rate of Change (ROC) for Kaspa Price Prediction
The Rate of Change (ROC) is like the speedometer for Kaspa’s price, telling you how fast the price is moving over a specified period. It’s all about momentum: a positive ROC indicates that KAS prices are increasing, potentially signaling an uptrend, much like a car accelerating on an open highway. A negative ROC, on the other hand, suggests the price is dropping, which could be a warning sign of a downtrend, akin to a car slowing down as it approaches a red light.
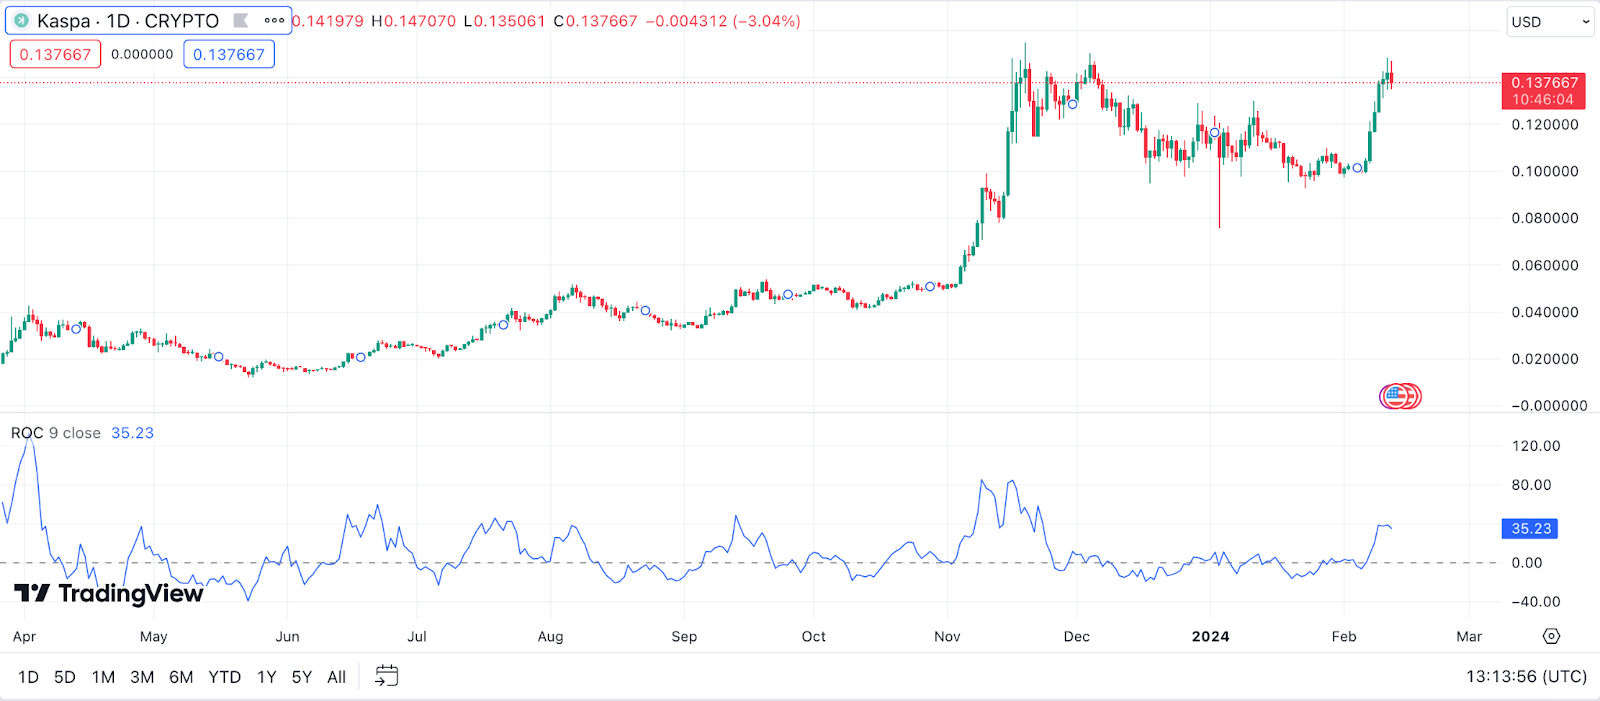
Example: If Kaspa’s ROC shifts from negative to positive, it’s like a car shifting gears and picking up speed, suggesting that the market sentiment might be shifting in favor of Kaspa. This change in momentum could be a cue for traders to buckle up for a potential upward journey in KAS prices.
Commodity Channel Index (CCI) for Kaspa Price Prediction
The Commodity Channel Index (CCI) is like a temperature gauge for Kaspa, measuring how its price deviates from its statistical average. This indicator can help identify cyclical trends, pinpointing when KAS might be entering overbought or oversold territory. When the CCI is above +100, Kaspa might be overheating (overbought), and when it’s below -100, it could be too cold (oversold), signaling a potential reversal.
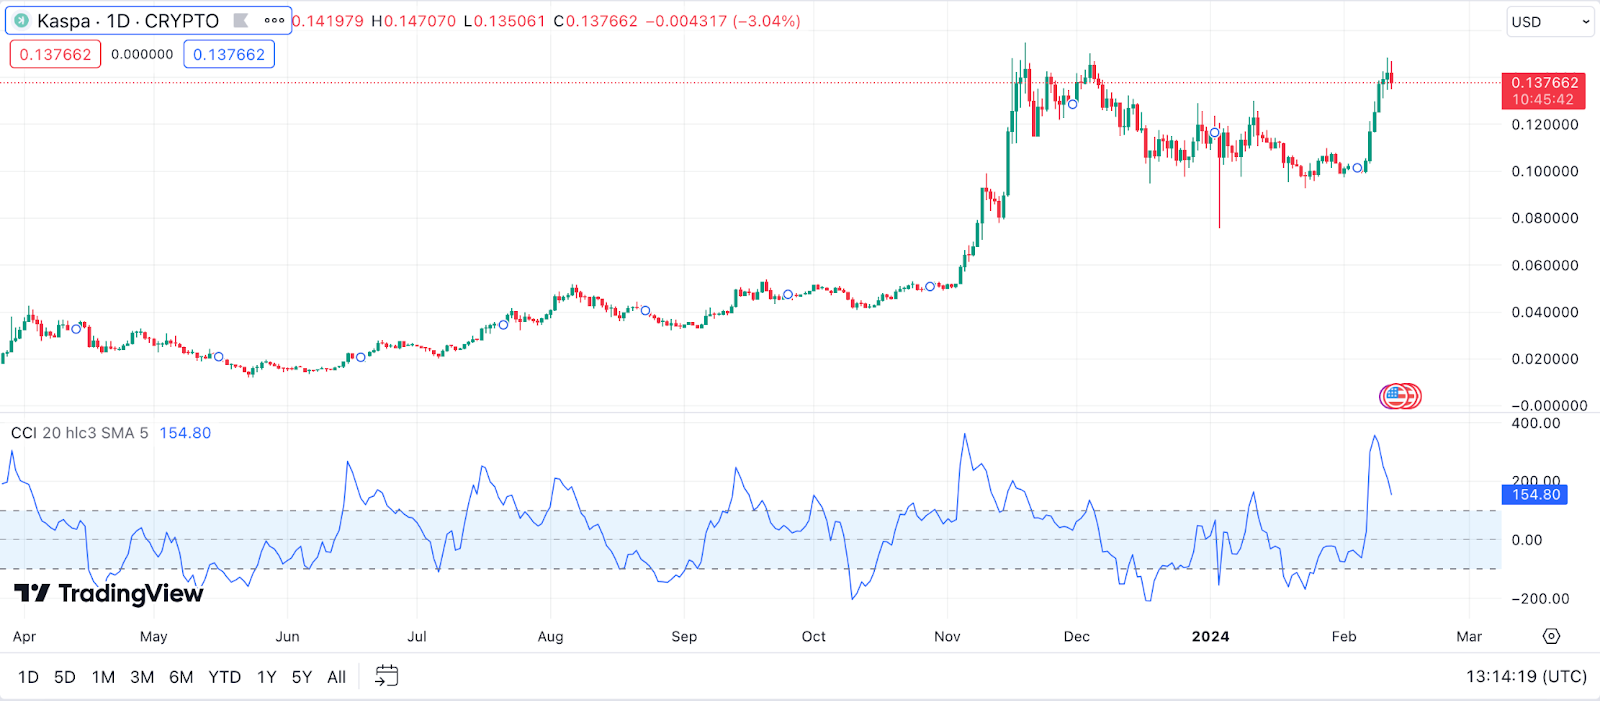
Example: Imagine the CCI for Kaspa plunges below -100, much like a sudden cold snap. This could indicate that KAS is oversold, and the market might be due for a warm-up, potentially leading to a price rebound. It’s akin to noticing the first signs of spring after a long winter, suggesting a thaw might be on the horizon.
Accumulation/Distribution Line (A/D Line) for Kaspa Price Prediction
The Accumulation/Distribution Line (A/D Line) is akin to a ledger, tracking the capital flowing in and out of Kaspa. It’s a tale of accumulation when investors are buying up KAS, pushing the line upward, reminiscent of a gathering crowd before a big event. Distribution, on the other hand, sees the line descend, as if the crowd is dispersing, indicating selling pressure. This ebb and flow offer clues about whether Kaspa is gaining or losing traction among traders.
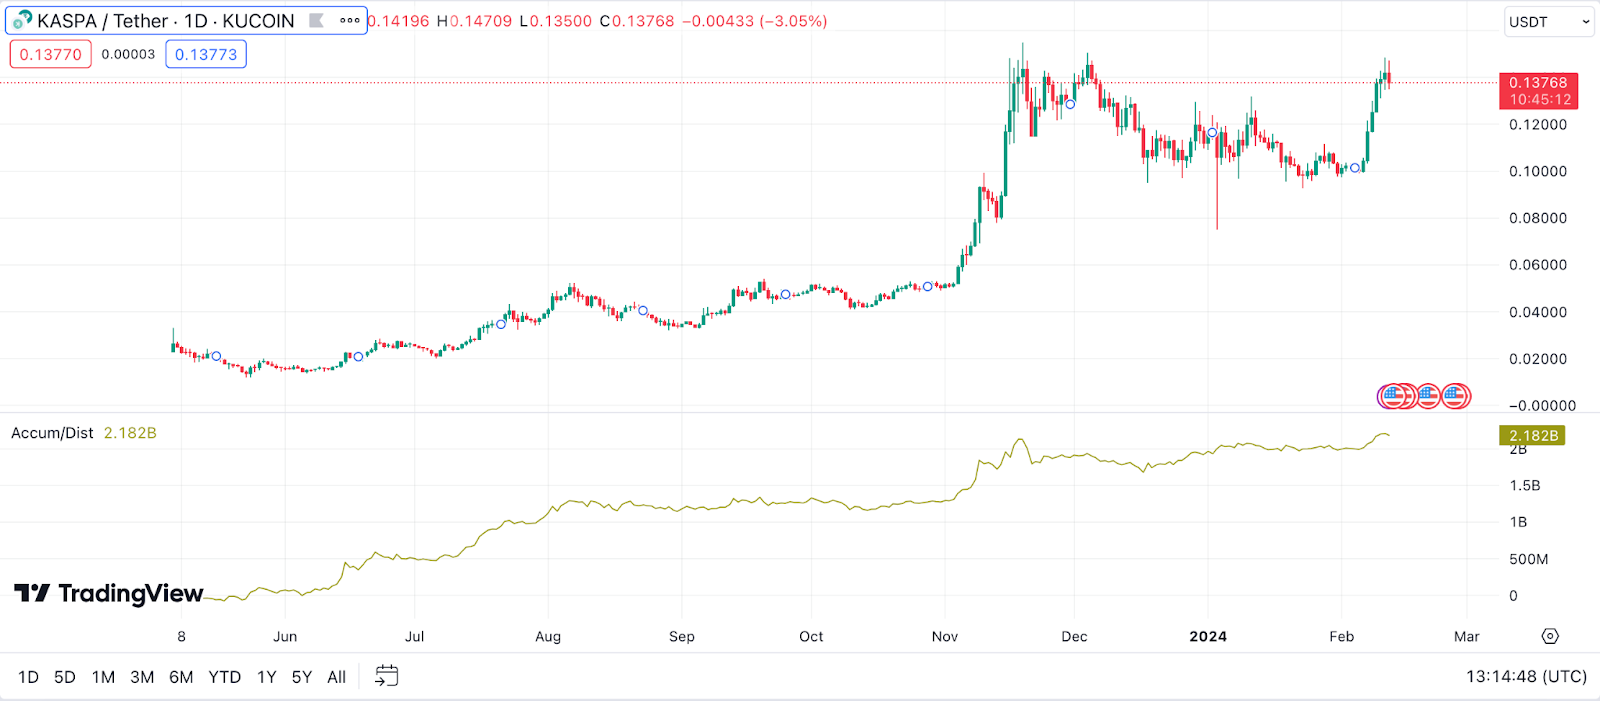
Example: If you spot the A/D Line for Kaspa trending upwards while its price is also climbing, it’s like watching the audience numbers swell at a hit show, suggesting strong buying interest that could propel the price even higher.
Pivot Points for Kaspa Price Prediction
Pivot Points serve as the navigational stars for traders, offering a celestial map of potential support and resistance levels for Kaspa’s price. Calculated using the previous period’s high, low, and close prices, these points mark the terrain, guiding traders on potential turning points. When KAS approaches a pivot point from below, it’s akin to a ship nearing a lighthouse, signaling a possible resistance level; conversely, when descending towards a pivot point, it suggests a potential support level, much like a safety net.
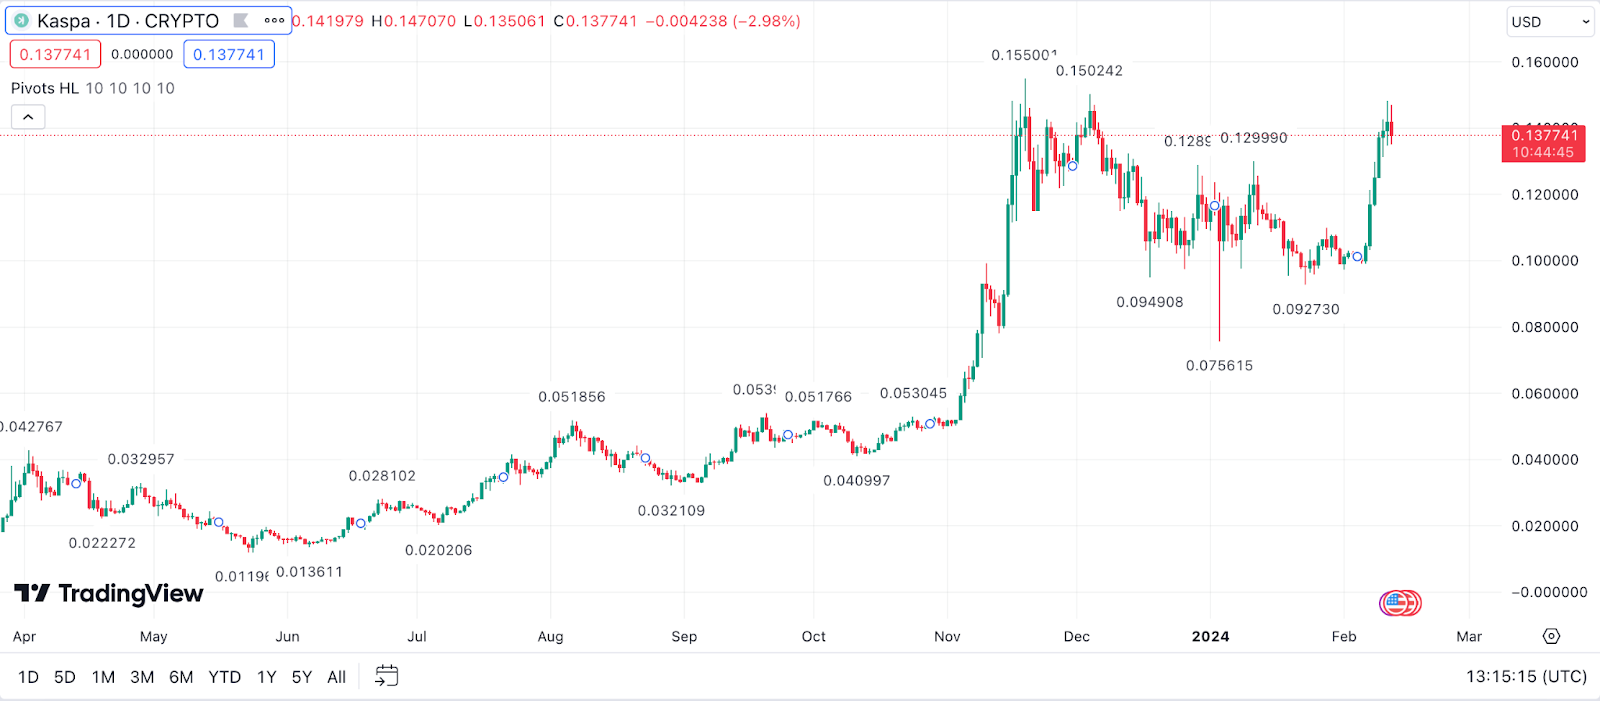
Example: Imagine Kaspa’s price is inching towards an upper pivot point. This moment is like approaching a mountain peak, where the air gets thinner – a place where prices might struggle to climb further, potentially indicating a selling opportunity before a possible descent.
Chaikin Money Flow (CMF) for Kaspa Price Prediction
Chaikin Money Flow (CMF) is like the pulse check for Kaspa, measuring the volume-weighted pressure of buying and selling over a set period. A positive CMF indicates that money is flowing into Kaspa, suggesting buying pressure, much like a rising tide lifting all boats. A negative CMF, conversely, implies money is flowing out, indicative of selling pressure, as if the tide is receding, leaving boats stranded.
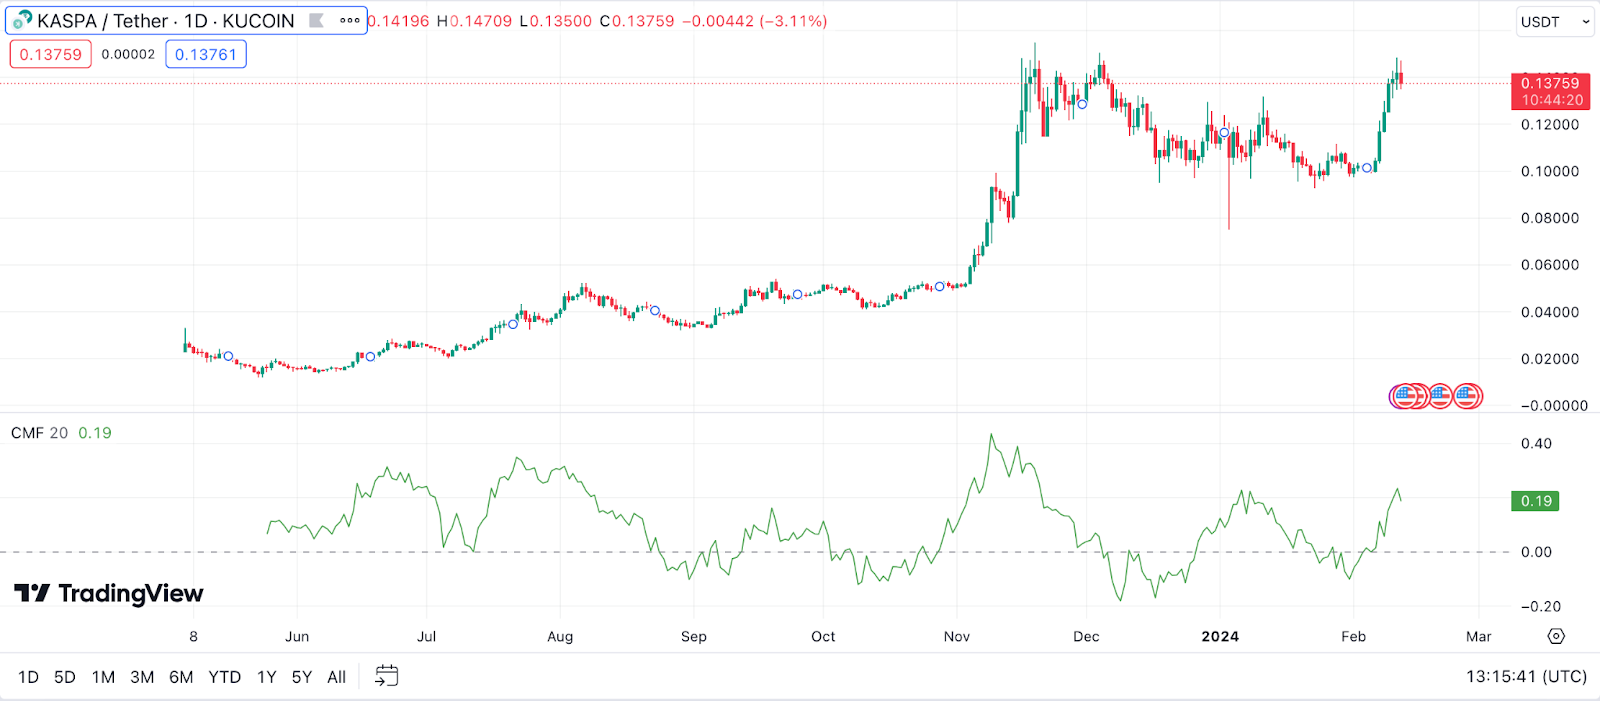
Example: If Kaspa exhibits a sustained positive CMF, it’s akin to a consistent breeze filling the sails of a boat, suggesting that the wind (or buying pressure) is steady and might push the price higher, hinting at continued investor confidence and potential upward movement in KAS prices.
Aroon Indicator for Kaspa Price Prediction
The Aroon Indicator is like your lookout on the crow’s nest, scanning the horizon for signs of Kaspa’s trend strength and direction. It consists of two lines: the Aroon Up, which measures the time since the last high, and the Aroon Down, which measures the time since the last low. When the Aroon Up is high and the Aroon Down is low, it suggests a strong upward trend, much like spotting clear skies and favorable winds for sailing. Conversely, the opposite scenario may signal a strong downward trend, akin to seeing storm clouds gathering.
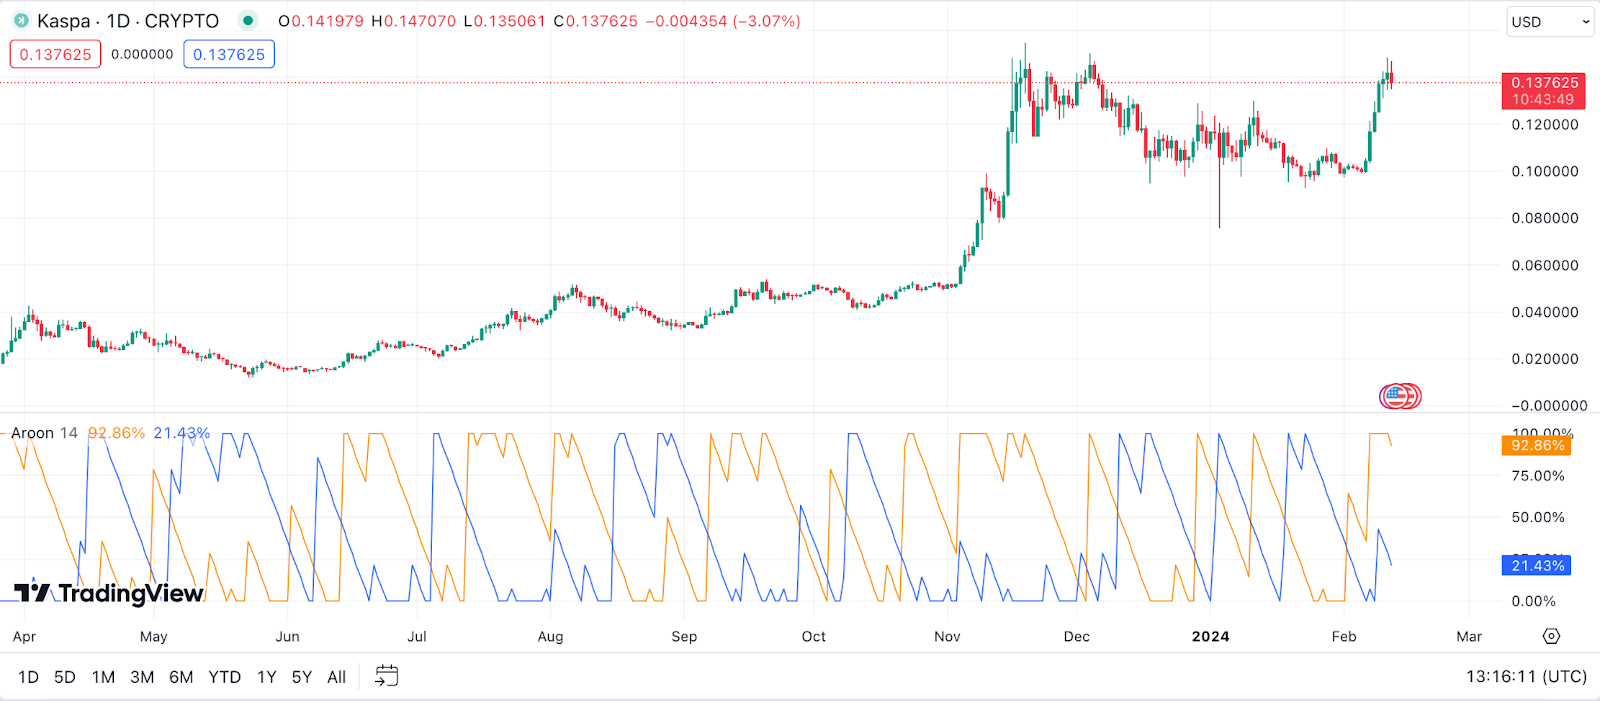
Example: If the Aroon Up line for Kaspa is hovering above 70, indicating that recent highs are relatively fresh, and the Aroon Down line is lagging below 30, it’s like having the wind at your back, suggesting that Kaspa might continue its upward trajectory, offering a potentially opportune moment for traders.
Gann Fan for Kaspa Price Prediction
The Gann Fan is a navigational tool that combines time and price to chart potential support and resistance levels, much like plotting a course using a map and compass. Created by W.D. Gann, this tool draws lines at predetermined angles from a pivot high or low point, helping traders predict price movements by observing where Kaspa’s price intersects with these lines. It’s akin to using landmarks and angles to find your way through uncharted territory.
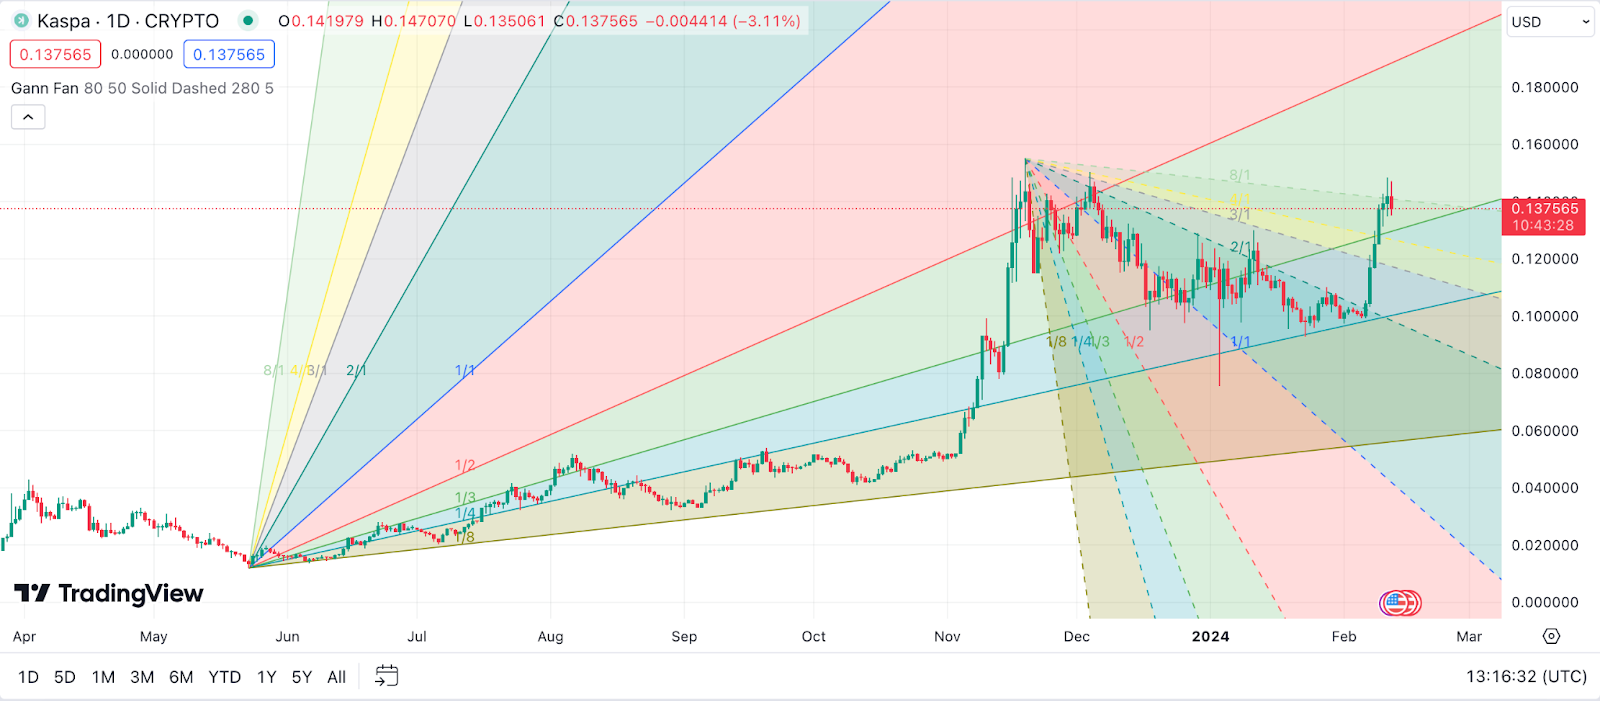
Example: When Kaspa’s price crosses above one of the ascending Gann Fan lines, it could be likened to a ship catching a favorable current, suggesting that Kaspa might continue to sail smoothly upward until it encounters the next line, which could act as a new level of resistance or support.
Keltner Channel for Kaspa Price Prediction
Keltner Channels wrap around Kaspa’s price movements like riverbanks guiding a flowing stream, offering a visual representation of volatility and trend direction. The channel is formed by an upper and lower band, set around an exponential moving average (EMA), providing insights into potential breakout or breakdown moments. When KAS price breaks above the upper channel, it’s akin to a river overflowing its banks, suggesting a strong upward momentum. Conversely, a break below the lower channel might indicate a strong downward push, as if the river’s course is deepening.
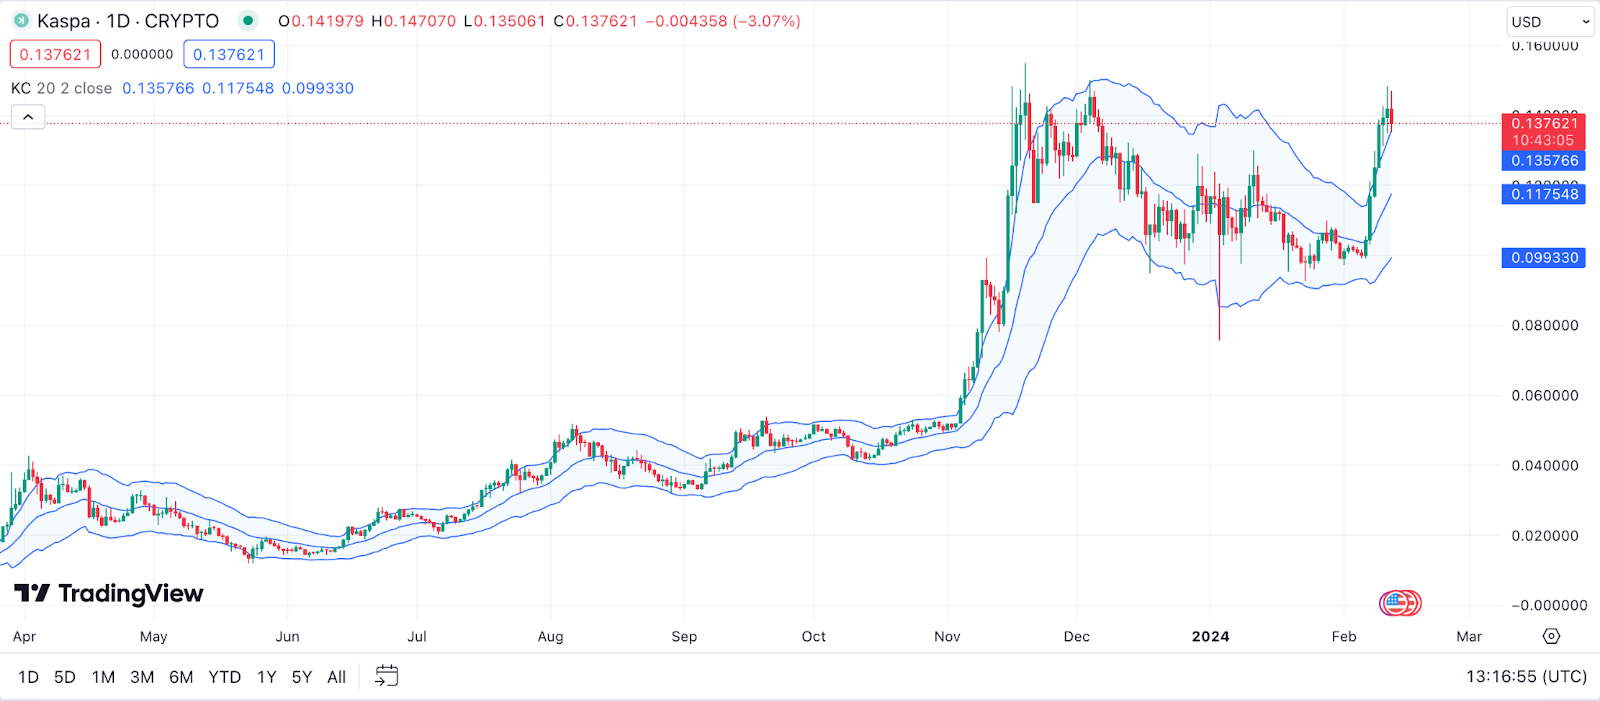
Example: If you observe Kaspa’s price bursting through the upper Keltner Channel, it’s like witnessing a dam breach, indicating strong buying pressure that could propel the price further upwards. This breakout could be a signal for traders to consider riding the wave of momentum, anticipating further gains as long as the price remains above the channel.
Money Flow Index (MFI) for Kaspa Price Prediction
The Money Flow Index (MFI) acts as the market’s pulse, blending price and volume to gauge the pressure of buying and selling Kaspa. Think of it as assessing the crowd’s enthusiasm at a market stall: a high MFI suggests a lot of eager buyers, akin to a bustling crowd, indicating strong demand and potential price increases. A low MFI, conversely, suggests dwindling interest, as if the crowd is dispersing, possibly heralding a price drop.
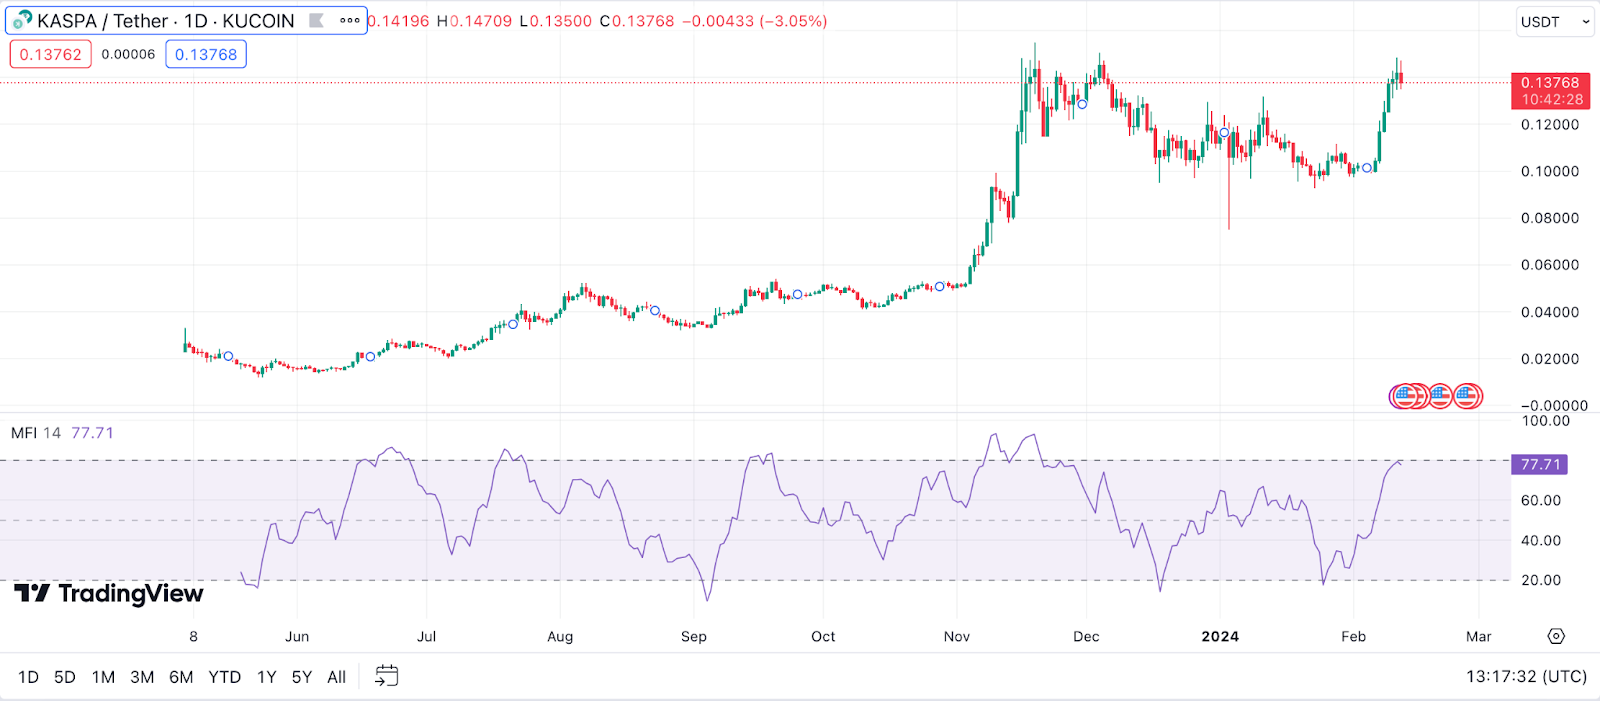
Example: When Kaspa’s MFI climbs above 80, it’s like a packed venue with an electric atmosphere, signaling that Kaspa might be overbought and a cooling-off period could be imminent. This could be a cue for traders to tread carefully, considering taking profits before a potential downturn.
TRIX for Kaspa Price Prediction
TRIX is a momentum oscillator that smooths out price fluctuations to highlight underlying trends in Kaspa’s price, much like ironing out wrinkles to see the fabric’s true pattern. It’s particularly adept at identifying significant trend reversals, with a positive TRIX indicating growing momentum and a negative TRIX suggesting fading strength.

Example: If you notice the TRIX line for Kaspa ticking upwards from negative to positive territory, it’s akin to feeling a shift in the wind’s direction, suggesting that Kaspa’s price might be gearing up for an upward trend. This could be an opportune moment for traders to set their sails for a potential bullish journey.
The Zig Zag Indicator for Kaspa Price Prediction
The Zig Zag indicator simplifies price movements by filtering out minor fluctuations to show only significant trends, much like tracing the main storyline through a complex novel. This clarity helps traders identify pivotal highs and lows, providing a clearer perspective on Kaspa’s market direction.
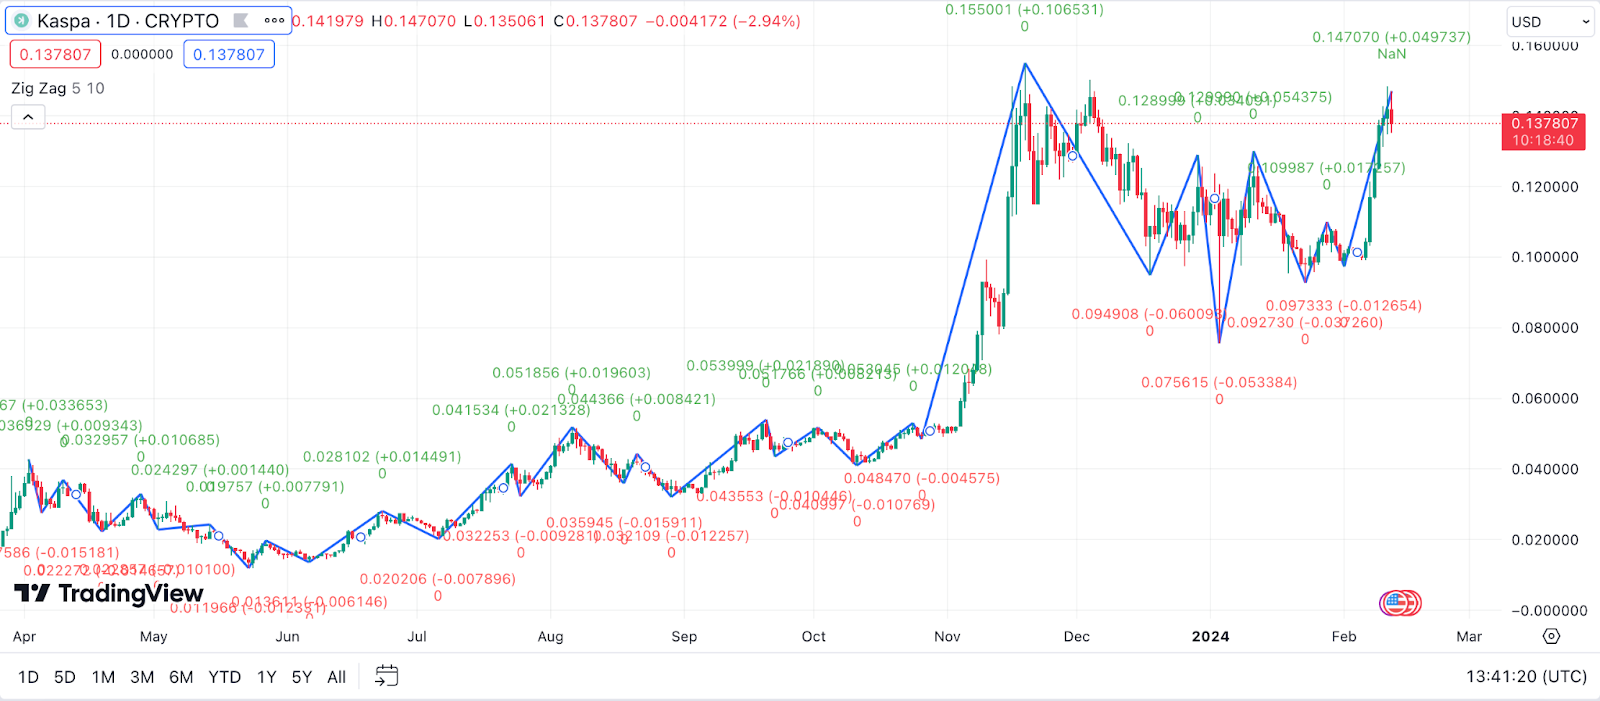
Example: Observing Kaspa’s price chart with the Zig Zag indicator might reveal a pattern of higher highs and higher lows, akin to climbing a staircase, indicating an uptrend. This could signal traders that the overall path for Kaspa is upwards, suggesting a favorable climate for long positions, akin to ascending a hill with the wind at your back.
Detrended Price Oscillator (DPO) for Kaspa Price Prediction
The Detrended Price Oscillator (DPO) is akin to taking a step back to admire a painting, removing the immediate trend from the picture to better observe the cycles and patterns within Kaspa’s price movements. By focusing on peaks and troughs, the DPO helps identify the underlying rhythm of the market, much like a musician finding the beat in a complex piece of music.
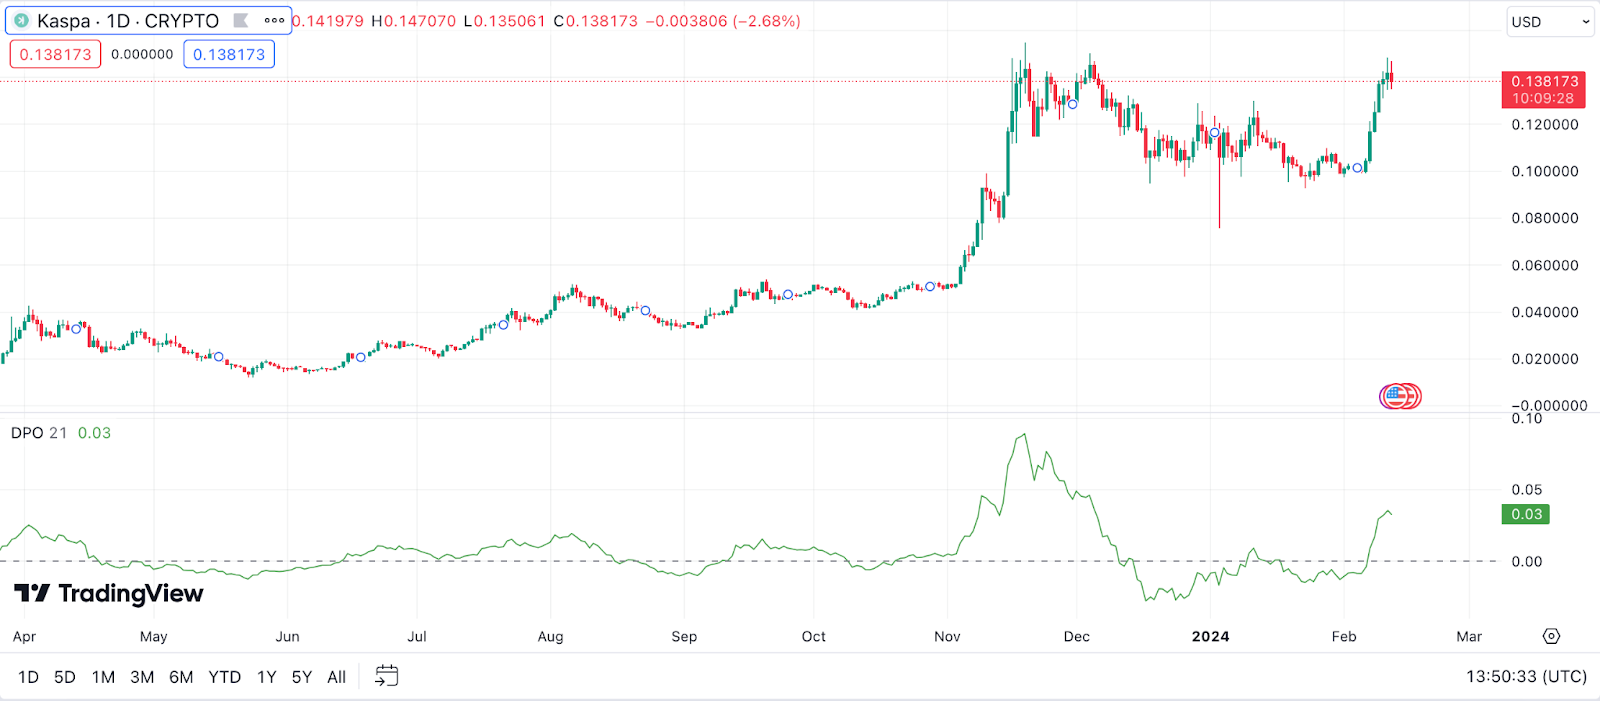
Example: If Kaspa’s DPO shows a consistent pattern of peaks, it’s like catching the rhythm of a drumbeat, signaling a potential cyclical upswing in price. This rhythmic insight could offer traders a chance to synchronize their strategies with the market’s natural oscillations, aiming for optimal entry and exit points.
Vortex Indicator (VI) for Kaspa Price Prediction
The Vortex Indicator (VI) swirls through Kaspa’s price data to highlight the start of new trends and the intensity of current ones, much like a weather vane spinning to catch the wind’s direction. With its twin lines, VI+ for upward trends and VI- for downward trends, the VI can signal a changing market climate when these lines cross, offering traders a glimpse into potential shifts in market sentiment.
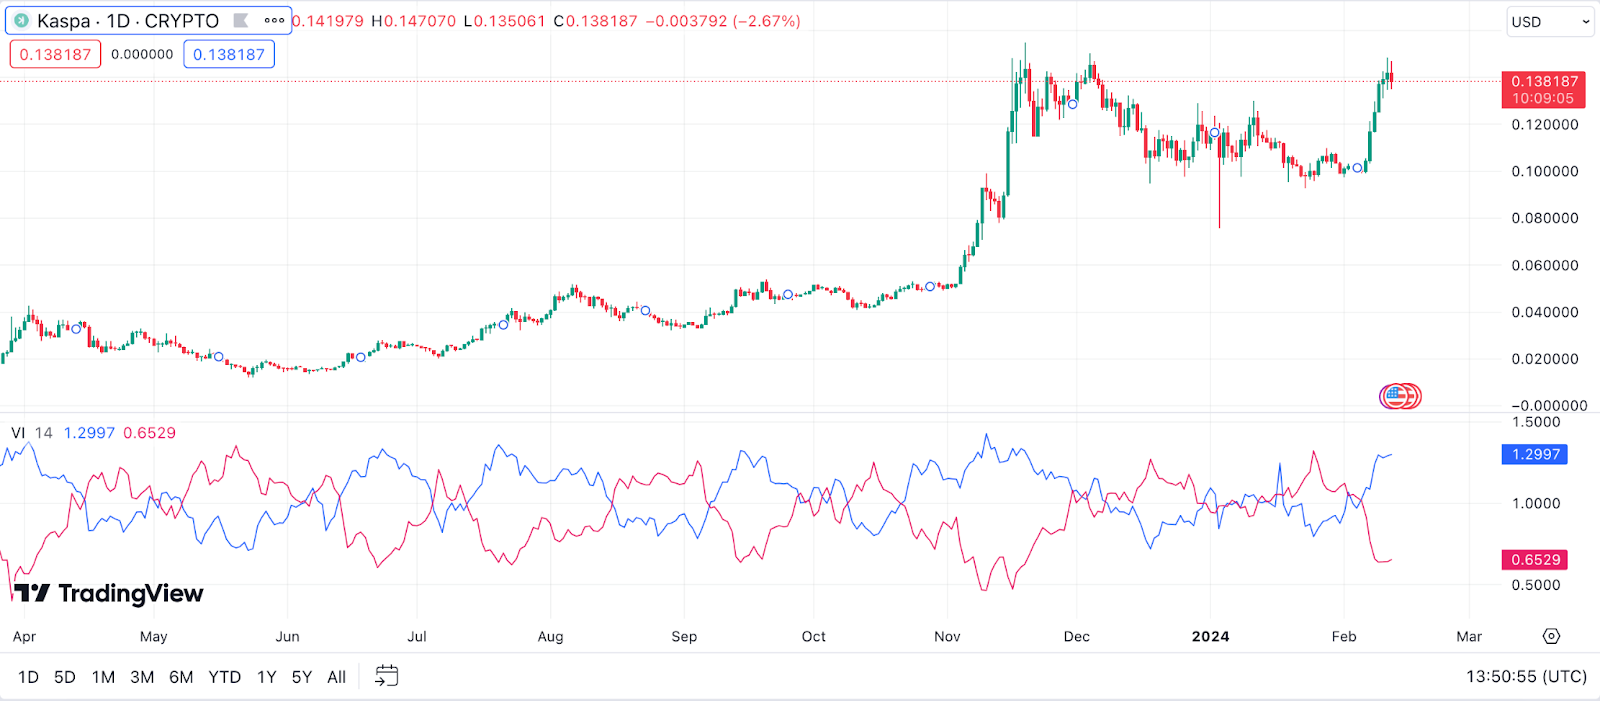
Example: When the VI+ line for Kaspa crosses above the VI- line, it’s as if a gust of wind has shifted direction, suggesting a burgeoning upward trend. Traders might see this as a sign to hoist their sails, preparing to catch the favorable wind on their investment journey with Kaspa.
Elder’s Force Index (EFI) for Kaspa Price Prediction
Elder’s Force Index (EFI) combines price change, direction, and volume to measure the ‘force’ behind Kaspa’s market movements, akin to measuring the strength of a current in a river. This indicator can help traders discern whether the buying or selling pressure is driving the price, offering insights into the potential continuation or reversal of current trends.
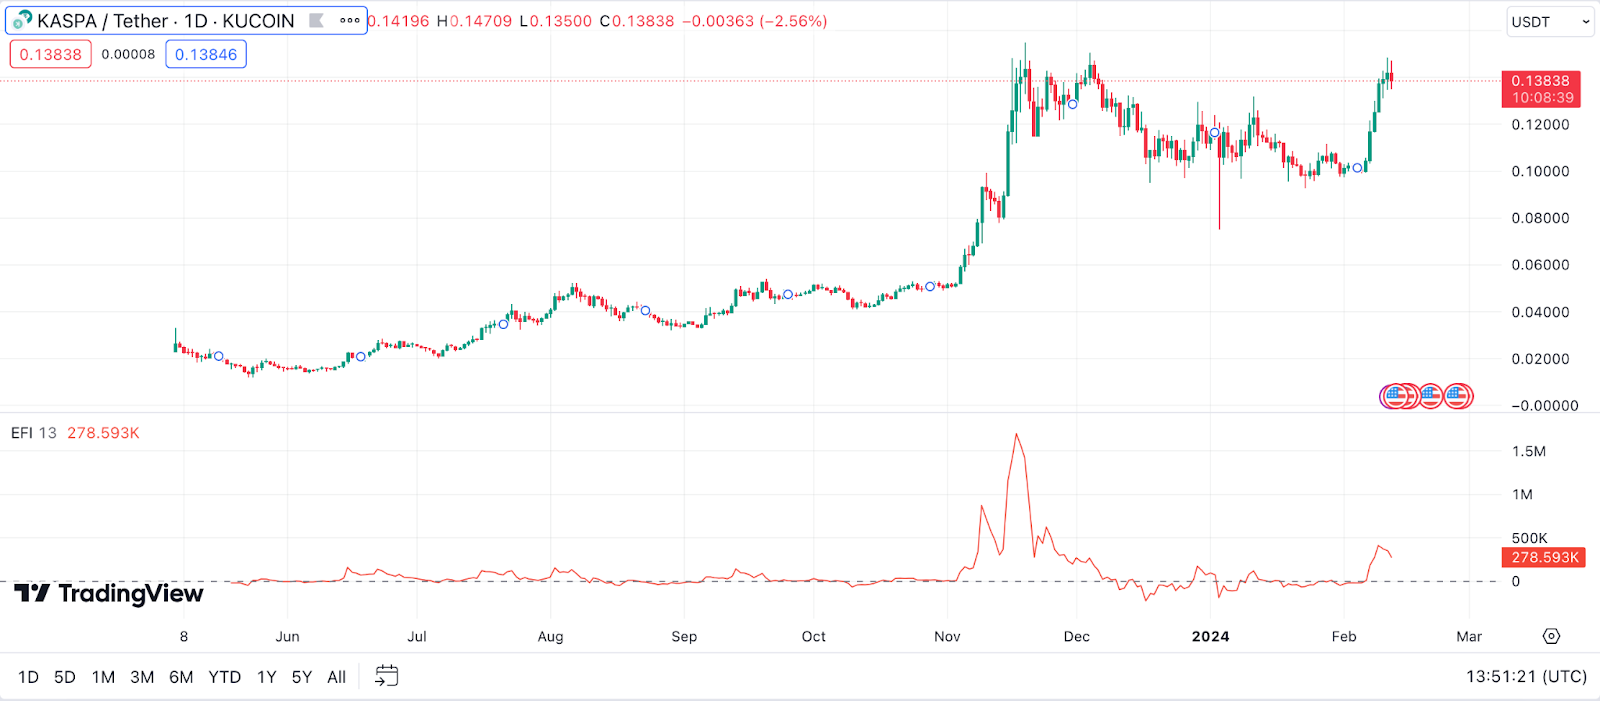
Example: A rising EFI alongside an increasing Kaspa price could be likened to a strong current pushing a boat effortlessly downstream, indicating strong buying pressure that might support further price increases. This scenario suggests that traders might want to stay aboard, riding the current for as long as it remains strong.
Williams %R for Kaspa Price Prediction
Williams %R, akin to a high-speed roller coaster, gauges the momentum of Kaspa’s price by comparing its closing price to the high-low range over a specific period. This indicator oscillates between 0 and -100, where readings above -20 signal that Kaspa might be overbought (like a coaster cresting its peak), suggesting a potential price pullback. Conversely, readings below -80 indicate oversold conditions (as if the coaster is plunging), hinting at a possible price rebound.
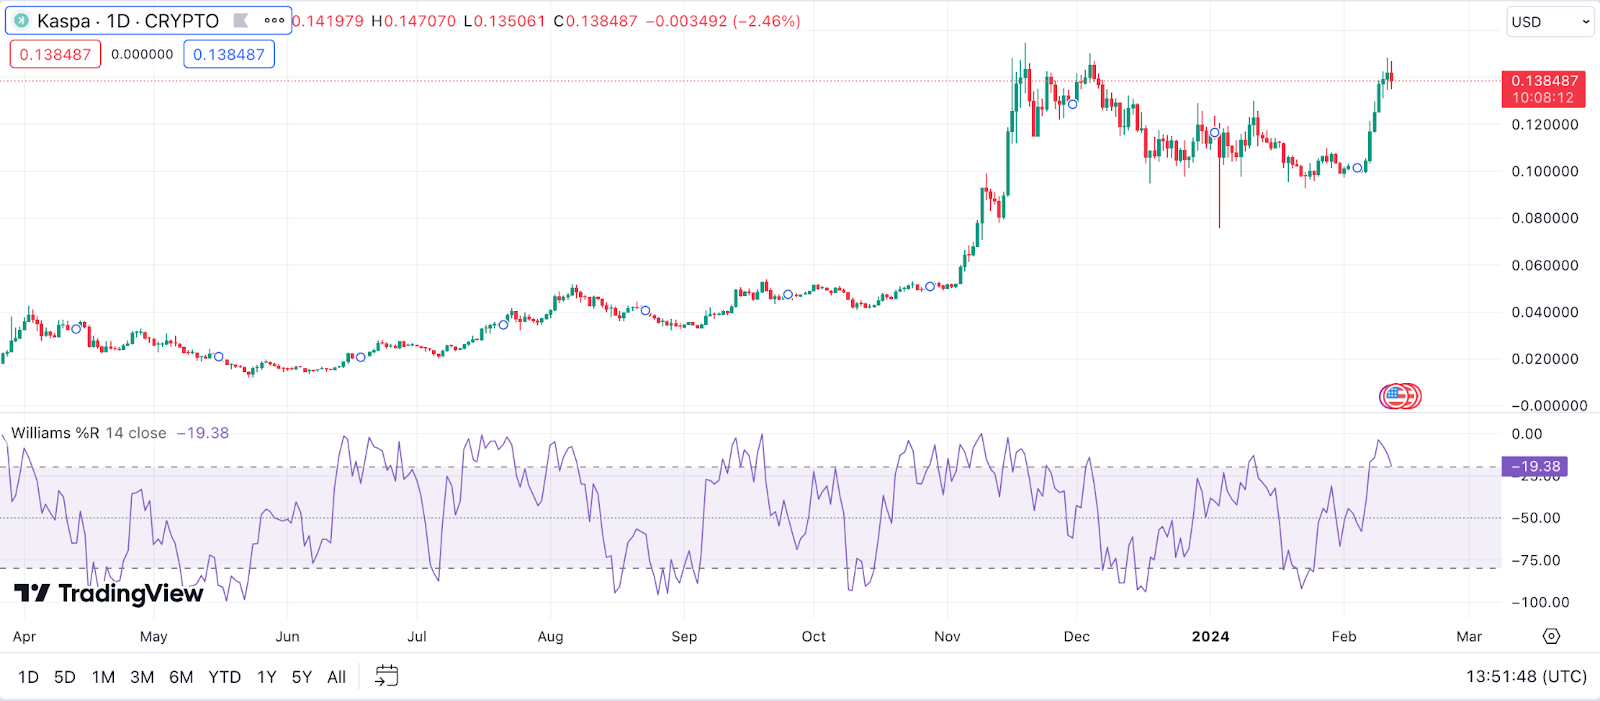
Example: If Kaspa’s Williams %R plunges below -80, it’s as though the ride has hit a thrilling low point, suggesting that Kaspa might be undervalued and could soon begin its climb again. Savvy traders might view this as a signal to strap in and prepare for the exhilarating ride back up, anticipating a potential increase in KAS price as the market corrects from the oversold condition.
Combining Technical Indicators for Accurate Kaspa Price Prediction
Diving into the world of Kaspa price prediction is a bit like becoming a master chef in the bustling kitchen of the financial markets. Just as a chef uses a blend of spices to perfect a dish, a savvy trader combines various technical indicators to cook up a precise market analysis. Let’s unwrap this culinary mystery and see how mixing the right ingredients can lead to a mouth-watering forecast.
The Importance of Using Multiple Technical Indicators
Relying on a single technical indicator to guide your trading decisions is like trying to understand a story by reading only one page of a book. Each indicator, with its unique perspective on market behavior, adds a layer of depth to your analysis. By weaving together different strands of data, you create a richer, more nuanced tapestry of the market’s potential movements, enhancing your ability to make informed investment decisions.
How to Combine Various Indicators for a Comprehensive Analysis
Creating a harmonious blend of technical indicators is an art form. Here are a few tips to help you master this art and apply it to your Kaspa trading strategy:
- Start with Trend Indicators: Begin by establishing the general direction of the market. Tools like Moving Averages or the MACD can serve as your foundation, offering a clear view of whether Kaspa is in an uptrend, downtrend, or sideways movement.
- Add Momentum Indicators: Once you’ve got a handle on the trend, spice things up with momentum indicators like the RSI or Stochastic Oscillator. These will help you gauge the strength of the trend and identify potential reversal points.
- Incorporate Volume Indicators: Volume speaks volumes. Indicators such as the On Balance Volume (OBV) or Chaikin Money Flow (CMF) can provide insights into the buying and selling pressure behind price movements, adding another layer to your analysis.
- Refine with Volatility Indicators: Volatility is the market’s mood swing, and tools like Bollinger Bands or the Average True Range (ATR) can help you understand the emotional range of the market, from calm to tempestuous.
- Fine-tune with Oscillators: Oscillators like the Aroon Indicator or the Detrended Price Oscillator (DPO) can help identify short-term overbought or oversold conditions, allowing for precision tuning of entry and exit points.
- Season with Customization: Finally, don’t forget to tailor your analysis to your personal trading style and risk tolerance. Adjust the settings of each indicator to match the time frames and market conditions you’re most comfortable with.
By combining these varied indicators, you’re not just making random guesses; you’re conducting a symphony of data that sings the true story of Kaspa’s market movements. This comprehensive approach offers a 360-degree view, turning whispers of market trends into a chorus of actionable insight.
The Pillars of Kaspa Prediction: Fundamental Factors
Peering into Kaspa’s crystal ball isn’t just about chart patterns and technical jargon. It’s also about getting down to the brass tacks of what fundamentally drives KAS value. Let’s unwrap these core pillars, much like unraveling the layers of a mystery novel, to understand the true narrative of Kaspa’s potential.
Adoption Rate
Gauging the adoption rate of Kaspa is akin to mapping the growth of a bustling city. Beyond the basics, here are more facets to consider when evaluating KAS expanding territory:
- Mainstream Acceptance: Keep an eye out for Kaspa’s adoption by non-crypto businesses for payments or other services. Each new adoption is a brick in the foundation of KAS real-world utility.
- Educational Initiatives: Efforts to educate the public and developers about Kaspa can foster a more knowledgeable and engaged community, accelerating adoption.
- Tech Upgrades and Scalability: Watch for updates that improve Kaspa’s scalability and user experience. A network that can handle more transactions at lower costs is more likely to attract users.
- Media Coverage: Positive media exposure can significantly boost Kaspa’s profile, drawing in new users curious about its potential.
- Community Projects: Grassroots projects and community-led initiatives can also be strong indicators of a vibrant and growing ecosystem, signaling deeper adoption.
Monitoring these indicators can provide a holistic view of Kaspa’s adoption rate, offering clues to its long-term viability and potential for price appreciation. It’s about piecing together the narrative of Kaspa’s journey from niche to mainstream, one user, partnership, and innovation at a time.
Regulatory Developments
The impact of regulatory developments on Kaspa extends far beyond mere compliance; it shapes the very landscape in which KAS operates. Here are additional considerations to keep in mind:
- Global Regulatory Trends: Keep a pulse on the international regulatory scene. A shift towards more crypto-friendly policies in major economies can act as a tailwind for Kaspa, enhancing its global standing and investor appeal.
- Central Bank Digital Currency (CBDC) Initiatives: The introduction of CBDCs could redefine the crypto space. Kaspa’s compatibility or interoperability with these digital currencies could open new avenues for adoption and use.
- Anti-Money Laundering (AML) and Know Your Customer (KYC) Standards: As Kaspa navigates the evolving AML and KYC landscape, its ability to adapt and comply can reinforce its legitimacy and attract institutional investors.
- Privacy Regulations: With increasing scrutiny on user privacy, Kaspa’s alignment with privacy standards could influence its adoption, particularly in regions with stringent data protection laws.
- Crypto Taxation Policies: Changes in how cryptocurrencies are taxed can significantly affect investor sentiment towards Kaspa. Clarity and favorable tax treatment can encourage investment, while ambiguity or heavy taxation might deter it.
Navigating these regulatory waters requires vigilance and adaptability. For Kaspa, staying ahead of regulatory curves not only ensures compliance but can also unlock strategic advantages, positioning KAS as a resilient and forward-thinking player in the crypto realm.
Utility
The utility of Kaspa stretches across various domains, acting as a cornerstone for its intrinsic value. Delving deeper into its applications:
- Peer-to-Peer Transactions: Kaspa’s potential for facilitating direct transactions between users without intermediaries can revolutionize traditional payment systems, making it a valuable tool for decentralized finance.
- Supply Chain Management: By leveraging Kaspa’s blockchain, businesses could achieve greater transparency and efficiency in tracking the movement of goods, from production to delivery.
- Gaming and Virtual Goods: Kaspa could find a niche in the gaming industry, enabling secure and verifiable transactions for in-game assets and virtual goods, enhancing the gaming experience and economy.
- Identity Verification: With its secure framework, Kaspa could play a role in digital identity verification processes, offering a more secure and efficient alternative to traditional methods.
- Energy Trading: Kaspa’s technology could be applied to decentralized energy trading platforms, allowing for more efficient and transparent transactions in renewable energy markets.
By tapping into these diverse use cases, Kaspa not only broadens its appeal but also solidifies its position as a versatile and indispensable asset in the digital age, potentially driving its adoption and value higher.
Market Sentiment: How KAS News Prediction Works
Deciphering the market sentiment towards Kaspa involves more than just reading headlines; it’s about understanding the narrative woven through various channels and its impact on the collective investor psyche. Expanding on the tools and factors to gauge KAS sentiment:
- Analytical Platforms: Utilize platforms that aggregate and analyze Kaspa-related news from multiple sources, providing a comprehensive view of the prevailing sentiment, whether bullish or bearish.
- Investor Forums and Discussion Boards: Dive into forums and crypto discussion boards where Kaspa investors and enthusiasts gather. The tone and content of discussions can offer grassroots insights into the community’s confidence and concerns.
- Keyword Tracking: Monitor the frequency and context of Kaspa-related keywords across social media and news platforms. A surge in positive keywords could indicate growing interest and optimism.
- Comparison with Competitors: Assess how Kaspa is being discussed in comparison to its competitors. A favorable comparison can boost investor confidence, while negative mentions might signal caution.
- Event and Announcement Reactions: Observe the market’s response to Kaspa-related events or announcements. The immediacy and direction of the price movement post-announcement can be telling of the market’s sentiment.
By weaving together these diverse strands of information, investors can form a more nuanced picture of the market’s sentiment towards Kaspa, aiding in more informed decision-making and strategy development in the ever-volatile crypto landscape.
The Bottom Line: Making Your Own Kaspa Price Predictions
As we wrap up this deep dive into Kaspa price predictions, it’s been quite the journey. We’ve sifted through the expert opinions, dissected the charts with technical analysis, and delved into the core fundamentals that drive Kaspa’s value. It’s been a bit like assembling a complex puzzle, where each piece – from adoption rates to regulatory landscapes, from utility to market sentiment – contributes to the bigger picture.
Remember, while predictions offer a glimpse into potential futures, the crypto world is always full of surprises. Keep your wits about you, stay informed, and let this blend of insights guide you as you navigate the ever-shifting sands of the Kaspa ecosystem. Happy trading!
FAQ
When Will KAS Go Up?
Ah, the million-dollar question! While I don’t have a crystal ball, the trajectory of KAS hinges on a mix of market dynamics, technological advancements, and broader crypto sentiment. If Kaspa continues to innovate and gain traction in real-world applications, we might see a positive shift. Keep an eye on those market trends and news updates; they’re your breadcrumbs on this journey.
Should I Buy KAS?
Deciding to buy KAS is like choosing a new adventure. Consider your appetite for risk, your investment horizon, and how Kaspa fits into your broader portfolio. Dive into the project’s fundamentals, and don’t shy away from seeking diverse opinions. Remember, every investment carries its own set of risks and opportunities, so tread with care and informed enthusiasm.
How High Can KAS Go?
Speculating on KAS peak is a bit like forecasting the summit of an unclimbed mountain. Its potential height is influenced by factors like adoption rates, technological breakthroughs, and the ebb and flow of crypto market sentiment. Historical data and current trends can offer clues, but the crypto world is full of surprises. Strap in and stay updated; it’s going to be an interesting climb.
Will KAS Crash Again in 2024?
Crypto markets are known for their volatility, and KAS is no exception. While past performance can offer some insights, predicting a crash is a complex affair, intertwined with global economic conditions, regulatory changes, and investor behavior. The best approach? Keep your portfolio diversified, stay informed, and be prepared for all weather conditions in the crypto landscape.