Hello, dear readers! Today, we’re diving into an exciting and challenging topic that’s been on the minds of many in the crypto community: Conflux price prediction for 2024-2030. Understanding the future trajectory of CFX’s value is no small feat. With this in mind, our article aims to provide a comprehensive look into the world of Conflux, covering its origins, purpose, and the fascinating journey it has embarked on in the crypto landscape.
Predicting the price of CFX is a complex endeavor, blending art and science. In our exploration, we’ll delve into the tools and techniques employed by seasoned traders and analysts. These methods, ranging from technical analysis to expert opinions, shed light on the potential future of CFX. We’ll navigate through the intricate world of crypto forecasting, aiming to demystify the process for both novices and veterans alike.
Why is predicting the value of CFX so crucial, you ask? The answer lies in the heart of good investment strategy and market dynamics. Understanding the potential shifts in CFX’s value is key to making informed decisions, whether you’re a long-term investor or a day trader. It’s about grasping the pulse of the cryptocurrency market and anticipating the waves before they happen.
So, buckle up and join us on this enlightening journey. Whether you’re a crypto enthusiast, a seasoned investor, or just curious about the buzz around Conflux, our in-depth analysis promises insights and perspectives that are sure to enrich your understanding. Keep reading, as we unravel the mysteries of CFX’s future together!
Conflux (CFX) Overview
| CFX Price | $0.0962 |
| CFX Price Change 24h | 23.05% |
| CFX Price Change 7d | 31.77% |
| CFX Market Cap | $490,897,667.32 |
| CFX Circulating Supply | 5,103,582,504.64 |
| CFX Trading Volume | $90,226,339.80 |
| CFX All-Time High (ATH) | $1.70 |
| CFX All-Time Low (ATL) | $0.02191 |
A Brief History: Conflux and Its Purpose
Let’s talk about Conflux – it’s a name you’ve probably heard buzzing around in the crypto community. You know, Conflux isn’t just another coin in the vast sea of cryptocurrencies; it’s a game-changer with a mission. Born from a blend of innovative minds and a thirst for solving the big blockchain puzzles, Conflux is more than a currency; it’s a vision.
So, why did Conflux come to life? Picture this: we’re in a world where blockchain technology is like a rough diamond – immense potential, yet needing some fine-tuning. High transaction fees, slower than snail transactions, and the big debate of scalability vs. security were the talk of the town. Enter Conflux, with its revolutionary Tree-Graph consensus mechanism, saying, “Hold my beer!” This tech was like a breath of fresh air, offering the speed of a sports car while keeping the ride as secure as a vault.
But hey, Conflux isn’t just about solving tech puzzles. It’s got bigger dreams – to knit together a world where decentralized apps flow freely, where different blockchains shake hands seamlessly, and where digital economies bloom. We’re not just talking coins here; we’re talking about creating a universe where value and information dance together in harmony.
And let’s not forget the folks who bring life to Conflux – the developers. Conflux has thrown open its doors wide, inviting innovators and creators to play, experiment, and contribute. It’s like a never-ending tech party where everyone’s invited to make something cool.
Notable Price Fluctuations of CFX
The journey of CFX’s value in the market has been anything but linear. Here are some significant movements in its price:
- A Meteoric Rise: There was a period when the CFX coin saw a rapid increase in value, catching the attention of investors worldwide.
- Unforeseen Dips: Just as it soared, CFX also experienced unexpected drops, testing the resolve of its holders.
- Gradual Recoveries: Following the downturns, CFX showed resilience with steady recoveries, reflecting the underlying strength of Conflux’s technology and community.
- Stabilization Phases: Between the highs and lows, there were moments of relative stability, offering a breather to the market.
Conflux – CFX Price Prediction For Today, Tomorrow, This Week, Next Week, and Next 30 Days
| Date | Price | Change |
|---|---|---|
| July 12, 2025 | 0.0956 | -0.66% |
| July 13, 2025 | 0.0950 | -0.62% |
| July 14, 2025 | 0.0956 | 0.70% |
| July 15, 2025 | 0.0954 | -0.22% |
| July 16, 2025 | 0.0945 | -0.95% |
| July 17, 2025 | 0.0952 | 0.77% |
| July 18, 2025 | 0.0955 | 0.25% |
| July 19, 2025 | 0.0959 | 0.47% |
| July 20, 2025 | 0.0953 | -0.62% |
| July 21, 2025 | 0.0948 | -0.58% |
| July 22, 2025 | 0.0954 | 0.69% |
| July 23, 2025 | 0.0955 | 0.02% |
| July 24, 2025 | 0.0963 | 0.92% |
| July 25, 2025 | 0.0956 | -0.75% |
| July 26, 2025 | 0.0954 | -0.22% |
| July 27, 2025 | 0.0960 | 0.67% |
| July 28, 2025 | 0.0966 | 0.53% |
| July 29, 2025 | 0.0957 | -0.85% |
| July 30, 2025 | 0.0950 | -0.73% |
| July 31, 2025 | 0.0950 | -0.04% |
| August 01, 2025 | 0.0956 | 0.63% |
| August 02, 2025 | 0.0951 | -0.48% |
| August 03, 2025 | 0.0944 | -0.76% |
| August 04, 2025 | 0.0953 | 0.95% |
| August 05, 2025 | 0.0953 | -0.01% |
| August 06, 2025 | 0.0958 | 0.48% |
| August 07, 2025 | 0.0955 | -0.25% |
| August 08, 2025 | 0.0951 | -0.47% |
| August 09, 2025 | 0.0956 | 0.59% |
| August 10, 2025 | 0.0956 | -0.04% |
Conflux Price Prediction 2024
Jumping into the 2024 Conflux forecast has been an adventure, kind of like unravelling a mystery in a gripping novel. Here I am, your crypto guide, diving deep into the sea of data and trends to fish out the future of Conflux. And let me tell you, it’s shaping up to be quite an exhilarating journey.
Now, plot twist alert! It seems Conflux might experience a slight dip, possibly down to $0.0866. But don’t let that shake you up. The real head-turner here is the possibility of Conflux averaging a nifty $0.1010. And for those who love a bit of a thrill, there’s a scenario where Conflux could soar to a high of $0.1154.
From my perspective, the 2024 forecast for Conflux seems optimistic. We’re not anticipating those gut-wrenching, hold-your-breath kind of fluctuations. Rather, it’s shaping up to be a gradual, steady climb, like trekking up a serene hillside. If you’re the adventurous type, always on the lookout for a bit of crypto thrill, Conflux might be your ticket to excitement.
But, let’s not throw caution to the wind. If you’re gearing up to dive deep with Conflux, it’s wise to wade in slowly. Remember, the crypto universe can switch from calm to chaotic in a heartbeat. The mantra here? Engage in thorough research and plenty of it.
| Month | Minimum Price | Average Price | Maximum Price |
|---|---|---|---|
| February 2024 | 0.2158 | 0.2241 | 0.2333 |
| March 2024 | 0.2216 | 0.2301 | 0.2396 |
| April 2024 | 0.2276 | 0.2364 | 0.2460 |
| May 2024 | 0.2338 | 0.2427 | 0.2527 |
| June 2024 | 0.2401 | 0.2493 | 0.2595 |
| July 2024 | 0.2465 | 0.2560 | 0.2665 |
| August 2024 | 0.2532 | 0.2629 | 0.2737 |
| September 2024 | 0.2600 | 0.2700 | 0.2811 |
| October 2024 | 0.2671 | 0.2773 | 0.2887 |
| November 2024 | 0.2743 | 0.2848 | 0.2965 |
| December 2024 | 0.2817 | 0.2925 | 0.3045 |
| January 2025 | 0.2893 | 0.3004 | 0.3127 |
January 2024: Conflux Price Forecast
As we embark on a new year, the forecasting models suggest a sturdy beginning for Conflux with a minimal price of $0.1983, an average hovering around $0.2158, and a potential spike to a maximum price of $0.2241. This indicates a bullish outset for investors, suggesting that CFX’s fundamentals are gaining solid ground within the crypto community.
CFX Price Forecast for February 2024
In February, the Conflux market is expected to show signs of steady growth. With the minimum price projected at $0.2158, the average price at $0.2241, and reaching a maximum price of $0.2333, it seems that a bullish sentiment could be setting in. Investors might consider this a signal for a moderate buying opportunity, keeping an eye on market trends for any changes.
March 2024: Conflux Price Forecast
March looks promising for Conflux, with the price forecast showing a slight uptick. The minimum price is seen at $0.2216, while the average price could hover around $0.2301. The maximum price could reach $0.2396, indicating that Conflux might be gaining momentum. This could potentially attract more attention from the investors looking for growth.
CFX Price Forecast for April 2024
April’s forecast for Conflux suggests a continuation of the upward trend. With a minimum price of $0.2276, an average price expected to be at $0.2364, and a maximum price that could push to $0.2460, it appears that investor confidence might be increasing. This month could be crucial for traders to strategize their positions.
May 2024: Conflux Price Forecast
Heading into May, Conflux’s price prediction reflects a stronger market with the minimum price moving up to $0.2338. The average price is expected to rise to $0.2427, and the maximum price might break through to $0.2527. This month may well indicate a more aggressive bullish run, potentially offering a favorable scenario for long-term investors.
CFX Price Forecast for June 2024
June’s price forecast for Conflux shows a steady advance, with the minimum price expected at $0.2401 and the average price at $0.2493. The maximum price is projected to escalate to $0.2595, suggesting that the market sentiment continues to be optimistic. Traders might see this as an opportunity to capitalize on the growth trajectory.
July 2024: Conflux Price Forecast
In July, the price forecast for Conflux reveals a consistent increase in its valuation. The market’s minimum price is anticipated to be $0.2465, with an average price at $0.2560 and the maximum price could reach $0.2665. This could be interpreted as a stable growth period, inviting investors to consider strengthening their portfolios.
CFX Price Forecast for August 2024
The Conflux market in August is expected to maintain its upward momentum, with the minimum price rising to $0.2532. The average price is seen at $0.2629, and the maximum price might climb to $0.2737. This could be a clear indicator for investors that the asset is experiencing a sustained period of growth.
September 2024: Conflux Price Forecast
September’s forecast points to a bullish outlook for Conflux, with the minimum price at $0.2600. The asset’s average price could be at $0.2700, and the maximum price may peak at $0.2811. This might suggest that Conflux is becoming increasingly attractive to investors seeking viable crypto assets.
CFX Price Forecast for October 2024
In October, the trend for Conflux continues to be positive. The minimum price is set to be at $0.2671, the average price at $0.2773, and the maximum price is expected to hit $0.2887. This month could be critical for investors to reassess their positions and possibly look to increase their holdings.
November 2024: Conflux Price Forecast
November shows a further increase in the forecasted price for Conflux, with the minimum price reaching $0.2743. The average price is projected to be around $0.2848, while the maximum price is expected to ascend to $0.2965. This steady rise may signal a robust market that could pique the interest of high-net-worth investors.
CFX Price Forecast for December 2024
As the year concludes, December’s forecast for Conflux suggests a strong finish with the minimum price at $0.2817. The average price is anticipated to grow to $0.2925, and the maximum price might achieve a new high at $0.3045. This could signify a year-end rally, and investors might view this as an optimistic sign for the coming year.
Conflux Price Prediction 2025
Looking ahead to 2025, the trajectory for Conflux hints at a continued upward trend. The data predicts a minimum price of $0.2977, reinforcing the coin’s resilience in the face of market shifts. An average price of $0.3532 suggests a year of consistent growth and solidifying market presence. The peak price might hit $0.4200, indicating moments of heightened investor enthusiasm and market optimism.
| Month | Minimum Price | Average Price | Maximum Price |
|---|---|---|---|
| February 2025 | 0.2977 | 0.3091 | 0.3218 |
| March 2025 | 0.3057 | 0.3175 | 0.3305 |
| April 2025 | 0.3140 | 0.3260 | 0.3394 |
| May 2025 | 0.3225 | 0.3348 | 0.3486 |
| June 2025 | 0.3312 | 0.3439 | 0.3580 |
| July 2025 | 0.3401 | 0.3532 | 0.3677 |
| August 2025 | 0.3493 | 0.3627 | 0.3776 |
| September 2025 | 0.3587 | 0.3725 | 0.3878 |
| October 2025 | 0.3684 | 0.3826 | 0.3982 |
| November 2025 | 0.3784 | 0.3929 | 0.4090 |
| December 2025 | 0.3886 | 0.4035 | 0.4200 |
| January 2026 | 0.3991 | 0.4144 | 0.4314 |
Conflux Price Prediction 2026
As we gaze into 2026, Conflux’s potential seems to be gradually unfolding. We anticipate a minimum price of $0.3947, a sign of enduring strength in the market. The average price, predicted at $0.4683, implies a stable yet progressive year, possibly marked by strategic alliances and technological breakthroughs. The year’s maximum price could soar to $0.5569, hinting at surges in investor confidence and market momentum.
| Month | Minimum Price | Average Price | Maximum Price |
|---|---|---|---|
| February 2026 | 0.3947 | 0.4099 | 0.4267 |
| March 2026 | 0.4054 | 0.4209 | 0.4382 |
| April 2026 | 0.4163 | 0.4323 | 0.4500 |
| May 2026 | 0.4276 | 0.4440 | 0.4622 |
| June 2026 | 0.4391 | 0.4560 | 0.4747 |
| July 2026 | 0.4510 | 0.4683 | 0.4875 |
| August 2026 | 0.4631 | 0.4809 | 0.5006 |
| September 2026 | 0.4756 | 0.4939 | 0.5142 |
| October 2026 | 0.4885 | 0.5072 | 0.5280 |
| November 2026 | 0.5017 | 0.5209 | 0.5423 |
| December 2026 | 0.5152 | 0.5350 | 0.5569 |
| January 2027 | 0.5291 | 0.5494 | 0.5720 |
Conflux Price Prediction 2027
Moving on to 2027, our analysis suggests a promising year for Conflux. The minimum price is expected to be $0.5233, showcasing a consistent upward trajectory. An average price of $0.6208 might reflect a balanced market with healthy activity. The possibility of the price peaking at $0.7384 could be indicative of major positive developments within the Conflux ecosystem or broader acceptance of blockchain technologies.
| Month | Minimum Price | Average Price | Maximum Price |
|---|---|---|---|
| February 2027 | 0.5233 | 0.5434 | 0.5657 |
| March 2027 | 0.5374 | 0.5581 | 0.5809 |
| April 2027 | 0.5519 | 0.5731 | 0.5966 |
| May 2027 | 0.5668 | 0.5886 | 0.6127 |
| June 2027 | 0.5821 | 0.6045 | 0.6293 |
| July 2027 | 0.5978 | 0.6208 | 0.6463 |
| August 2027 | 0.6140 | 0.6376 | 0.6637 |
| September 2027 | 0.6306 | 0.6548 | 0.6816 |
| October 2027 | 0.6476 | 0.6725 | 0.7000 |
| November 2027 | 0.6651 | 0.6906 | 0.7189 |
| December 2027 | 0.6830 | 0.7093 | 0.7384 |
| January 2028 | 0.7015 | 0.7284 | 0.7583 |
Conflux Price Prediction 2028
As we turn our sights to 2028, Conflux’s journey seems to be on a path of steady ascent. The minimum price is projected to be $0.6938, reinforcing its growing market stability. The average price, anticipated at $0.8231, suggests a year of sustained growth and active trading. The maximum price could reach an impressive $0.9789, possibly fueled by breakthrough innovations or significant shifts in the crypto landscape.
| Month | Minimum Price | Average Price | Maximum Price |
|---|---|---|---|
| February 2028 | 0.6938 | 0.7204 | 0.7500 |
| March 2028 | 0.7125 | 0.7399 | 0.7702 |
| April 2028 | 0.7318 | 0.7599 | 0.7910 |
| May 2028 | 0.7515 | 0.7804 | 0.8124 |
| June 2028 | 0.7718 | 0.8015 | 0.8343 |
| July 2028 | 0.7926 | 0.8231 | 0.8568 |
| August 2028 | 0.8140 | 0.8453 | 0.8800 |
| September 2028 | 0.8360 | 0.8681 | 0.9037 |
| October 2028 | 0.8586 | 0.8916 | 0.9281 |
| November 2028 | 0.8818 | 0.9157 | 0.9532 |
| December 2028 | 0.9056 | 0.9404 | 0.9789 |
| January 2029 | 0.9300 | 0.9658 | 1.0054 |
Conflux Price Prediction 2029
Looking towards 2029, Conflux appears poised for continued progress. The data indicates a minimum price of $0.9198, a sign of solid market footing. An average price of $1.0912 suggests a stable year with potential for growth. The peak price, forecasted at $1.2978, could be the result of cumulative advancements and growing global interest in blockchain technologies.
| Month | Minimum Price | Average Price | Maximum Price |
|---|---|---|---|
| February 2029 | 0.9198 | 0.9551 | 0.9943 |
| March 2029 | 0.9446 | 0.9809 | 1.0211 |
| April 2029 | 0.9701 | 1.0074 | 1.0487 |
| May 2029 | 0.9963 | 1.0346 | 1.0770 |
| June 2029 | 1.0232 | 1.0625 | 1.1061 |
| July 2029 | 1.0508 | 1.0912 | 1.1359 |
| August 2029 | 1.0792 | 1.1207 | 1.1666 |
| September 2029 | 1.1083 | 1.1509 | 1.1981 |
| October 2029 | 1.1383 | 1.1820 | 1.2305 |
| November 2029 | 1.1690 | 1.2139 | 1.2637 |
| December 2029 | 1.2006 | 1.2467 | 1.2978 |
| January 2030 | 1.2330 | 1.2803 | 1.3328 |
Conflux Price Prediction 2030
As we analyze the prospects for 2030, Conflux shows signs of steady growth and resilience. We’re looking at a minimum price of $1.2194, which points to a robust and stable market presence. The average price is expected to be around $1.4467, indicating a year of healthy trading dynamics. The maximum price could escalate to $1.7206, potentially reflecting significant strides in adoption and technological advancements.
| Month | Minimum Price | Average Price | Maximum Price |
|---|---|---|---|
| February 2030 | 1.2194 | 1.2663 | 1.3182 |
| March 2030 | 1.2524 | 1.3005 | 1.3538 |
| April 2030 | 1.2862 | 1.3356 | 1.3904 |
| May 2030 | 1.3209 | 1.3717 | 1.4279 |
| June 2030 | 1.3566 | 1.4087 | 1.4664 |
| July 2030 | 1.3932 | 1.4467 | 1.5060 |
| August 2030 | 1.4308 | 1.4858 | 1.5467 |
| September 2030 | 1.4694 | 1.5259 | 1.5885 |
| October 2030 | 1.5091 | 1.5671 | 1.6314 |
| November 2030 | 1.5499 | 1.6094 | 1.6754 |
| December 2030 | 1.5917 | 1.6529 | 1.7206 |
| January 2031 | 1.6347 | 1.6975 | 1.7671 |
Conflux Price Prediction 2031
Projecting into 2031, the outlook for Conflux remains positive and promising. The data suggests a minimum price of $1.6167, showcasing continued market confidence. An average price of $1.9181 could signify a year of robust trading and steady growth. The potential for a maximum price of $2.2812 hints at periods of heightened investor enthusiasm and bullish market trends.
| Month | Minimum Price | Average Price | Maximum Price |
|---|---|---|---|
| February 2031 | 1.6167 | 1.6788 | 1.7477 |
| March 2031 | 1.6604 | 1.7242 | 1.7949 |
| April 2031 | 1.7052 | 1.7707 | 1.8433 |
| May 2031 | 1.7512 | 1.8185 | 1.8931 |
| June 2031 | 1.7985 | 1.8676 | 1.9442 |
| July 2031 | 1.8471 | 1.9181 | 1.9967 |
| August 2031 | 1.8970 | 1.9698 | 2.0506 |
| September 2031 | 1.9482 | 2.0230 | 2.1060 |
| October 2031 | 2.0008 | 2.0776 | 2.1628 |
| November 2031 | 2.0548 | 2.1337 | 2.2212 |
| December 2031 | 2.1103 | 2.1914 | 2.2812 |
| January 2032 | 2.1673 | 2.2505 | 2.3428 |
Conflux Price Prediction 2032
Delving into 2032, Conflux appears set for a gradual uptick in its market journey. According to our Conflux price prediction, the minimum price is projected at $2.1435, showing an increment that suggests growing confidence in its stability. With an average price of $2.5430, the year might witness steady trading with occasional spikes. The maximum price could climb to an impressive $3.0244, potentially driven by increasing adoption and advancements in blockchain technology.
| Month | Minimum Price | Average Price | Maximum Price |
|---|---|---|---|
| February 2032 | 2.1435 | 2.2258 | 2.3171 |
| March 2032 | 2.2013 | 2.2859 | 2.3796 |
| April 2032 | 2.2608 | 2.3476 | 2.4439 |
| May 2032 | 2.3218 | 2.4110 | 2.5099 |
| June 2032 | 2.3845 | 2.4761 | 2.5776 |
| July 2032 | 2.4489 | 2.5430 | 2.6472 |
| August 2032 | 2.5150 | 2.6116 | 2.7187 |
| September 2032 | 2.5829 | 2.6821 | 2.7921 |
| October 2032 | 2.6526 | 2.7546 | 2.8675 |
| November 2032 | 2.7243 | 2.8289 | 2.9449 |
| December 2032 | 2.7978 | 2.9053 | 3.0244 |
| January 2033 | 2.8734 | 2.9838 | 3.1061 |
The Main Questions Of Critical Thinking When We Talk About Conflux Price Forecast
Navigating the crypto market is a bit like solving a complex puzzle, and when it comes to CFX, there’s no shortage of factors to consider. So, I’ve compiled some critical questions to help us all get a clearer picture of what the future might hold for Conflux. Let’s explore them together and see what secrets they unlock about CFX’s potential journey.
- What are the key factors driving the current and future price of Conflux (CFX)?
- How does Conflux’s technology and roadmap compare to other cryptocurrencies in influencing its price?
- What role do market trends, investor sentiment, and past performance play in the fluctuation of CFX’s price?
- How might global economic conditions impact the demand and value of CFX?
- What is the historical price performance of CFX, and how can it inform future forecasts?
- How reliable are the sources providing the Conflux Network price forecast?
- What potential regulatory changes could affect the price of CFX?
- How does the utility and adoption rate of Conflux’s technology impact its price?
- Are there any upcoming Conflux developments or updates that could significantly affect its price?
- How might changes in blockchain technology and innovation influence the future value of CFX?
- What are the risks associated with investing in CFX based on current forecasts?
- How do geopolitical events and changes in global cryptocurrency policies impact CFX prices?
- What are the technical indicators suggesting about the short-term and long-term trends of CFX?
- How does the market capitalization of Conflux compare with its competitors, and what does this mean for its price?
- Are there any potential partnerships or collaborations that could boost the value of CFX?
- How does the liquidity and trading volume of CFX affect its price volatility?
- What role do major cryptocurrency exchanges play in determining the price of CFX?
- How might the entry of institutional investors into the Conflux market impact its price?
- Are there any notable analysts or influencers whose opinions significantly sway the price of CFX?
- How does the overall perception and current sentiment towards blockchain and cryptocurrencies influence the market value of Conflux?
I hope these questions have sparked your curiosity and given you some food for thought about Conflux’s future. Remember, the crypto world is like a vast ocean – always moving, always changing. Thus, keep these questions in your toolkit as you explore the possibilities of CFX.
Conflux (CFX) Future Price Predictions by Experts
Venturing into the dynamic world of crypto, I’ve been rubbing shoulders with some of the old hands in the game, gathering insights on Conflux (CFX). These are the seasoned players, the kind who have seen every twist and turn in the crypto saga, and their perspectives on Conflux are nothing short of intriguing.
DigitalCoinPrice: DigitalCoinPrice projects a gradual increase in the average price of Conflux over the coming years, with significant growth expected by 2032. For instance, analysts predict the average price in 2024 might rise by over 130% compared to its current value, and the increase could reach nearly 1800% by 2032.
WalletInvestor: They offer detailed daily predictions for Conflux, particularly focusing on 2025. Their forecasts show a range of prices for each day, suggesting significant volatility. For instance, in early January 2025, they predict prices could fluctuate between approximately $0.0936 and $0.373.
CaptainAltCoin: CaptainAltCoin made a Conflux Network price prediction for 2025, forecasting the coin’s potential value at $0.7146. In April 2028, the projection was that CFX could drop to $0.6491, before potentially soaring to $1.79 in 2030, and further to $3.57 by 2040.
CoinCodex: CoinCodex experts see Conflux Network trading around the opening price of $0.25 by Q2 2024, which is 66% higher than the current CFX price.
CCN: CCN forecasts a more optimistic price move for the CFX token. By 2025, their financial experts see a move between $0.25 and $0.44 and by 2030 between $0.64 and $2.81.
Now, here’s a piece of investment advice from my corner: while these experienced voices are a treasure trove of knowledge, they shouldn’t be your sole guiding star. Absolutely, their insights are a goldmine, but remember, there’s no substitute for rolling up your sleeves and doing your own digging. The real trick is to combine the wisdom of these pros with your own research and analysis.
Decoding the Charts: Conflux Technical Price Analysis
Let’s delve into the world of Conflux (CFX) and try to unravel the secrets hidden in its price charts. Technical analysis, my friends, is like decoding an ancient script. It’s all about finding patterns, understanding market psychology, and making educated guesses about future price movements. Here are some key concepts and tools we use in this cryptic art of technical analysis.
When diving into technical analysis of Conflux, there are several key concepts and tools that are crucial to understand. Here’s a breakdown of some of these essential elements:
- Candlestick Patterns: These are the bread and butter of chart analysis. Each candlestick represents price movements within a specific timeframe and can tell us a lot about market sentiment. For example, a ‘bullish engulfing’ pattern might indicate a buying opportunity, while a ‘bearish harami’ could signal a potential sell-off.
- Moving Averages: These indicators smooth out price data to form a single flowing line, making it easier to identify the direction of the trend. The most commonly used are the Simple Moving Average (SMA) and the Exponential Moving Average (EMA).
- Volume Analysis: This involves examining the number of shares or contracts of a security traded in a period. High volumes can indicate strong interest in a security and can confirm trends or signal a reversal.
- Support and Resistance Levels: These are key price levels where the forces of supply and demand meet. Support levels indicate a price below which an asset rarely falls, while resistance levels represent a price it seldom surpasses.
- Trend Analysis: This is all about identifying the direction of market movement, be it upward, downward, or sideways. Trends can be short-term, medium-term, or long-term, and understanding them is crucial for making informed investment decisions.
- Chart Patterns: These are distinct formations created by the movements of security prices on a chart and are foundational to technical analysis. Patterns like ‘head and shoulders’, ‘triangles’, or ‘flags’ can indicate continuation or reversal of trends.
- Timeframes: Technical analysis can be applied to various timeframes – from minutes and hours to days, weeks, or even years. Short-term traders might focus on minute or hourly charts, while long-term investors may look at daily, weekly, or monthly charts.
Technical Indicators: Origin and Purpose
Technical indicators, you see, aren’t just fancy lines on a chart. They have a rich history, born from the need to make sense of the chaotic financial markets. These tools are like compasses and maps, guiding traders through the unpredictable seas of market price movements. We use them to identify trends, gauge market sentiment, and, most importantly, to make decisions about when to buy or sell.
The Role of Technical Indicators in Financial Markets
In the buzzing world of financial or cryptocurrency markets, technical indicators are like the stars guiding a sailor at night. They help us read the market’s mood. Is it bullish, bearish, or as indecisive as a cat at a doorway? Indicators like Moving Averages, RSI, or Bollinger Bands help us spot trends, measure market volatility, and foresee potential turnarounds. They’re not fortune-tellers, but they do provide critical insights.
How Technical Indicators Can Help Predict CFX Price
Now, applying these indicators to Conflux’s price can be quite the adventure. It’s like putting together a puzzle, where each piece is a bit of data from the past, helping us speculate about the future. By analyzing CFX’s price movements and volumes, we can spot patterns. For instance, a Moving Average crossover might hint at a price uptrend, while an overbought RSI could suggest a possible price correction.
In my journey through the world of trading, I’ve learned a crucial lesson about the tools of technical analysis. They are incredibly helpful, like powerful beams of light guiding you through a dark, uncharted forest. These tools light up potential routes you could take in the market, yet they aren’t a foolproof GPS guaranteeing success. The real knack lies in smartly combining these tools with various forms of market analysis, while keeping a keen eye on broader market trends.
Let’s dive into a few specific indicators that have been game-changers in my trading experience. I’m going to walk you through some real-world examples, showing you how to harness these tools for a deeper understanding of CFX’s price movement. My aim is pretty straightforward: to arm you with knowledge and insights that help you navigate the sometimes turbulent waters of the crypto world with a bit more confidence.
Moving Averages (MAs) for Conflux Price Prediction
Moving Averages (MAs) in the crypto world are like your trusty sidekicks, always there to give you a clearer picture of the market’s mood swings. Simple Moving Average (SMA) and Exponential Moving Average (EMA) are the dynamic duo here. The SMA gives you the straightforward average of prices over a period, while the EMA pays more attention to recent price action, making it a bit more tuned into the market’s latest gossip.
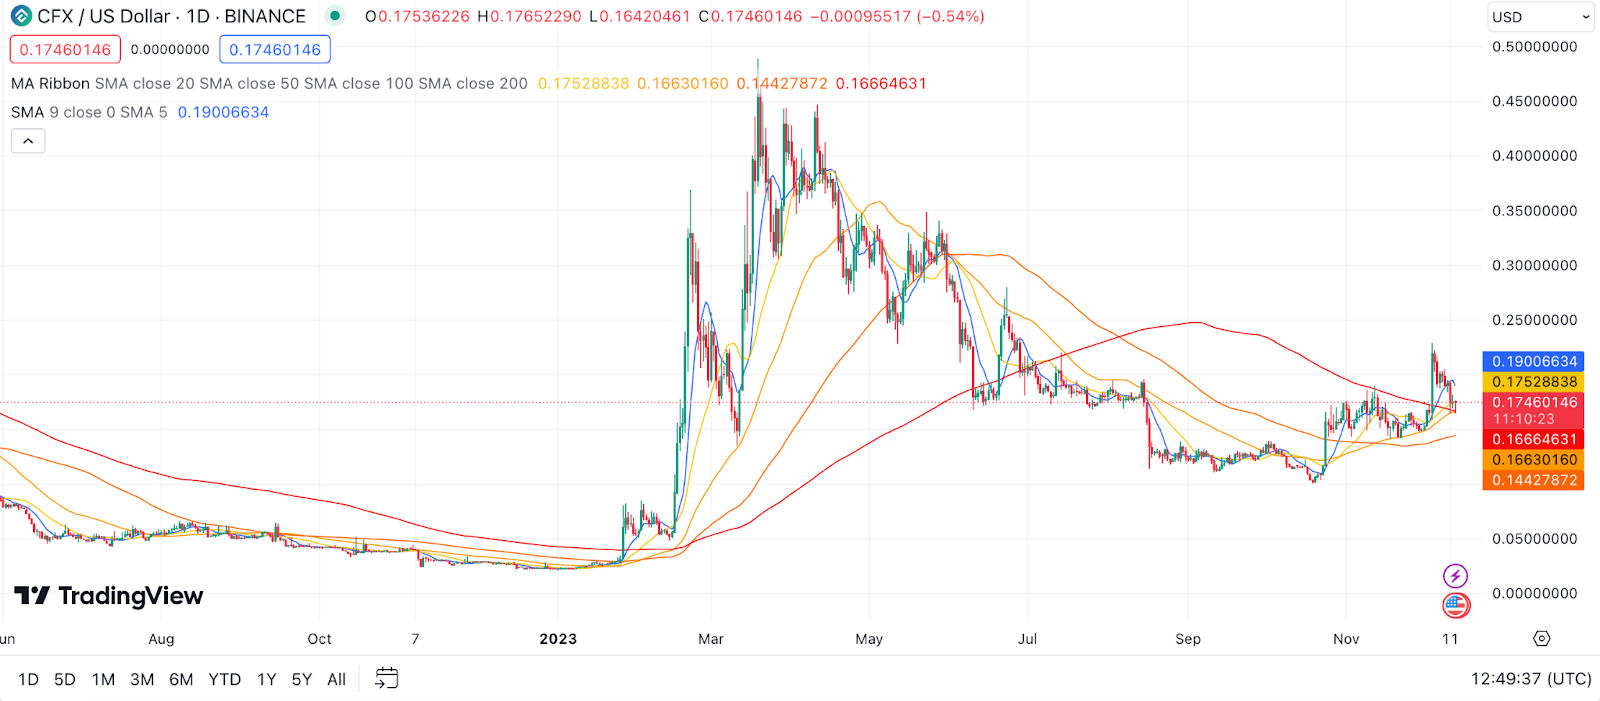
Example: Let’s take a scenario where Conflux has been on a bit of a joyride. If its price is hanging out above its 50-day SMA, it’s like the market’s giving it a nod of approval. But if it dips below, it’s a heads-up that the tide might be turning.
Relative Strength Index (RSI) for Conflux Price Prediction
The Relative Strength Index (RSI) is your market mood ring. This handy oscillator moves between zero and 100 and is all about measuring the speed and change of price movements. It tells you if the market’s getting too excited (overbought) or too gloomy (oversold) about Conflux.
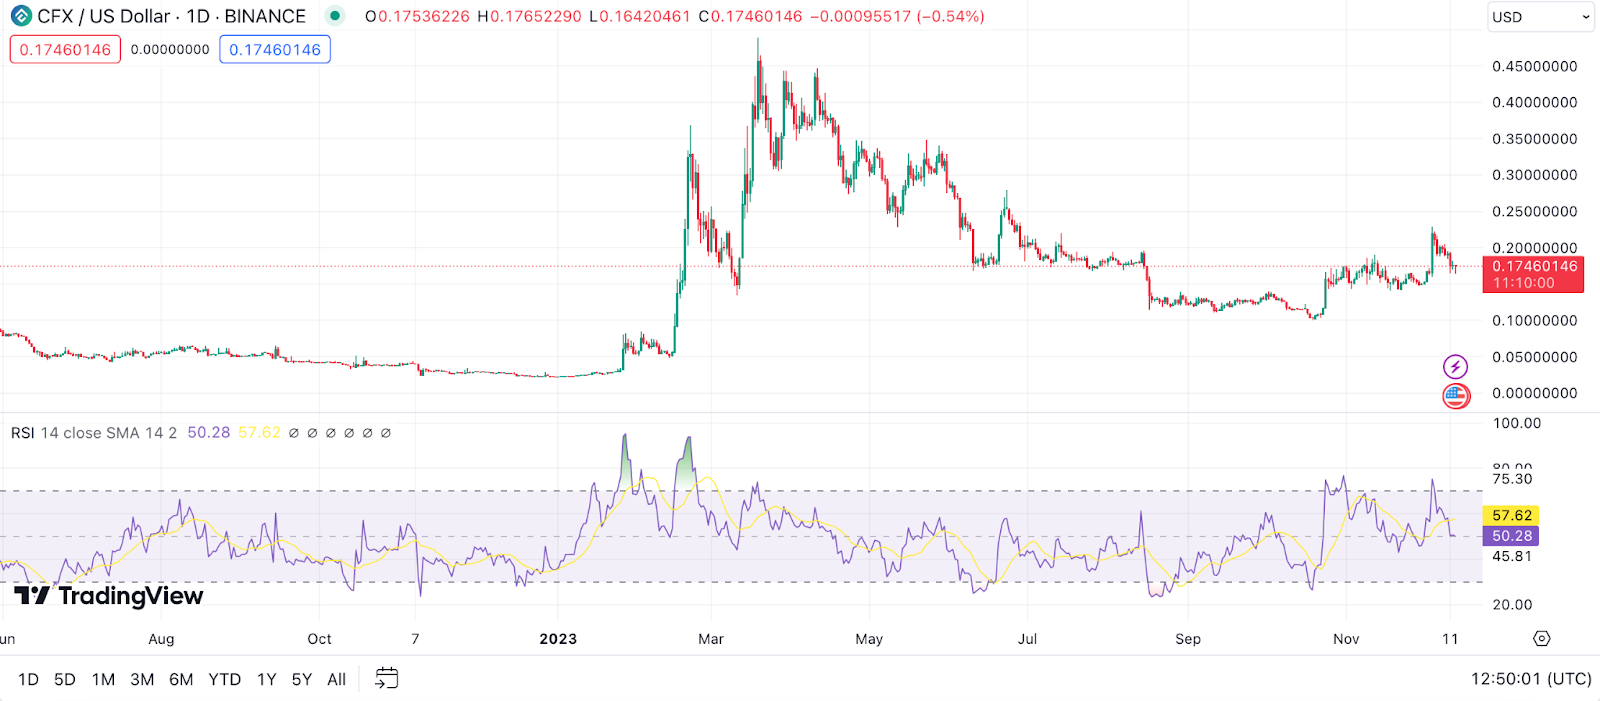
Example: Imagine Conflux’s RSI is strutting above 70. It’s like the market might be saying, “Take a breather, we might be overdoing it.” Conversely, if it dips below 30, it’s a little whisper that CFX might be a hidden gem waiting to be picked up.
Moving Average Convergence Divergence (MACD) for Conflux Price Prediction
The Moving Average Convergence Divergence (MACD) is a bit of a show-off but in the best way. It tracks the relationship between two moving averages of Conflux’s price and is great at signaling the start of bullish or bearish trends. When the MACD line (the difference between Conflux’s 26-day and 12-day EMAs) crosses above the signal line (the 9-day EMA of the MACD line), it could be hinting at sunny days ahead for CFX. If it crosses below, it might be time to brace for a bit of a chill.
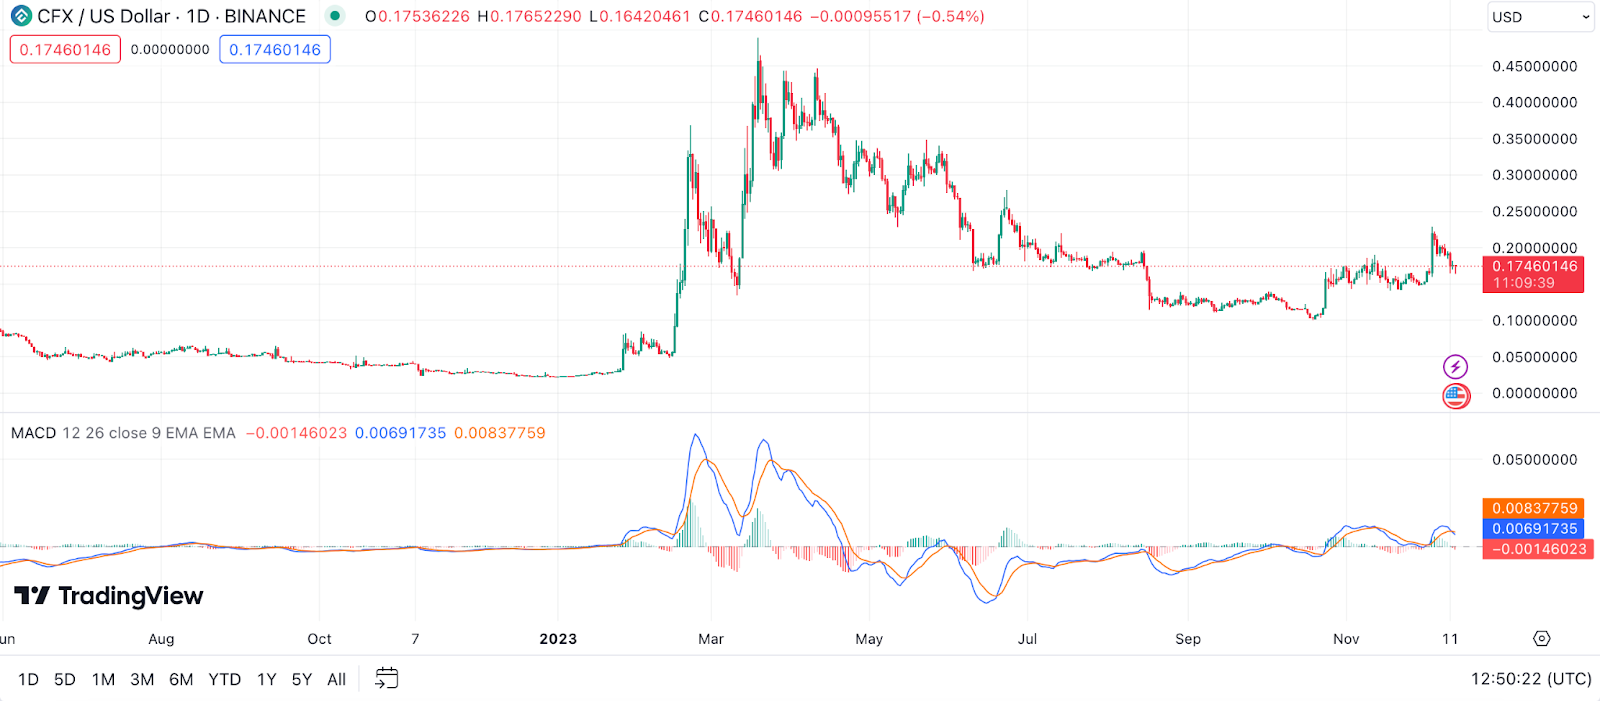
Example: Say Conflux’s MACD line leaps over the signal line. It’s like the market buzzing about good days ahead for CFX. But if it falls below the signal line, it’s a signal that there might be some cloudy days ahead in the Conflux market.
Bollinger Bands for Conflux Price Prediction
Bollinger Bands are like the elastic bands of the trading world. They adjust themselves based on market volatility. Essentially, they consist of three lines: a moving average (middle band), an upper band, and a lower band. The closer the bands are to each other, the less volatile the market. When they spread apart, brace yourself, because things might be getting wild with Conflux’s price.
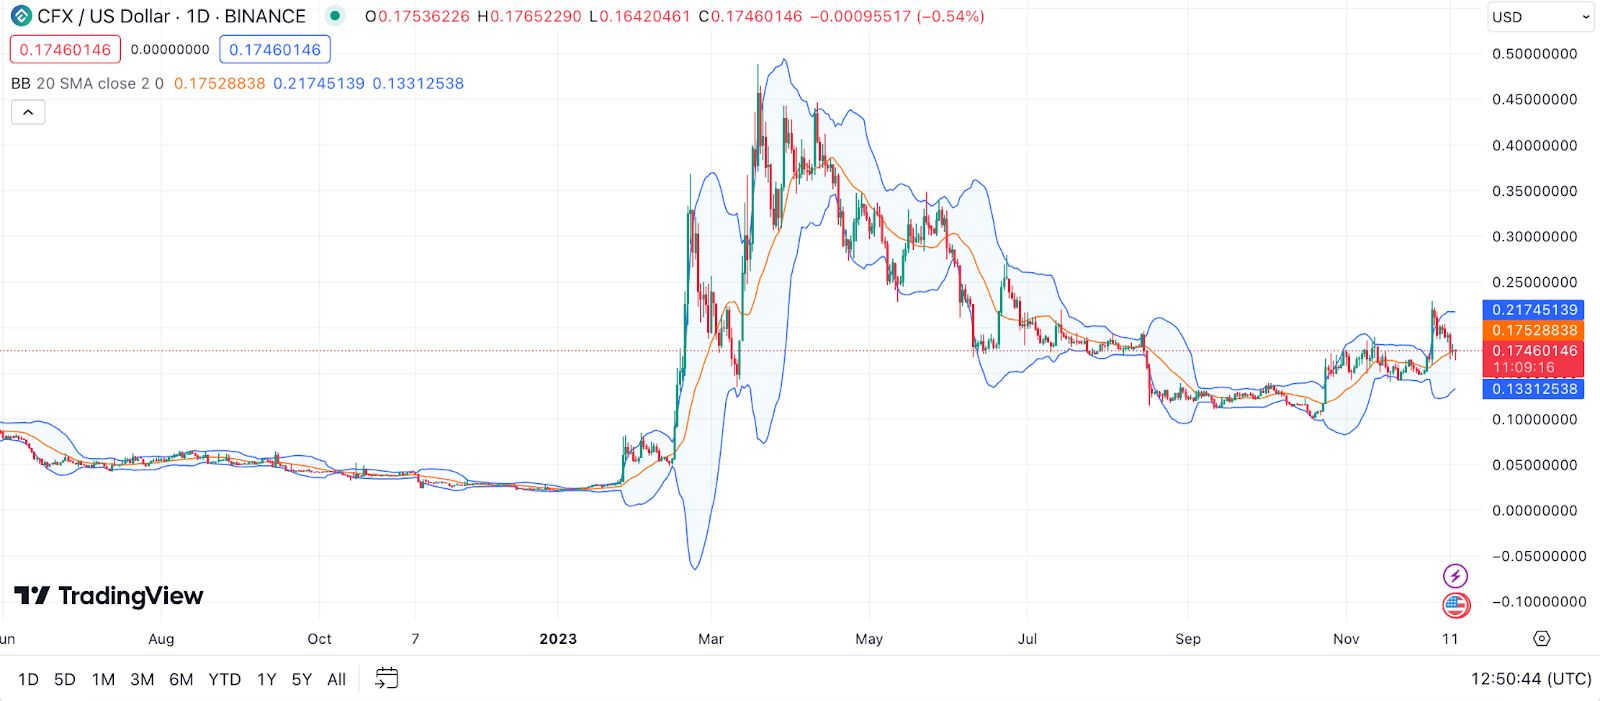
Example: Imagine you’re looking at Conflux’s chart and notice the bands are tightening up. It’s like the calm before the storm, signaling that a significant price move might be on the horizon. If CFX’s price breaks above the upper band, it could be gearing up for a rally. But if it dips below the lower band, it might be sliding into a downtrend.
Stochastic Oscillator for Conflux Price Prediction
The Stochastic Oscillator is all about momentum. It compares Conflux’s closing price to a range of its prices over a specific period. The gist is, it helps you figure out trend reversals by identifying overbought or oversold conditions. This oscillator swings between 0 and 100, and typically, a reading above 80 indicates that CFX might be overbought, while below 20 suggests it could be oversold.
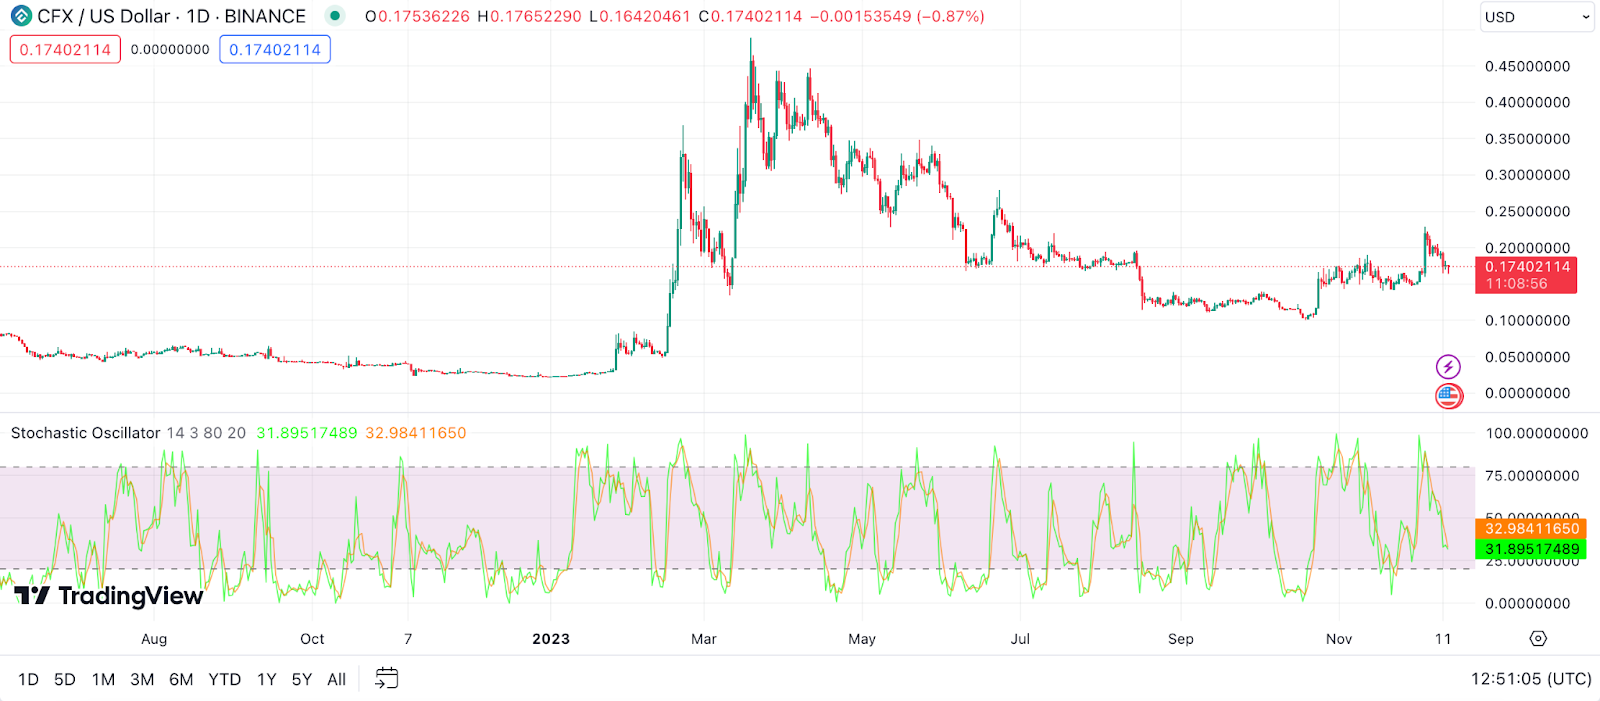
Example: Let’s say the Stochastic Oscillator for Conflux is above 80. It’s hinting that CFX might be overvalued at the moment, and a price pullback could be in the cards. Alternatively, if it’s below 20, it might be undervalued, suggesting a potential upward swing could be coming.
Parabolic SAR (Stop and Reverse) for Conflux Price Prediction
The Parabolic SAR is like your personal trading assistant, telling you when to stop and reverse your trading direction. This tool appears on charts as a series of dots, either above or below Conflux’s price, indicating the potential direction of the price movement. When the dots are below the candles, it suggests an uptrend, and when they are above, a downtrend.
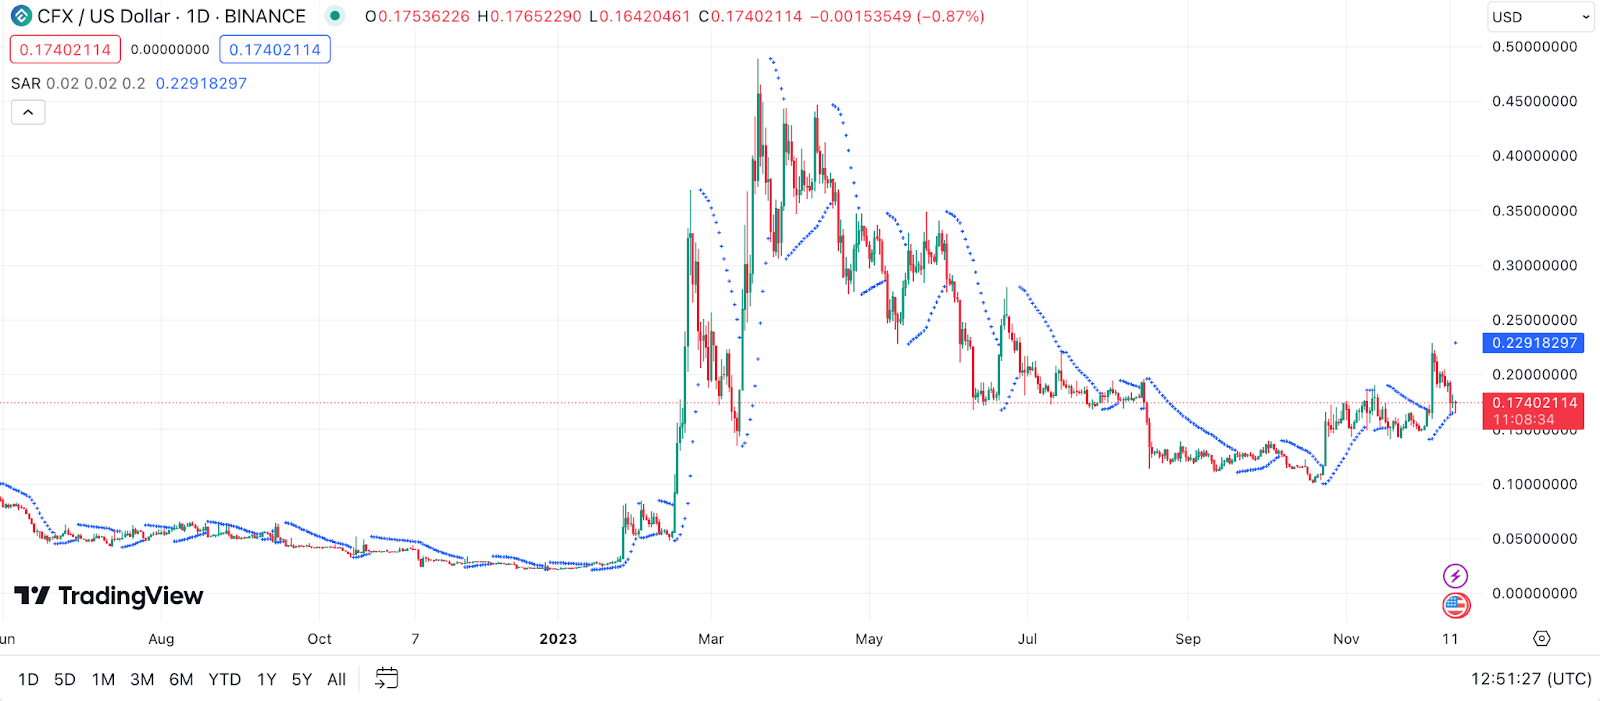
Example: Suppose you’re tracking Conflux and the dots flip from being above to below the candlesticks. It’s like a green light indicating a potential bullish trend, suggesting it might be time to consider going long on CFX. Conversely, if the dots switch from below to above, it might be time to hit the brakes, signaling a possible downward trend.
Ichimoku Cloud for Conflux Price Prediction
The Ichimoku Cloud, also known as Ichimoku Kinko Hyo, is a bit like having a weather forecast for Conflux’s price action. It’s a complex indicator, offering a multifaceted view of the market by combining several data points to create a “cloud” that forecasts potential support and resistance levels. It’s composed of five lines, each offering a different insight into price trends and momentum.
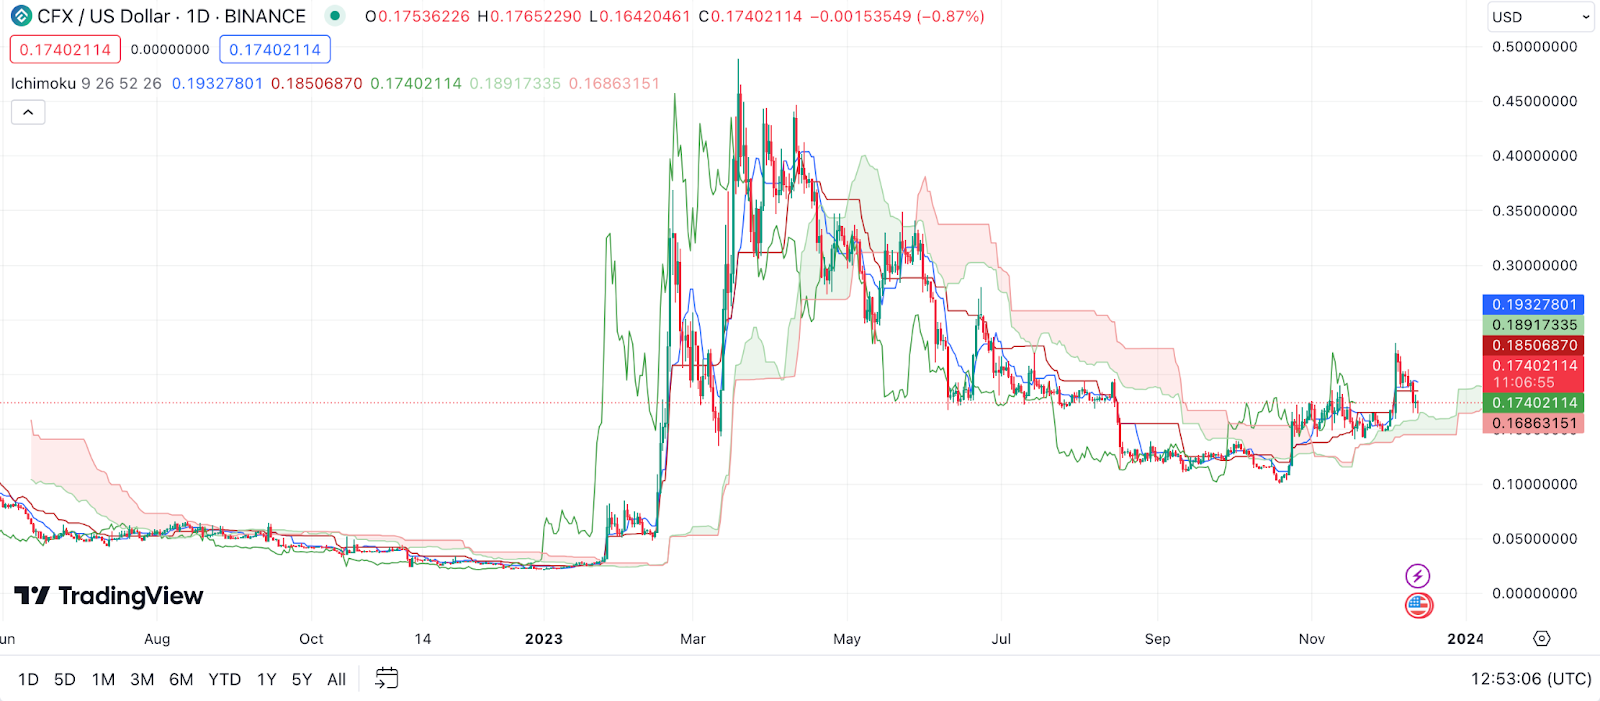
Example: If you’re analyzing Conflux and you see the price moving above the cloud, it’s a bit like a sunny day in your trading landscape, suggesting a bullish trend. However, if CFX dips below the cloud, it might be time to grab your umbrella, as it could indicate a bearish trend.
Fibonacci Retracement for Conflux Price Prediction
Fibonacci Retracement is like a roadmap that uses horizontal lines to indicate areas of support or resistance at the key Fibonacci levels before the price continues in the original direction. These levels are derived from the Fibonacci sequence, a series of numbers where each subsequent number is the sum of the previous two. This tool helps traders identify strategic places for transactions, stop losses, or target prices.
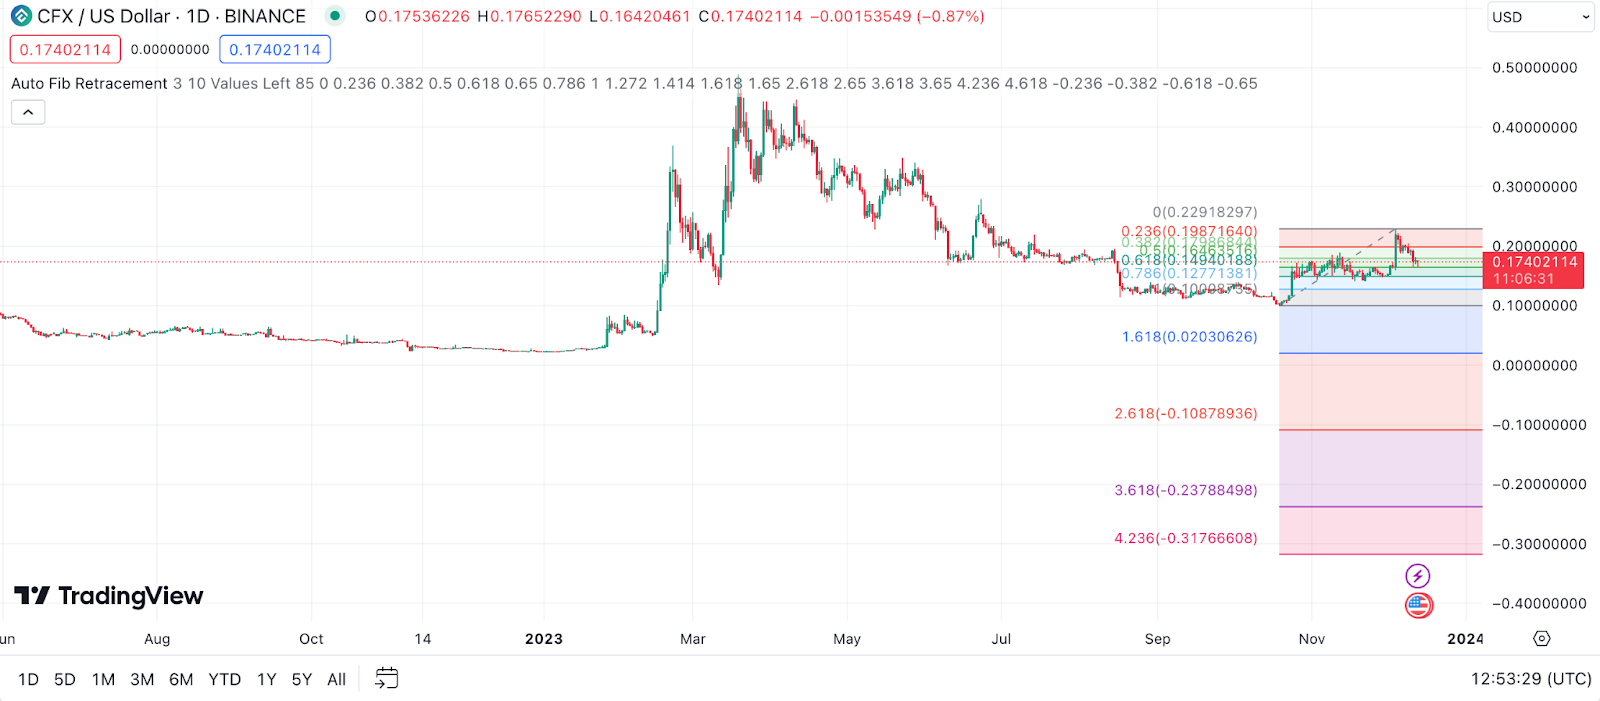
Example: Suppose Conflux experiences a significant price surge. Using Fibonacci Retracement, you might spot potential pullback levels where the price could find support or resistance. If CFX retraces to, say, the 61.8% Fibonacci level and then bounces back, it could indicate a strong area of buying interest.
Average Directional Index (ADX) for Conflux Price Prediction
The Average Directional Index (ADX) is like your guide to understanding market strength. It quantifies trend strength regardless of direction, so it’s great for measuring the intensity of the Conflux market’s mood. The ADX is part of the Directional Movement System developed by J. Welles Wilder and includes two other indicators: the Positive Directional Indicator (+DI) and the Negative Directional Indicator (-DI).
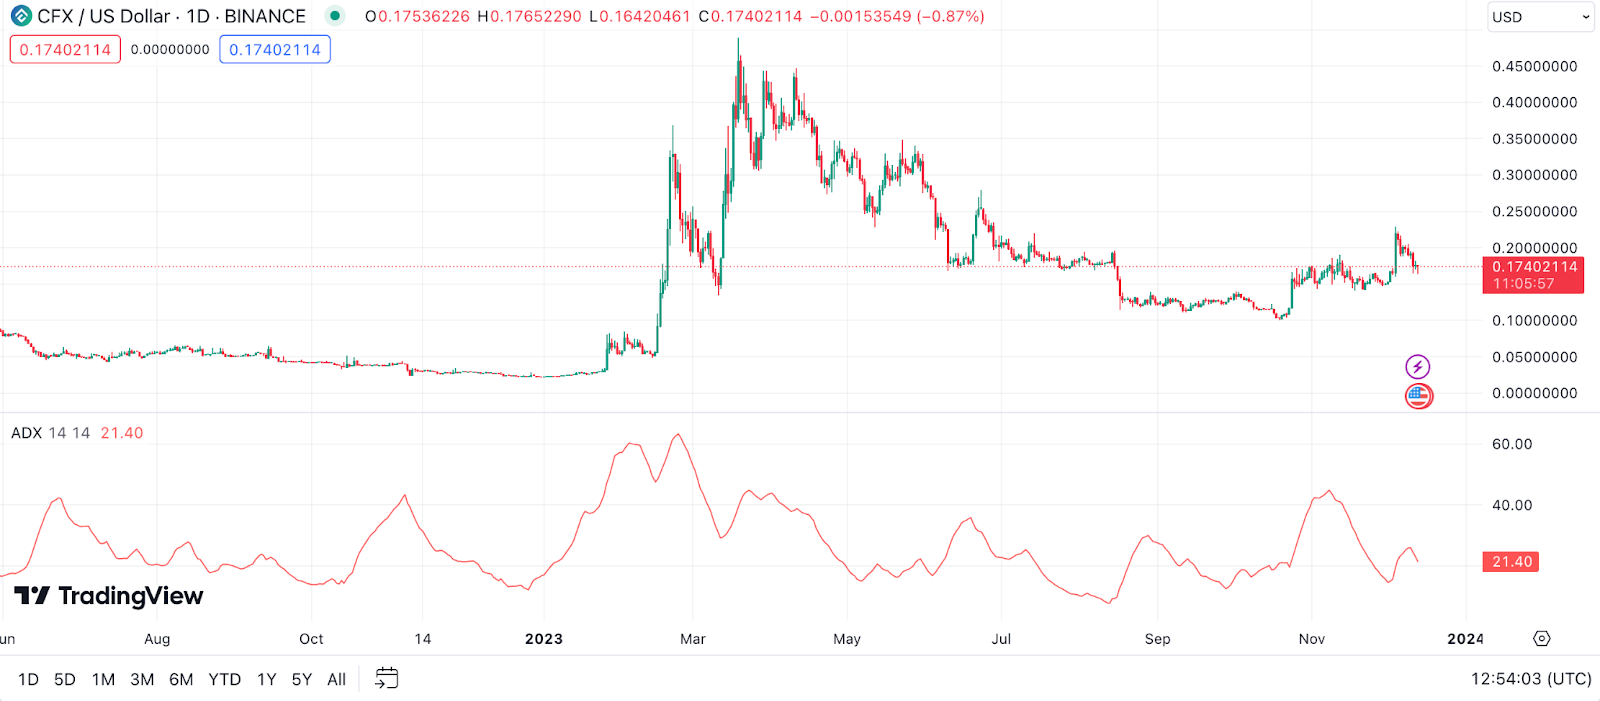
Example: If you see Conflux’s ADX rising while its +DI is above the -DI, it’s like the market giving you a high-five, signaling a strong uptrend. Conversely, if the ADX is rising and the -DI is above the +DI, it could be a warning sign of a strengthening downtrend.
On Balance Volume (OBV) for Conflux Price Prediction
On Balance Volume (OBV) is like your personal detective in the world of trading, uncovering the movement of volume in relation to Conflux’s price changes. This indicator works on a simple principle: volume precedes price movement. It adds volume on up days and subtracts on down days, offering insights into whether a price movement is backed by substantial volume.
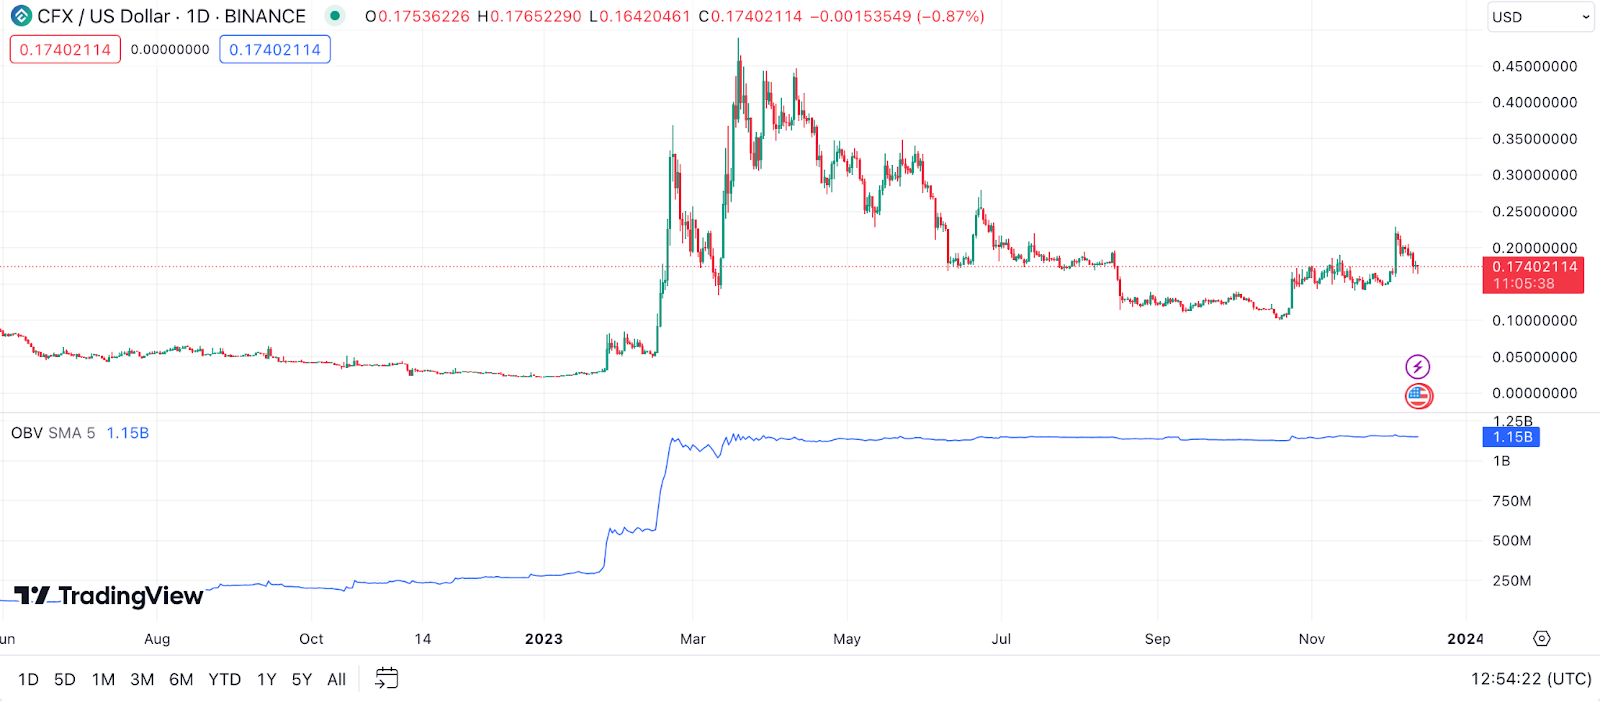
Example: Consider a scenario where Conflux’s price is rising, and so is its OBV. This alignment can be seen as a bullish sign, indicating that the upward price trend is supported by strong volume and might continue. On the flip side, if CFX’s price is increasing but the OBV is declining, it could signal that the upward trend might not be sustainable.
Rate of Change (ROC) for Conflux Price Prediction
Rate of Change (ROC) is like your speedometer, measuring how fast Conflux’s price is changing. Simply put, it compares the current price with a price from a previous period. The ROC then displays this information as a ratio or percentage. It’s a momentum oscillator, indicating whether CFX might be entering overbought or oversold territory.
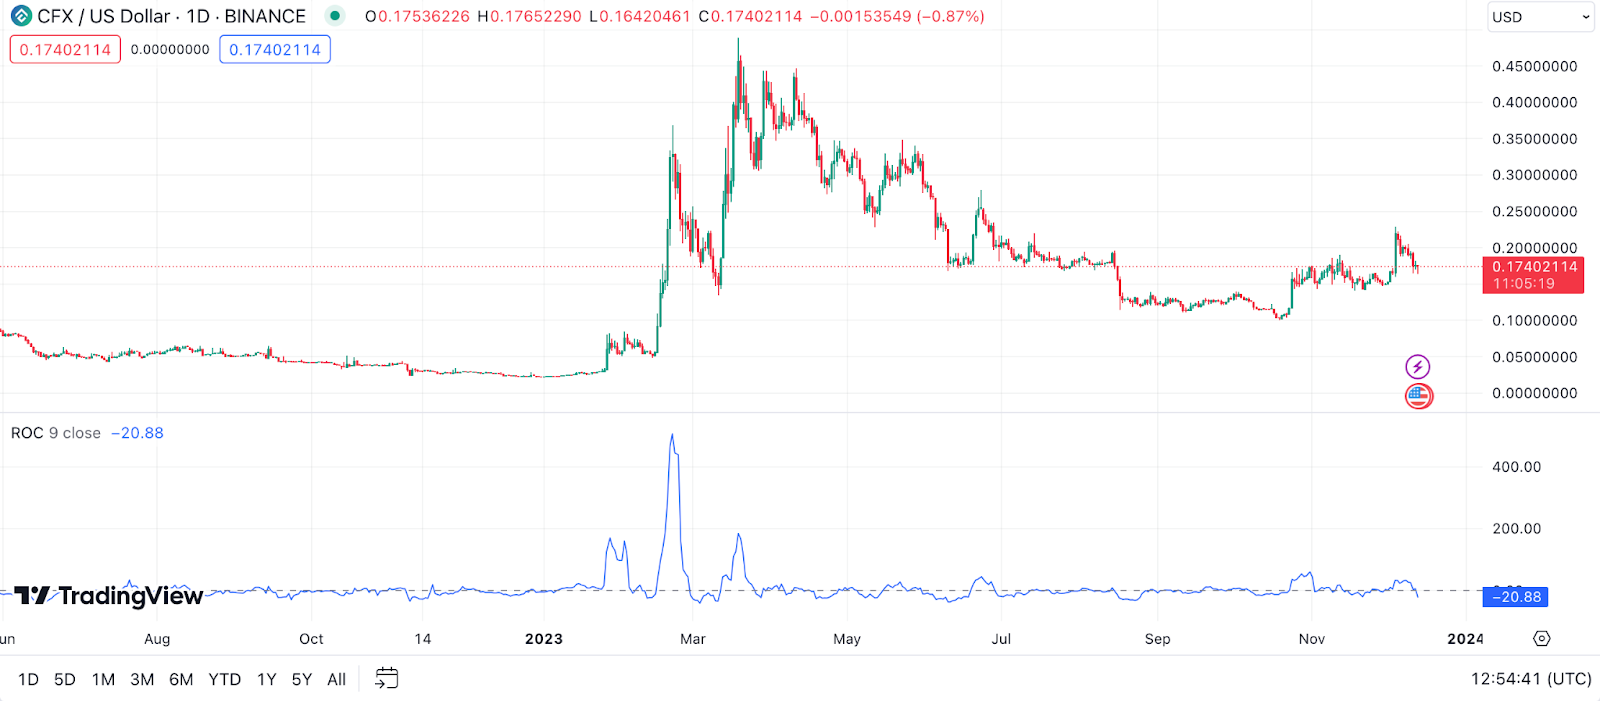
Example: Imagine the ROC for Conflux shows a high positive value. This indicates a strong upward momentum – CFX is moving fast, and the bulls are in control. But if it’s too high, be cautious – it might also signal an overbought condition. Conversely, a significant negative ROC suggests strong downward momentum, potentially leading to an oversold condition.
Commodity Channel Index (CCI) for Conflux Price Prediction
The Commodity Channel Index (CCI) acts like a GPS for navigating the price deviations of Conflux. Originally designed for commodities, it’s just as useful in the crypto world. The CCI compares current trading prices with the average price over a specific time period, helping identify cyclical trends.
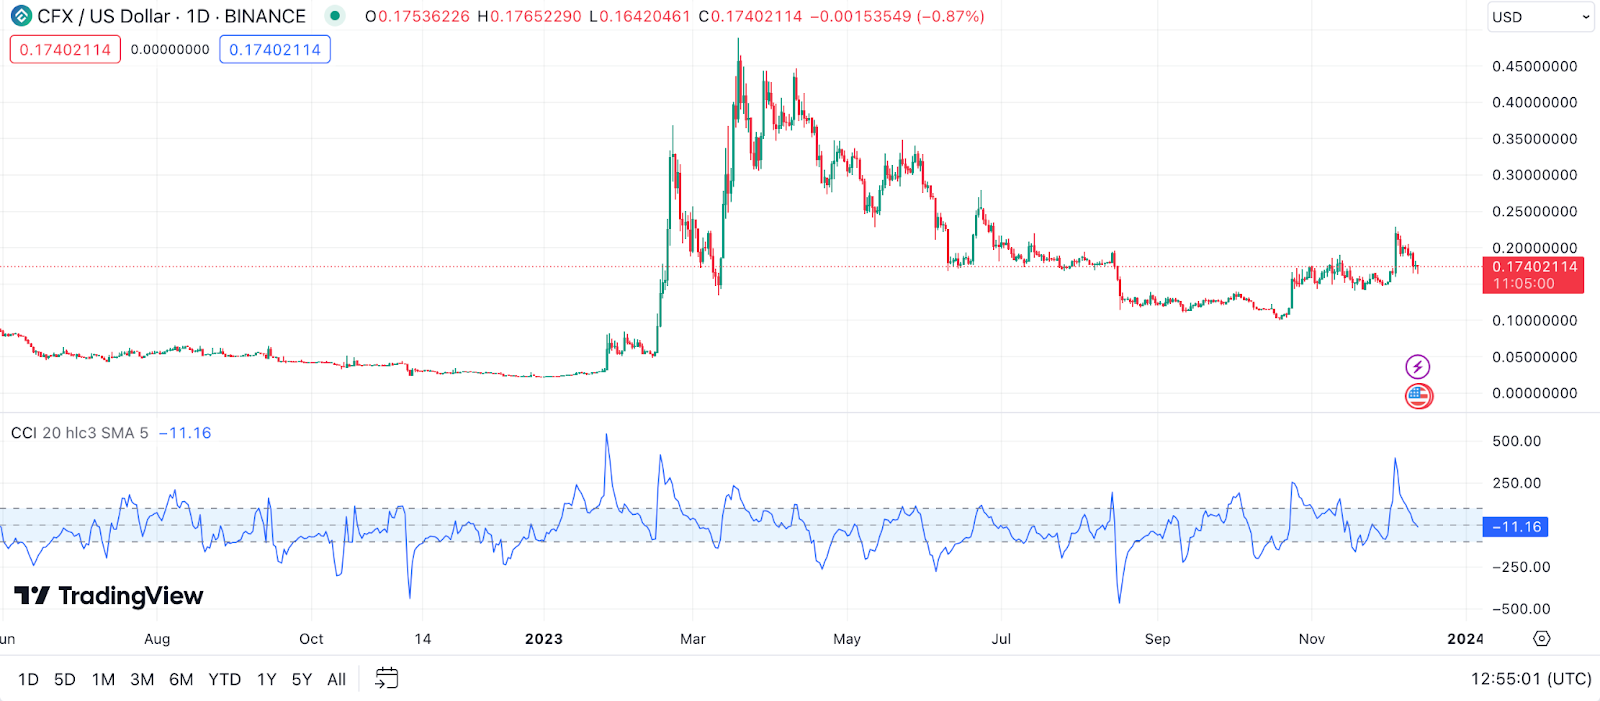
Example: If Conflux’s CCI is above +100, it could suggest that CFX is entering overbought territory, potentially signaling a price correction or reversal. Conversely, if the CCI drops below -100, it might indicate that CFX is in oversold territory, possibly setting the stage for a rebound.
Accumulation/Distribution Line (A/D Line) for Conflux Price Prediction
The Accumulation/Distribution Line (A/D Line) is like your trusty sidekick in decoding market trends for Conflux. This indicator helps identify whether CFX is being accumulated (bought) or distributed (sold). It does this by looking at the closing price relative to the high and low price of the same period, along with the trading volume.
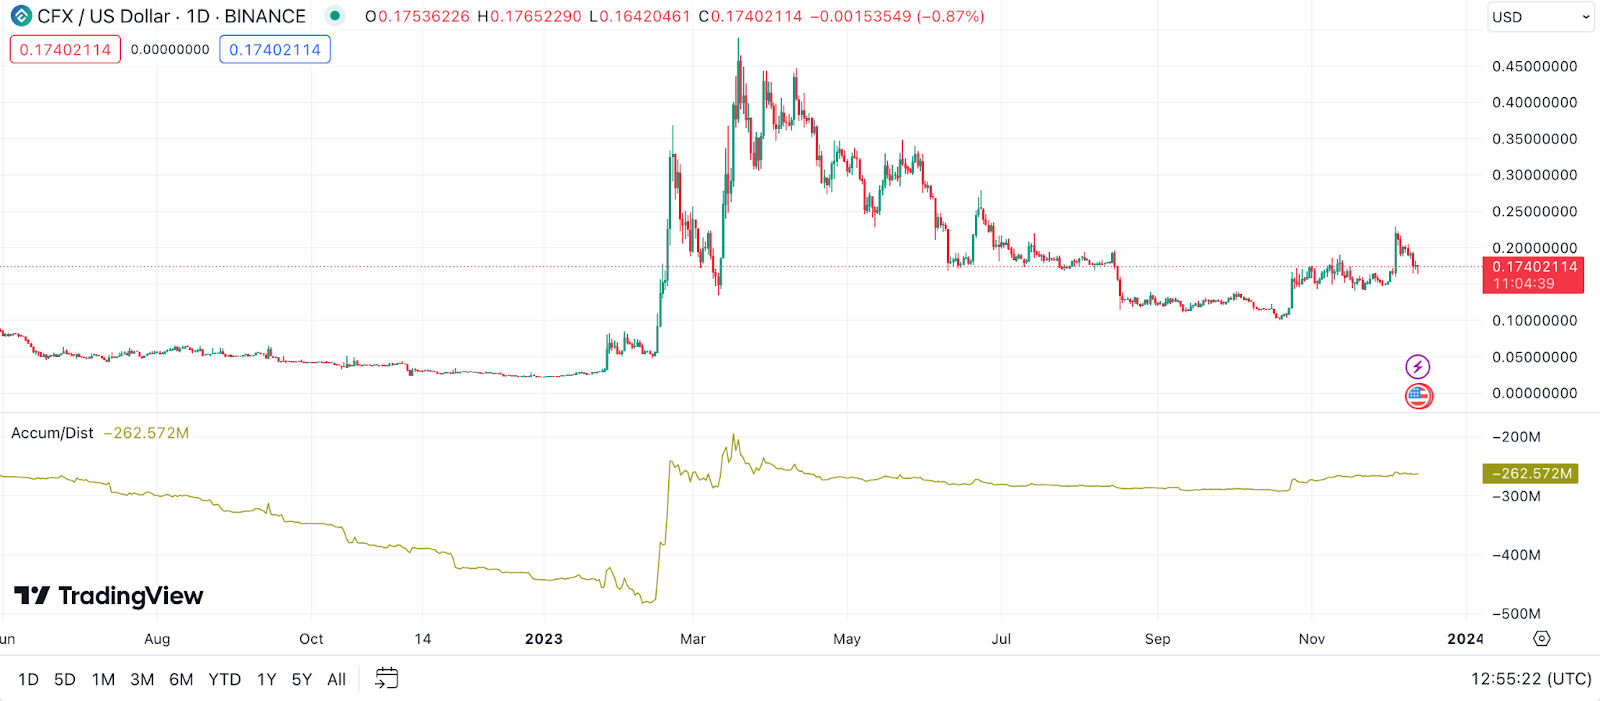
Example: If you observe Conflux’s A/D line trending upwards while its price is also going up, it’s like having the wind in your sails. It suggests that the price increase is backed by strong buying pressure. However, if the A/D line is heading south while the price is going up, it might be a red flag indicating that despite rising prices, the coin could be facing selling pressure.
Pivot Points for Conflux Price Prediction
Pivot Points are like the markers on your trading map for Conflux, offering key levels of support and resistance. They are calculated using the high, low, and close of the previous trading period. These points can be incredibly useful for short-term forecasts, helping to identify potential reversal points.
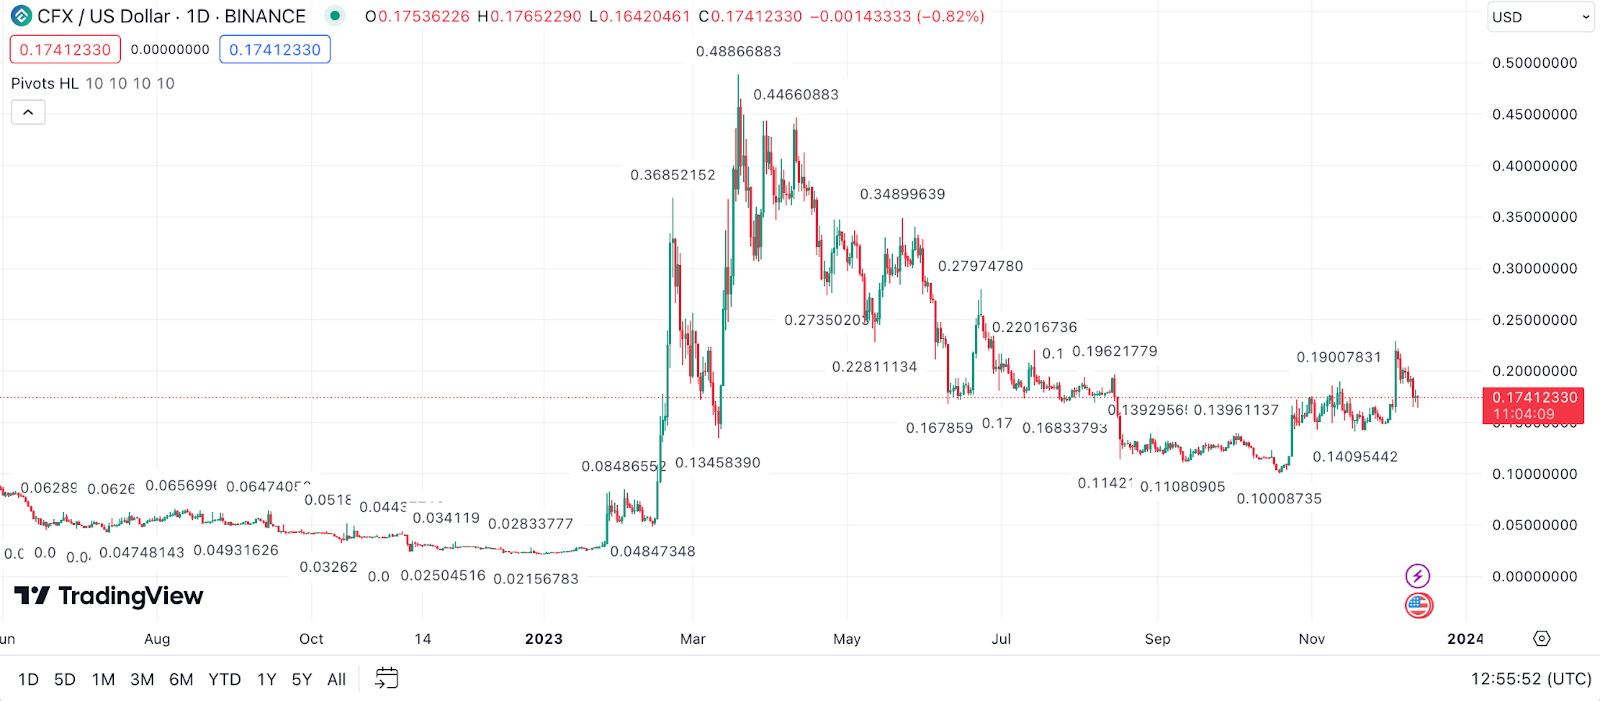
Example: If Conflux is trading above the pivot point, it can be seen as a bullish signal, suggesting that CFX might continue its upward trajectory. Conversely, if it’s trading below the pivot point, it might be a bearish sign, hinting that lower prices could be on the horizon.
Chaikin Money Flow (CMF) for Conflux Price Prediction
Chaikin Money Flow (CMF) is like your financial analyst for Conflux’s market, gauging the buying and selling pressure over a set period. It combines price and volume to measure the momentum behind CFX’s price movements. The CMF oscillates around zero, with positive values indicating buying pressure and negative values signaling selling pressure.
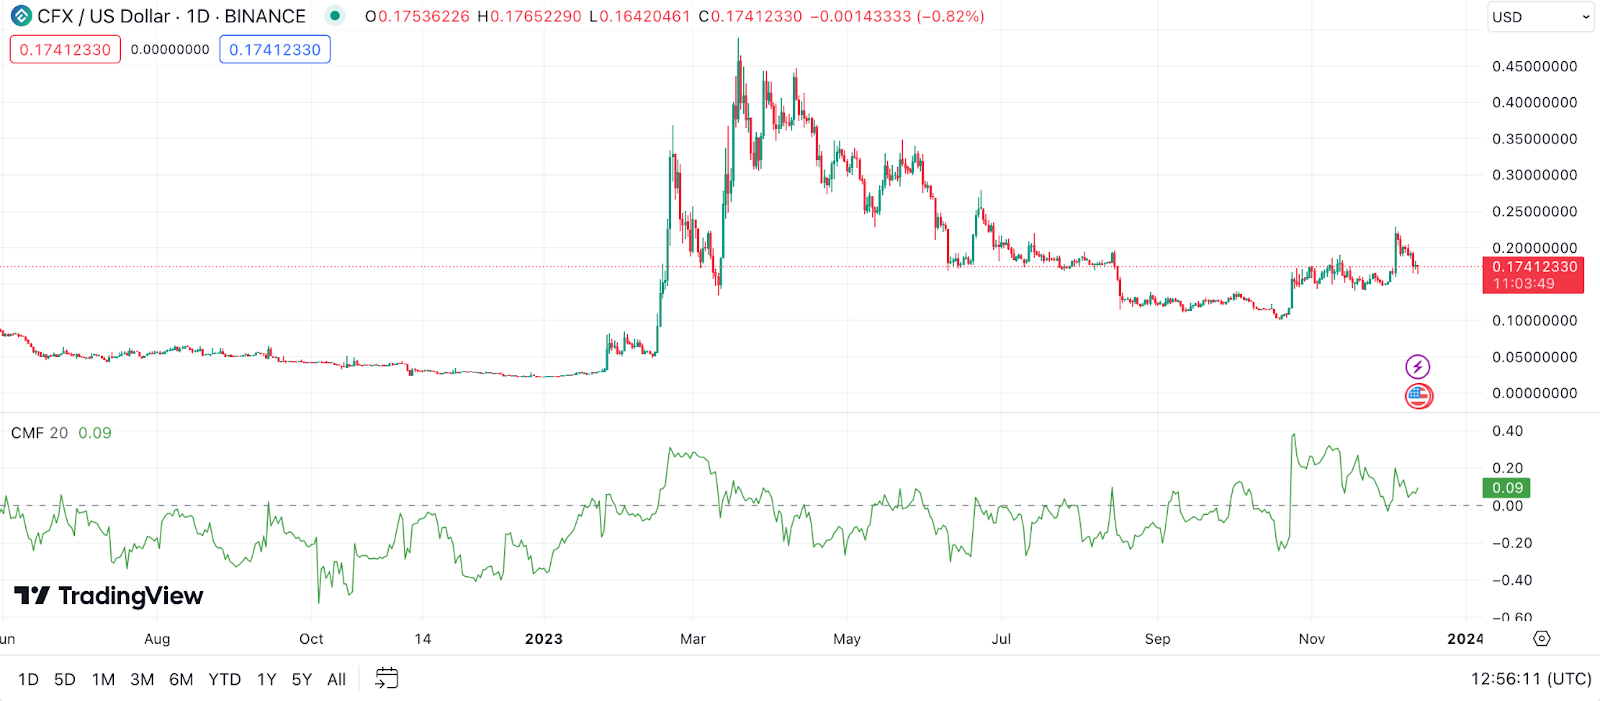
Example: If you see the CMF for Conflux in positive territory and staying there consistently, it suggests that buying pressure is strong – a good sign for bulls. On the flip side, if the CMF dips into negative territory and stays there, it might be a warning sign of sustained selling pressure.
Aroon Indicator for Conflux Price Prediction
The Aroon Indicator is like your guide to understanding the strength of Conflux’s trends. It’s made up of two lines: the Aroon Up and the Aroon Down. These lines measure the time it takes for the price to reach the highest and lowest points over a given period, usually 25 days. It’s a great tool for identifying whether CFX is in a strong uptrend or downtrend and can even hint at potential trend reversals.
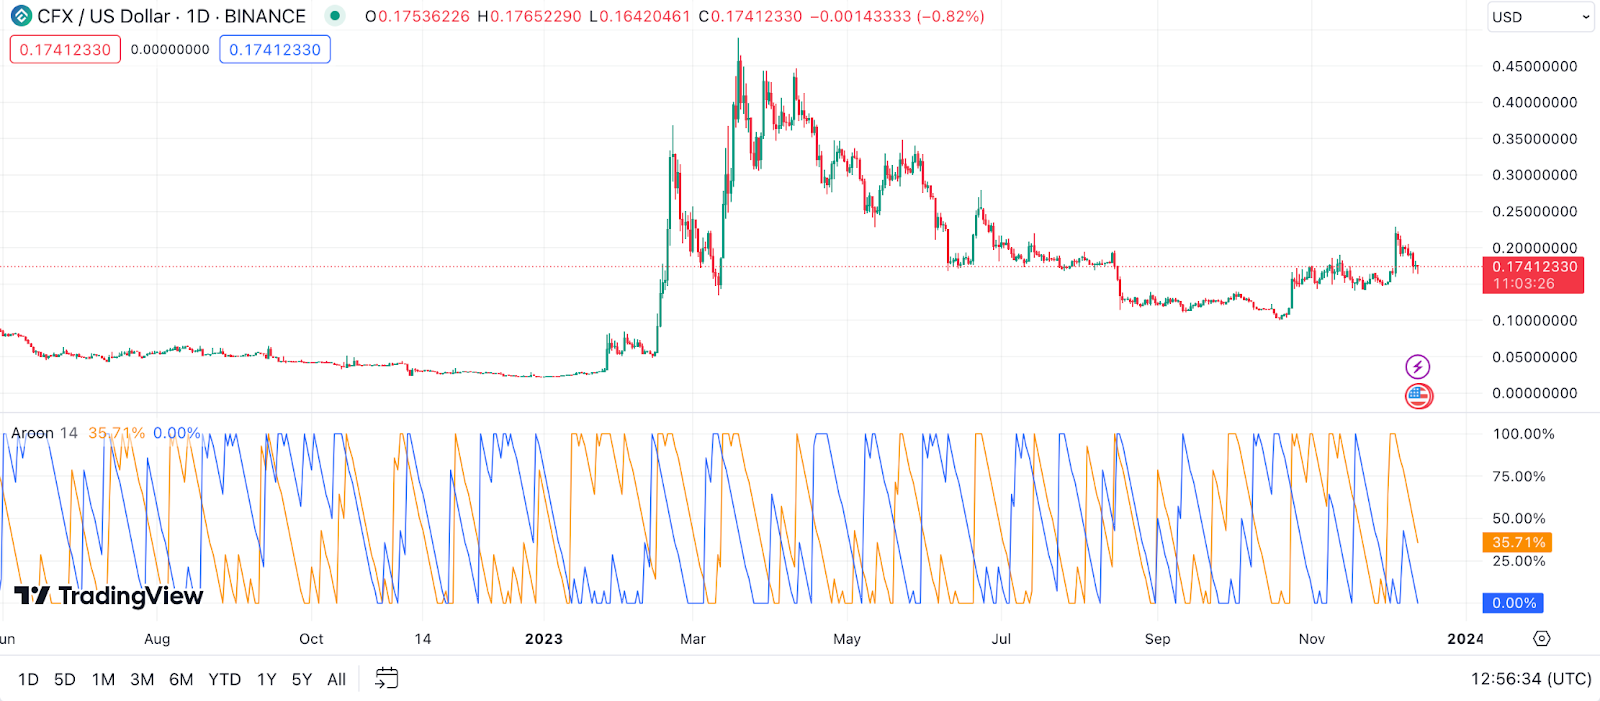
Example: If the Aroon Up line is high (above 70) while the Aroon Down line is low (below 30), it’s like the market signaling a strong uptrend in Conflux’s price. Conversely, if the Aroon Down line is high and the Aroon Up line is low, it could be an indication of a strong downtrend.
Gann Fan for Conflux Price Prediction
The Gann Fan is a bit more esoteric and is rooted in the idea that the market is geometric and cyclical. This tool is used to identify key support and resistance levels. It consists of lines at different angles that help predict areas of support and resistance in a trending market.
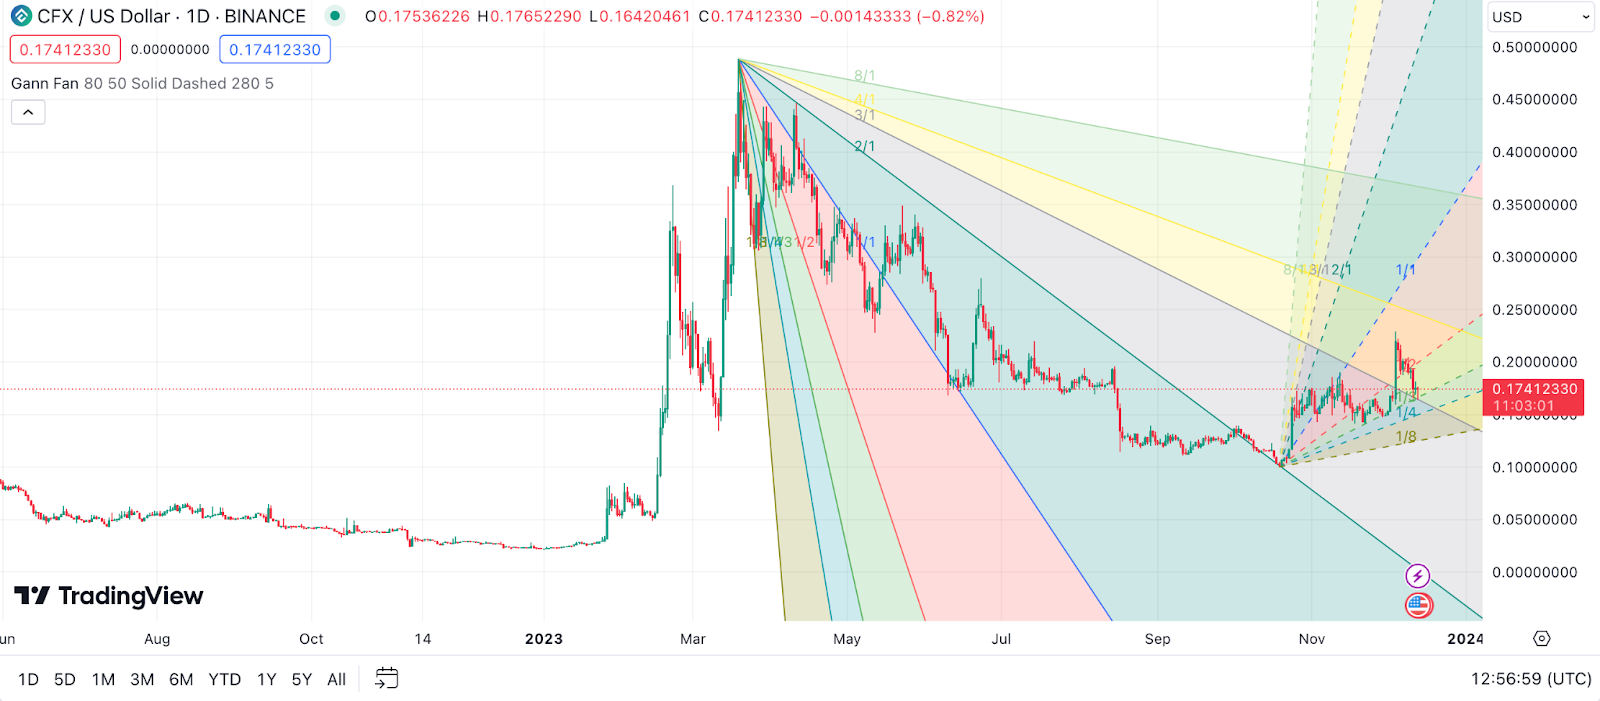
Example: When applying the Gann Fan to Conflux’s price chart, if CFX’s price moves along one of the Gann lines, it can be seen as following a certain trend with support or resistance at specific angles. Breaks from these lines might suggest potential shifts in the market trend or reversal points.
Keltner Channel for Conflux Price Prediction
Keltner Channel acts like a volatility-based envelope set above and below an exponential moving average. This indicator is similar to Bollinger Bands but uses the Average True Range (ATR) to set the channel distance. It’s great for spotting breakouts or overbought/oversold conditions.
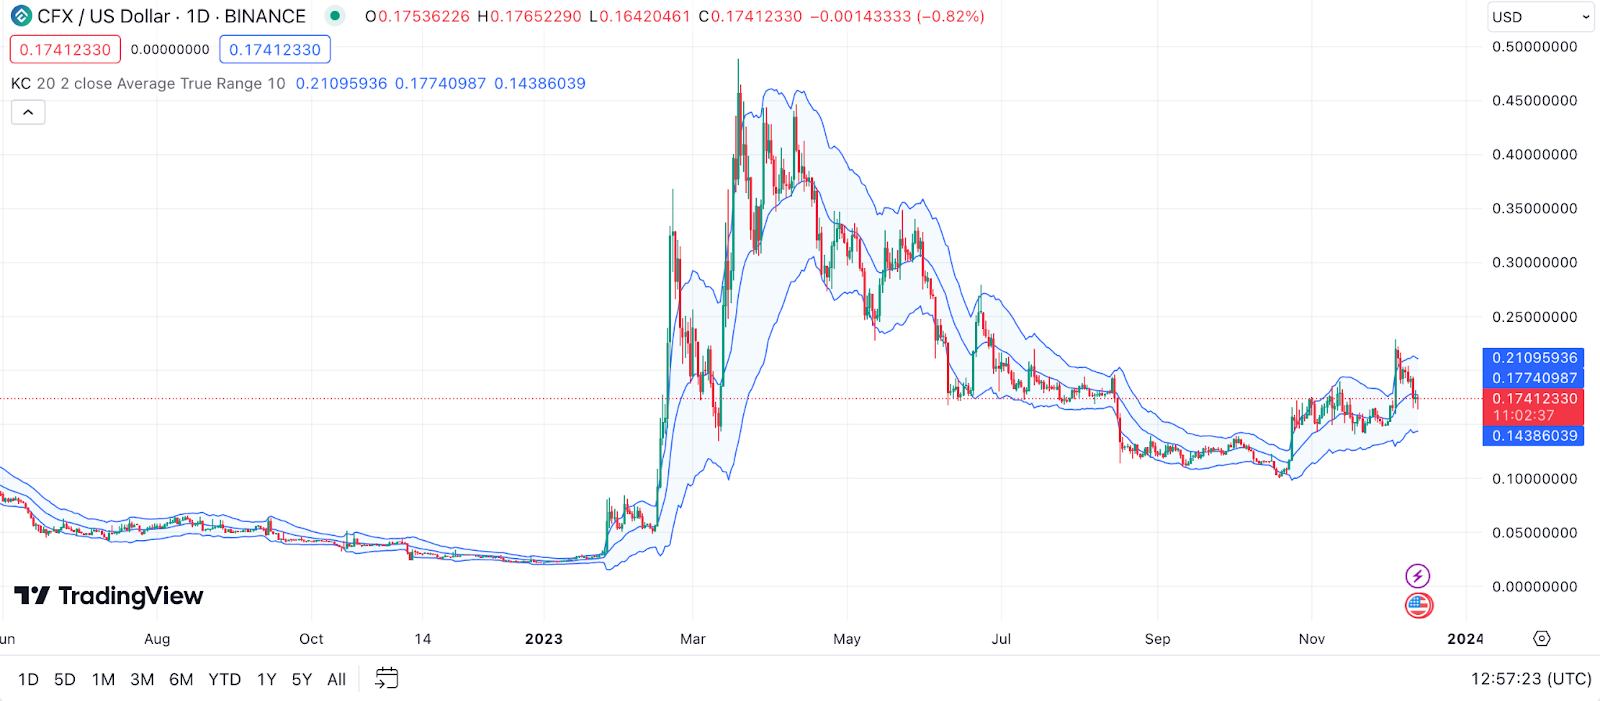
Example: If Conflux’s price breaks above the upper Keltner Channel, it might indicate the start of a strong bullish trend, hinting that CFX might continue to climb. On the other hand, if the price falls below the lower channel, it could suggest a strong bearish trend and a potential selling opportunity.
Money Flow Index (MFI) for Conflux Price Prediction
The Money Flow Index (MFI) is like your market thermometer, measuring the intensity of money flowing in and out of Conflux. It’s a bit like the Relative Strength Index (RSI), but with a twist – it takes both price and volume into consideration. The MFI oscillates between 0 and 100, and readings above 80 are typically considered overbought, while readings below 20 are considered oversold.
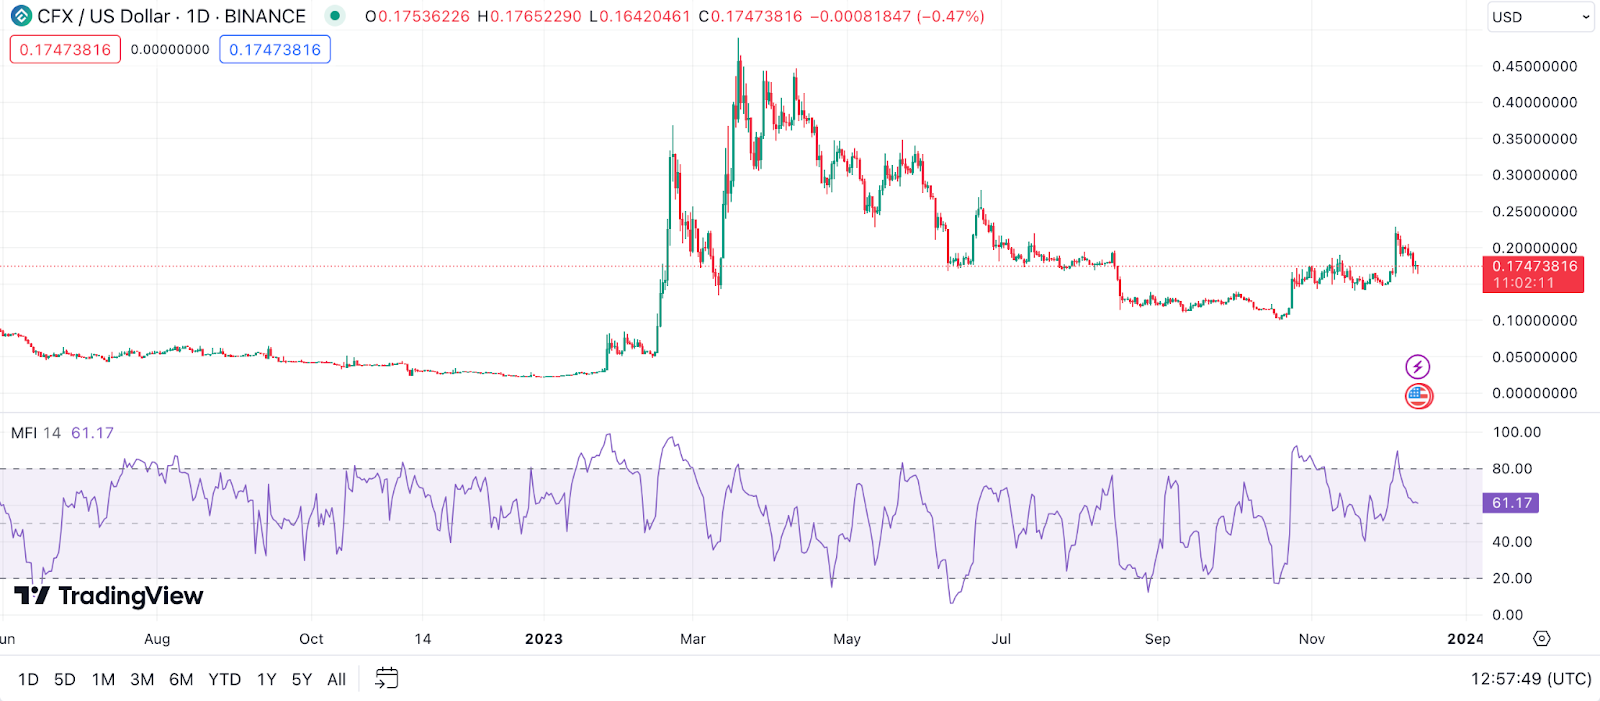
Example: If Conflux’s MFI climbs above 80, it might be a sign that CFX is becoming overbought, suggesting that a price correction could be around the corner. Conversely, if the MFI dips below 20, it could indicate that CFX is oversold, potentially setting the stage for a price rebound.
TRIX for Conflux Price Prediction
TRIX is a momentum oscillator that smooths out price fluctuations and shows the rate of change in a triple exponentially smoothed moving average. It’s a bit like looking at the crypto market through a high-definition lens, offering a clear view of the strength and direction of Conflux’s trend over time.
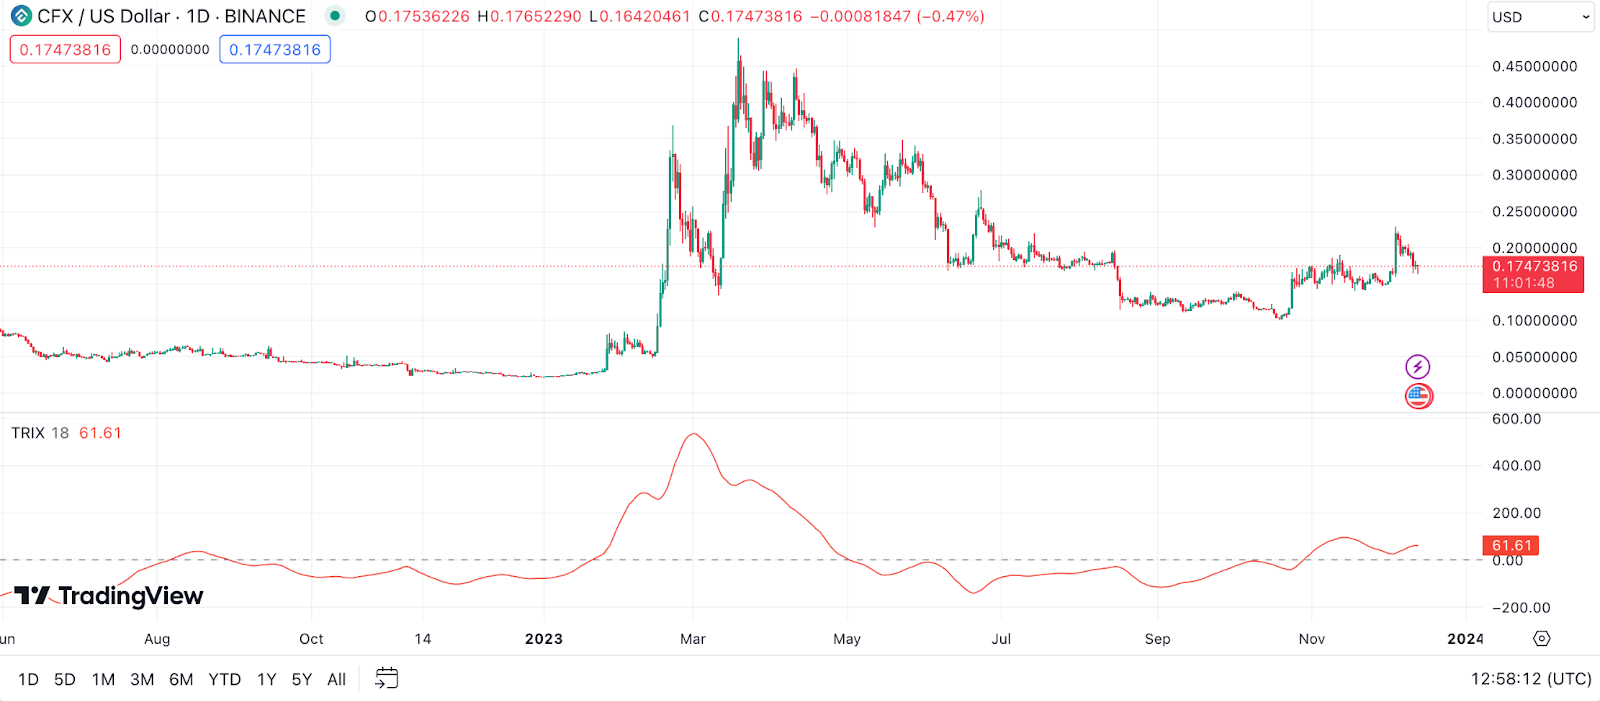
Example: A rising TRIX line can indicate strengthening momentum in Conflux’s price, suggesting that the current trend may continue. Conversely, if the TRIX line starts to decline, it could be a signal that the momentum is weakening, and a change in CFX’s price direction might be imminent.
The Zig Zag Indicator for Conflux Price Prediction
The Zig Zag indicator is like your navigation tool through the noisy crypto market, filtering out the small price movements to better highlight significant trends. By doing so, it can make it easier to identify major resistance and support levels, as well as chart patterns.
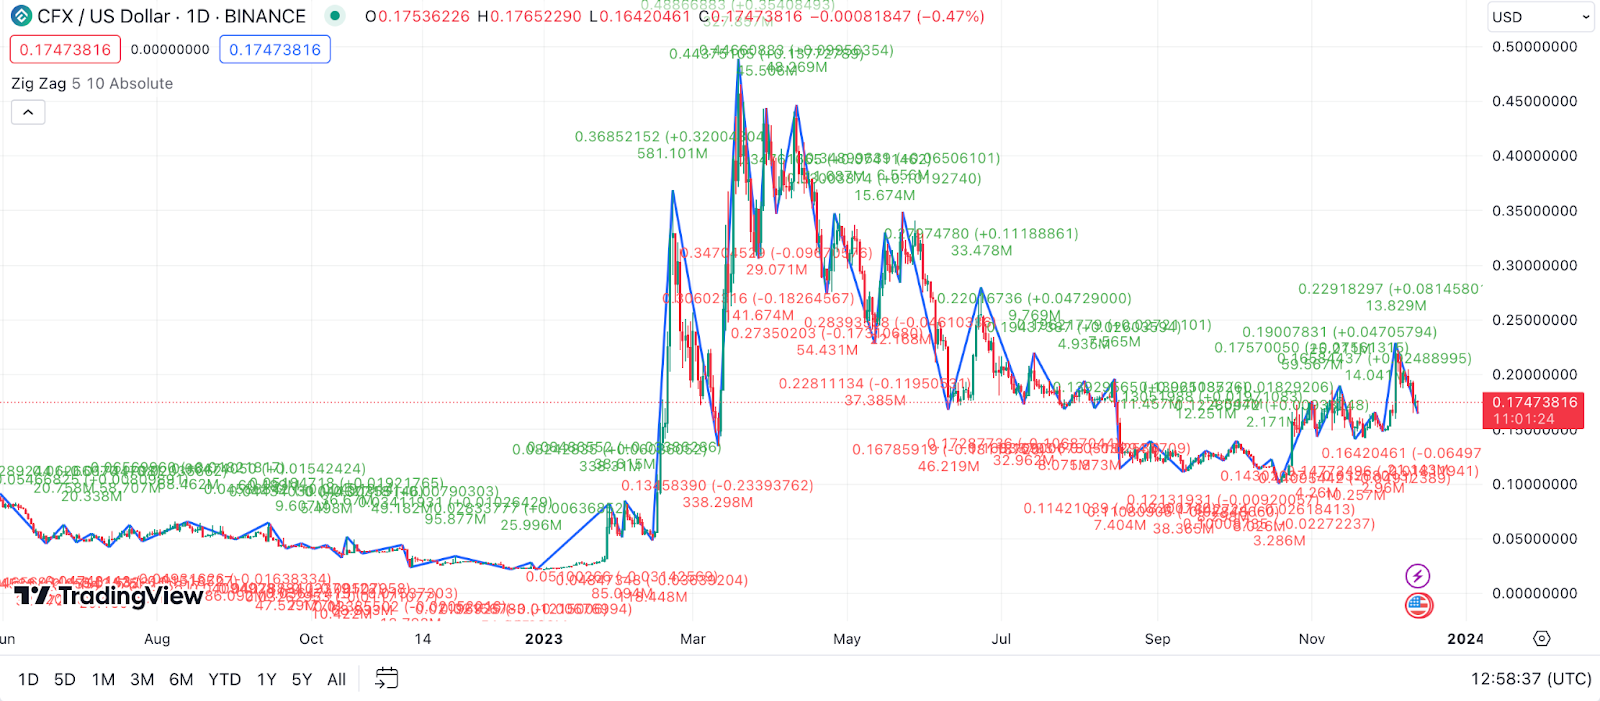
Example: When you apply the Zig Zag indicator to Conflux’s chart, it helps in clearing out the noise. If you notice the Zig Zag lines making higher highs and higher lows, it suggests an uptrend. On the other hand, lower highs and lower lows would indicate a downtrend for CFX.
Detrended Price Oscillator (DPO) for Conflux Price Prediction
The Detrended Price Oscillator (DPO) is like your time machine in the world of technical analysis. It removes the long-term trends from Conflux’s price data, helping you to identify cycles and overbought or oversold conditions more clearly. Essentially, DPO focuses on the shorter-term price cycles and ignores the broader trends.
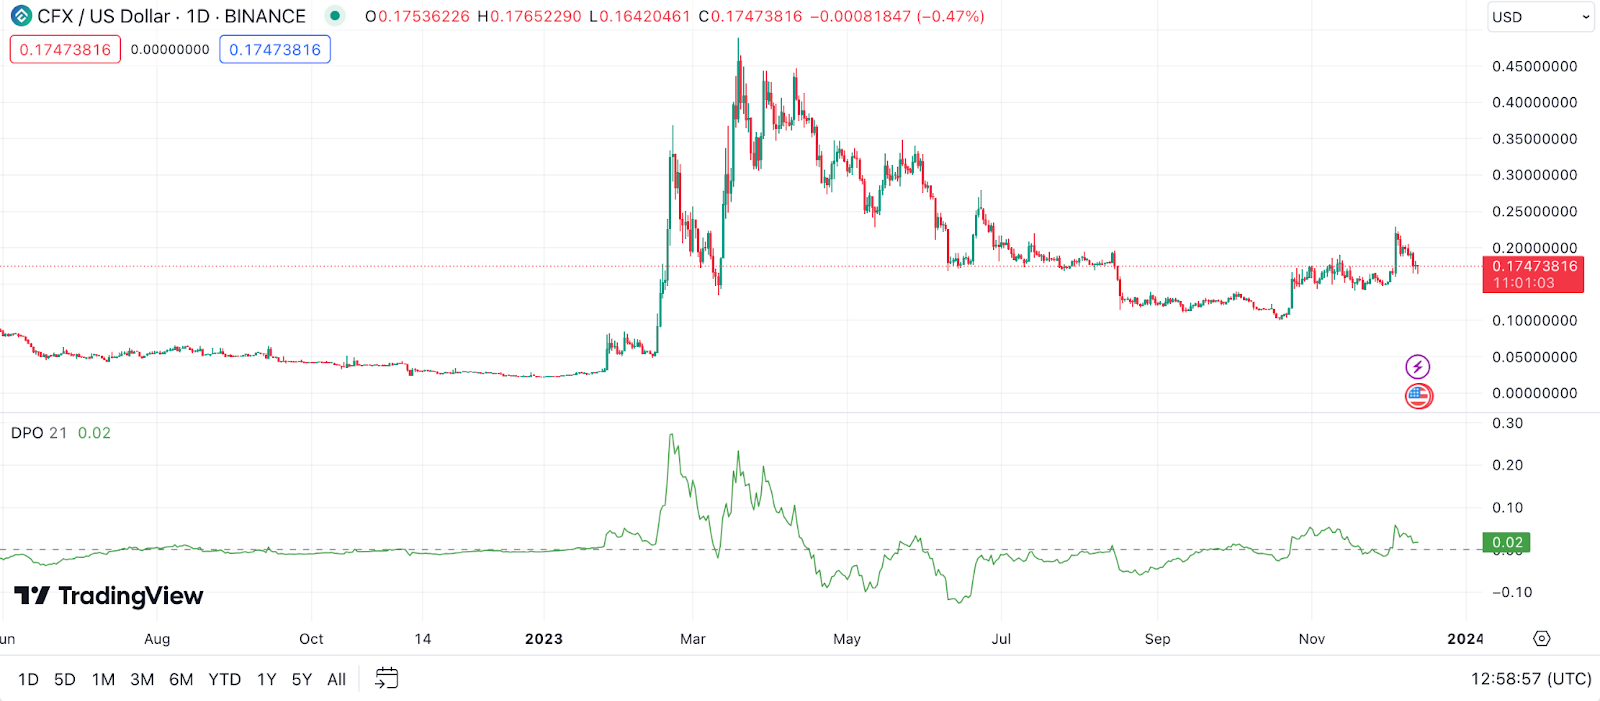
Example: If Conflux’s DPO is above the zero line and starts to turn down, it could signal that the short-term price is peaking and might start to decline. Conversely, if the DPO is below the zero line and begins to turn up, it suggests that the short-term price may be bottoming out and could start to rise.
Vortex Indicator (VI) for Conflux Price Prediction
The Vortex Indicator (VI) is like your crypto whirlwind meter. It’s designed to identify the start of a new trend or the continuation of an existing trend within Conflux’s price action. The VI consists of two lines: VI+ and VI-, which capture positive and negative trend movements.
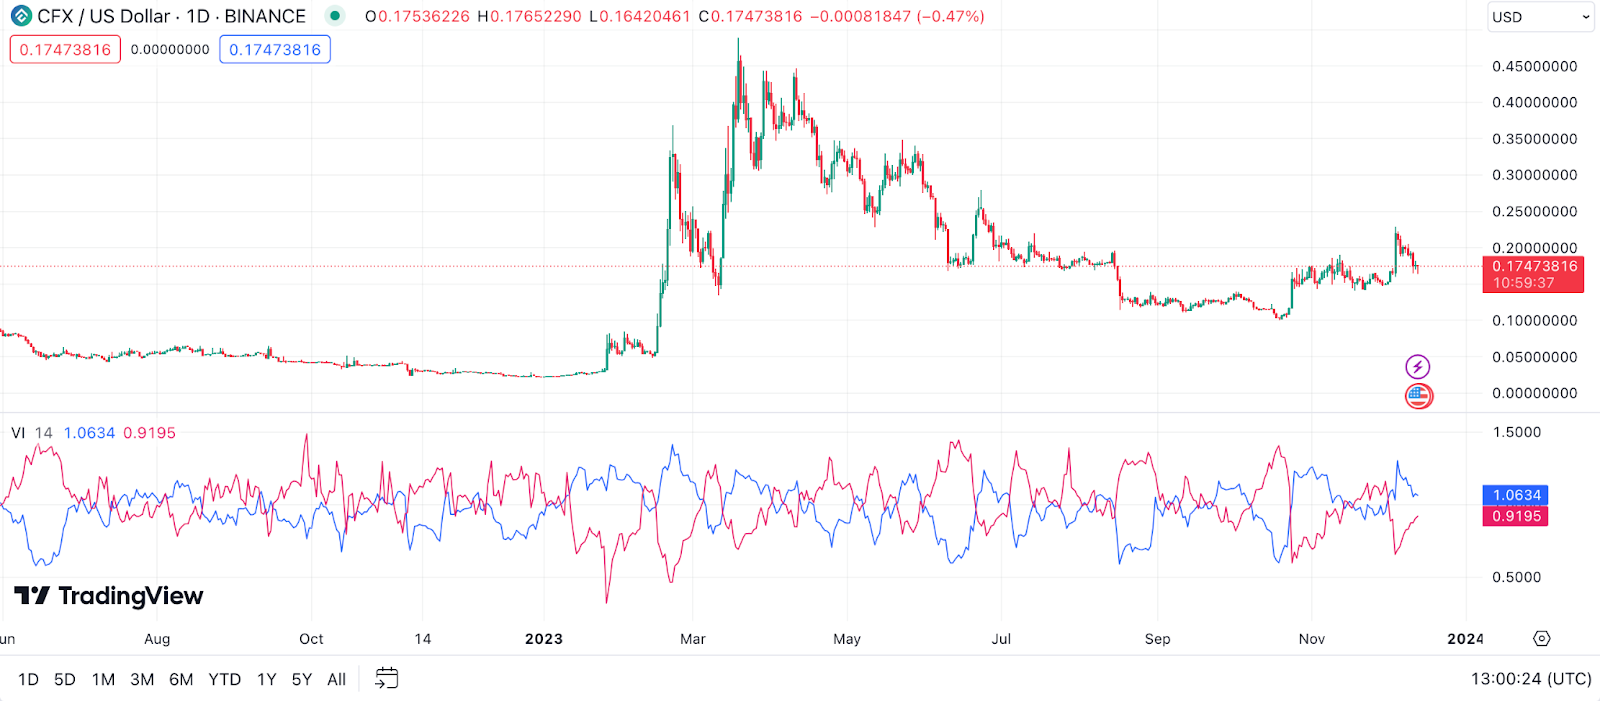
Example: In the Conflux market, if the VI+ crosses above the VI-, it’s a signal that bullish forces are gaining strength, potentially indicating a good time to buy. However, if the VI- crosses above the VI+, it suggests that bearish forces are taking over, potentially signaling a good time to sell or short CFX.
Elder’s Force Index (EFI) for Conflux Price Prediction
Elder’s Force Index (EFI) is your power gauge in the trading world. It combines Conflux’s price movements and volume to measure the ‘force’ behind price movements. The EFI can help identify potential reversals and price corrections.
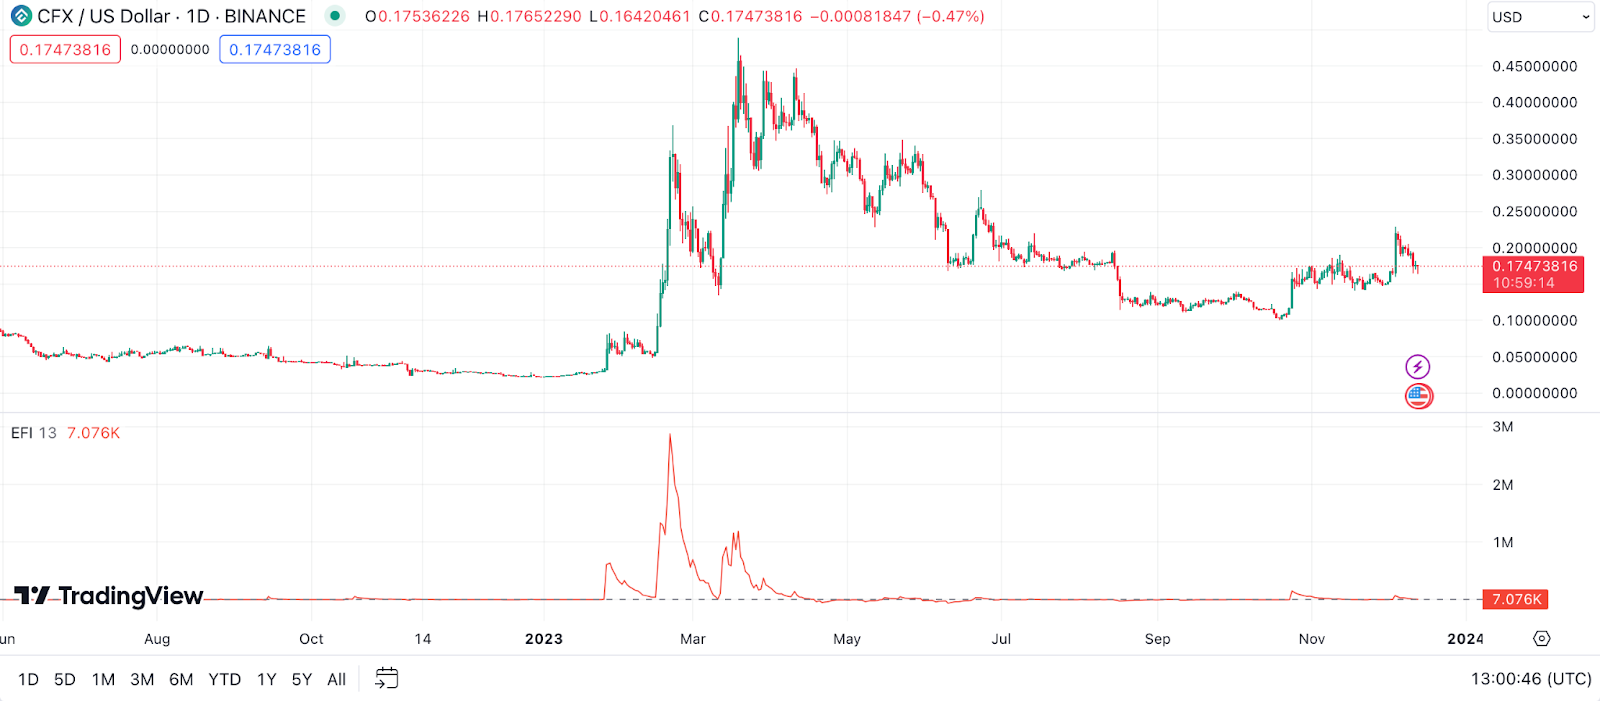
Example: A rising EFI alongside a rising price suggests that the upward trend in Conflux is strong and likely to continue. On the other hand, if the EFI is declining while the price is rising, it may indicate that the uptrend is weakening, and a reversal might be on the horizon.
Williams %R for Conflux Price Prediction
The Williams %R, often referred to as the Williams Percent Range, is like your market momentum radar. It’s a type of momentum indicator that moves between 0 and -100, helping to identify overbought or oversold conditions for Conflux (CFX). This tool is particularly useful for pinpointing market reversals and spotting buy and sell signals in the short term.
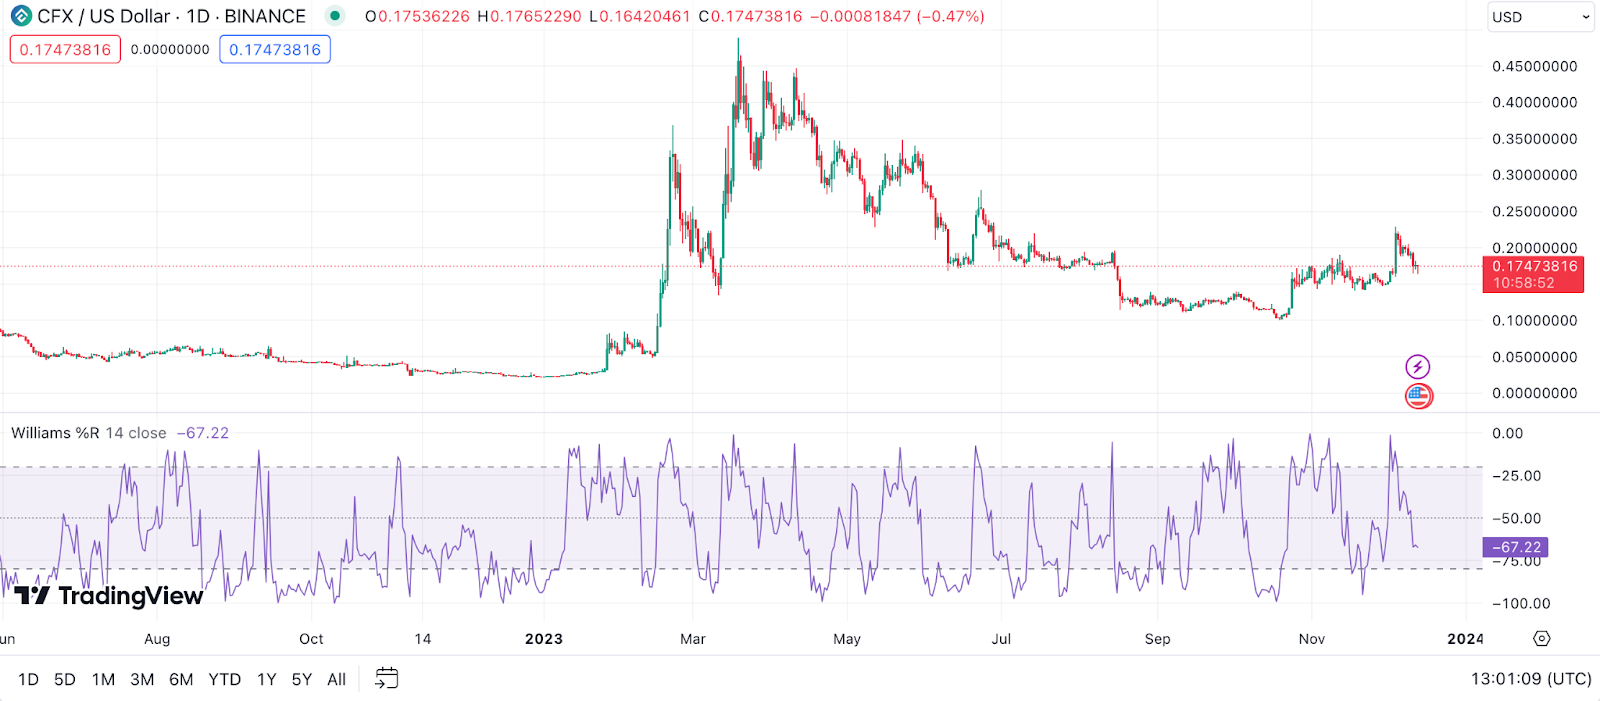
Example: If Conflux’s Williams %R dips below -80, it’s like the market whispering that CFX might be oversold, suggesting a potential upward reversal. Conversely, if the indicator rises above -20, it could be a hint that CFX is overbought, indicating a possible downward reversal.
Combining Technical Indicators for Accurate Conflux Price Prediction
When it comes to predicting Conflux (CFX) prices, just like in cooking, using one ingredient doesn’t always cut it. It’s all about the right mix!
The Importance of Using Multiple Technical Indicators
Relying on a single technical indicator for Conflux’s price prediction is a bit like trying to understand a movie by watching only one scene. You might get a glimpse, but the full picture? Not quite. Each indicator, whether it’s RSI, MACD, or Bollinger Bands, shines a light on different aspects of the market. When combined, they provide a more complete and reliable picture, helping to filter out false signals and increase the accuracy of your predictions.
How to Combine Various Indicators for a Comprehensive Analysis
Combining different indicators can be a bit of an art form, but here are some tips to make it more of a science:
- Mix Trend and Momentum Indicators: Start by pairing trend indicators like Moving Averages with momentum indicators such as the RSI or MACD. This helps confirm if the trend you’re seeing is backed by strong momentum.
- Use Volume Indicators as Confirmation: Volume indicators like On-Balance Volume (OBV) can be great confirmatory tools. If price and volume are moving in tandem, it’s often a stronger signal.
- Balance Leading and Lagging Indicators: Combine leading indicators, like the Stochastic Oscillator, which predict future price movements, with lagging indicators, like Moving Averages, which confirm trends based on past data.
- Watch for Divergence: Look for instances where the price action of Conflux diverges from what the indicators are suggesting. This can often signal potential trend reversals.
- Don’t Overload: While it’s tempting to use every tool in the shed, too many indicators can lead to analysis paralysis. Stick to a few that you understand well and that complement each other.
- Test and Refine: Always back-test your strategy using historical data. This can help refine your approach and increase your confidence in your analysis.
- Consider Market Context: Always analyze indicators within the broader market context. Factors like market news, global economic events, and industry developments can have significant impacts on Conflux’s price.
- Stay Updated: The crypto market is dynamic, with new patterns and trends emerging constantly. Keep educating yourself and stay abreast of new tools and techniques in technical analysis.
Remember, no method is foolproof. Market conditions can change rapidly, and even the best analysis can be upended by unforeseen events. The key is to stay flexible, keep learning, and never risk more than you can afford to lose. By blending various technical indicators thoughtfully, you can develop a more robust and informed trading strategy for Conflux.
The Pillars of Conflux Prediction: Fundamental Factors
In the crypto world, especially when it comes to Conflux (CFX), it’s not just about the charts and numbers. Let’s get into the nitty-gritty of what really moves the needle for CFX – the fundamental factors.
Adoption Rate
When we’re talking about the adoption rate of Conflux (CFX), it’s like measuring how fast a new fashion trend catches on. Here’s a deeper dive into what to look for:
- Ecosystem Development: How is the overall ecosystem around Conflux evolving? Look for new apps, tools, or services being built on the network. A growing ecosystem can lead to increased adoption.
- Public Perception: How is Conflux perceived in the crypto community and by the general public? Public opinion can greatly influence adoption rates.
- Academic and Institutional Interest: Are universities or research institutions showing interest in Conflux? Such interest can lead to innovations and increased credibility.
- Mainstream Media Coverage: Positive media coverage, especially in mainstream outlets, can attract new users and investors to Conflux.
- Community Engagement: Active engagement on forums, social media, and community events can be a strong indicator of a healthy, growing user base.
- Global Reach: Is Conflux making inroads into different global markets? Wider global reach can mean a higher rate of adoption.
Each of these points adds a layer to our understanding of how widely Conflux is being adopted and accepted. It’s like piecing together a puzzle – the more pieces you have, the clearer the picture becomes. Keep an eye on these factors, and you’ll have a better handle on where CFX might be headed in terms of adoption.
Regulatory Developments
Diving deeper into the regulatory side of things for Conflux (CFX), it’s like navigating through a maze that’s constantly shifting. Here’s more on what to keep your eyes peeled for:
- Emerging Global Standards: With countries working towards setting global crypto standards, any consensus reached can majorly impact CFX. It’s like watching the rules of the game being written in real-time.
- Specific Country Regulations: Keep an eye on major crypto markets like the US, EU, and Asia. Regulations in these areas can create ripples across the globe, affecting Conflux’s price.
- Central Bank Digital Currencies (CBDCs): The development of CBDCs could influence the entire crypto market, including CFX. It’s like watching traditional finance dip its toes into our crypto pool.
- Decentralized Finance (DeFi) Regulations: Since Conflux might interact with the DeFi space, any regulatory changes here could have direct implications.
- Taxation Laws: Changes in how cryptos are taxed, like capital gains tax, can influence investor behavior and thus impact CFX’s market performance.
- Regulatory Clarity: Sometimes, even the slightest hint of regulatory clarity can act as a catalyst for market movement. It’s like the market breathing a sigh of relief when the fog of uncertainty lifts.
Staying updated on these developments is crucial. They can be game-changers, either unlocking new potentials for Conflux or presenting hurdles. Always have your ear to the ground, and remember, in the crypto space, knowledge is as good as gold.
Utility
Peeking further into Conflux’s utility, it’s like exploring the different flavors in a gourmet dish. Each utility aspect adds a unique taste to Conflux’s overall appeal. Here’s more on how Conflux is being used in the real world:
- Gaming and Virtual Goods: Conflux is stepping into the gaming universe. It’s enabling secure and transparent transactions for in-game assets and virtual goods, revolutionizing how we interact with digital universes.
- Supply Chain Management: By leveraging blockchain, Conflux can offer transparent and efficient solutions for supply chain management. Imagine being able to track your product from the factory to your doorstep with CFX technology!
- Tokenization of Assets: Conflux is opening doors to tokenizing real-world assets. This means anything from real estate to art could be represented as tokens on the Conflux network, making them easier to trade and divide.
- Identity Verification: In a world where digital identity is crucial, Conflux’s blockchain can offer secure and immutable identity verification solutions. It’s like having a digital ID that’s tamper-proof.
- Interoperability with Other Blockchains: One of Conflux’s standout features is its ability to interact with other blockchains. This isn’t just about being neighborly; it’s about creating a network where different blockchains can talk to each other seamlessly.
Each of these use cases shows a different side of Conflux, highlighting its versatility and potential for widespread application. It’s like watching a tech-savvy Swiss Army knife in action. As you delve into Conflux, keep an eye on how these utilities evolve and get integrated into our digital lives. They’re not just cool features; they’re what give Conflux real-world value.
Market Sentiment: How CFX News Prediction Works
Diving deeper into market sentiment and its influence on Conflux (CFX), it’s like having your finger on the pulse of the crypto community. Sentiment is a tricky beast, but getting a handle on it can give you a real edge. Here’s more on how to tap into the mood around CFX:
- Analysis of Trading Volumes: A sudden spike or drop in trading volumes can speak volumes (pun intended) about market sentiment. It’s like the crowd getting louder or quieter about Conflux.
- Blockchain Data Analysis: By examining data directly from the Conflux blockchain, like wallet activities and token movements, you can get a sense of whether the sentiment is bullish or bearish.
- Technical Breakthroughs or Failures: News about technical advancements or setbacks can sway sentiment significantly. It’s like the market reacting to Conflux’s report card.
- Investor Forums and Discussion Boards: Sites like Reddit or CryptoCompare can be goldmines for sentiment analysis. They’re the digital town squares where the crypto community gathers to discuss and debate.
- Crypto Influencer Analysis: What prominent figures in the crypto world are saying about Conflux can hugely impact sentiment. Their opinions can spread like wildfire through the community.
- Algorithmic Sentiment Analysis Tools: There are tools out there that use algorithms to analyze market sentiment based on various online sources. They’re like your high-tech market mood rings.
Keeping a close eye on these factors can help you understand the ever-shifting tides of market sentiment surrounding Conflux. Remember, in the crypto world, sentiment can change rapidly, often in the blink of an eye. So, always stay agile, stay informed, and use sentiment analysis as one of the many tools in your trading toolbox.
The Bottom Line: Making Your Own Conflux Price Predictions
Wrapping up our deep dive into Conflux’s price prediction, it’s been quite the journey, hasn’t it? We’ve listened to expert views, dissected charts with technical analysis, and combed through the fundamentals. It’s a bit like being a detective, piecing together clues from different sources to get the full picture.
Remember, in the dynamic world of crypto, blending these insights gives us a more rounded view of potential future scenarios for CFX. But as with any prediction, especially in the unpredictable world of cryptocurrency, there are no guarantees. My advice? Stay informed, stay agile, and always be ready to adapt to new information. Happy trading and may your crypto journey be as enlightening as it is profitable!
FAQ
When Will CFX Go Up?
Ah, the million-dollar question! Predicting the exact timing of price movements in crypto, including Conflux, is like trying to guess the next plot twist in a thriller novel. It’s complex and influenced by a myriad of factors like market trends, investor sentiment, and broader economic conditions. What we’ve learned is that keeping an eye on market developments, technical indicators, and fundamental analysis can offer clues. But remember, the crypto market is known for its volatility, so always be prepared for surprises before making an investment decision!
Should I Buy CFX?
Deciding whether to buy Conflux (CFX) isn’t a one-size-fits-all answer. It’s like choosing the right outfit for an occasion – it depends on your individual style (or in this case, your investment goals, risk tolerance, and the state of your current portfolio). It’s important to conduct thorough research, consider how CFX fits into your broader investment strategy, and maybe even consult with a financial advisor. Diving into Conflux’s technology, potential use cases, and market position can give you a clearer picture.
How High Can CFX Go?
Estimating the peak potential of Conflux is akin to predicting the ceiling of a rocket’s journey – exciting but uncertain. While some analysts might provide optimistic forecasts based on technical and fundamental analysis, it’s crucial to acknowledge that the crypto market is unpredictable and can be swayed by numerous external factors. Factors like technological advancements, market adoption, and regulatory developments can significantly influence CFX’s potential high. As always, approach these predictions with a blend of optimism and caution.
Will CFX Crash Again in 2024?
The possibility of a crash is an ever-present reality in the volatile world of cryptocurrencies, and Conflux (CFX) is no exception. Predicting a crash, however, is like trying to forecast a storm’s exact arrival – tricky and not always accurate. Market sentiment, global economic conditions, and unexpected events can all contribute to significant price drops. It’s wise to stay informed about market trends, diversify your investments, and never invest more than you can afford to lose. Stay vigilant and always have a strategy to manage risks.