Hello, dear readers! Today, we’re diving into a fascinating journey through the waves of cryptocurrency markets, with a keen eye on Aptos price prediction 2024-2030. Navigating the volatile seas of crypto prices is no small feat, and APT is no exception. That’s why we’re dedicating this article to unravel the complexities behind predicting its value. We’ll explore Aptos’s intriguing history, its foundational goals, and the myriad of forecasting methods traders employ, enriched by expert insights along the way.
Predicting the price of APT involves more than just crystal ball gazing; it’s a blend of art and science. The volatility that defines cryptocurrencies makes this task particularly challenging. Yet, understanding these fluctuations is crucial. It helps investors make informed decisions, anticipate market trends, and navigate the investment landscape with greater confidence.
Why bother with predictions, you might ask? Well, in the realm of digital currencies, being ahead of the curve can significantly impact investment outcomes. Grasping the potential future value of APT can guide strategic planning, risk management, and ultimately, the pursuit of financial goals within the crypto space.
So, if you’re keen on getting ahead in the crypto game, stay with us. We promise insights, analyses, and a bit of forecasting fun that might just give you the edge you need in the ever-evolving world of cryptocurrencies. Let’s embark on this exploratory voyage together and uncover what the future might hold for Aptos!
Aptos (APT) Overview
| APT Price | $4.42 |
| APT Price Change 24h | -2.99% |
| APT Price Change 7d | -8.39% |
| APT Market Cap | $2,847,558,289.99 |
| APT Circulating Supply | 644,524,851.30 |
| APT Trading Volume | $111,988,518.05 |
| APT All-Time High (ATH) | $19.90 |
| APT All-Time Low (ATL) | $3.09 |
A Brief History: Aptos and Its Purpose
Diving into the world of Aptos, we uncover a narrative rich with ambition and innovation. Aptos, emerging as a beacon in the tumultuous seas of the cryptocurrency market, aims to redefine the landscape of blockchain technology. Its inception is rooted in the quest to address the perennial challenges of scalability, security, and usability that plague existing blockchain networks. The architects behind Aptos envision a platform where transactions are not just swift and secure, but also accessible to the masses, paving the way for widespread adoption of decentralized applications.
At the heart of Aptos lies a commitment to fostering a decentralized ecosystem where developers can craft applications with unprecedented efficiency and flexibility. This vision is underpinned by a robust infrastructure that emphasizes reliability and user-centric design, setting a new standard for blockchain technology. The purpose of Aptos extends beyond mere technical advancements; it seeks to empower communities, fuel innovation, and unlock new possibilities in the digital domain.
Noteworthy APT Price Movements
The journey of APT’s value mirrors the dynamic and often unpredictable nature of the crypto world. Below are some pivotal moments that have shaped its market trajectory:
- The Initial Surge: APT made headlines with its meteoric rise shortly after its launch, captivating investors and setting the stage for a rollercoaster ride in the crypto market.
- Turbulent Tides: Like many of its peers, APT faced its share of volatility, with significant dips that tested the resilience of its investor base.
- Recovery Phases: Each downturn was met with robust recovery periods, showcasing the underlying strength and confidence in Aptos’s long-term potential.
- Record Peaks: Amidst the ebb and flow, APT has reached remarkable highs, underscoring the fervent belief in its value proposition and future prospects.
Aptos – APT Price Prediction For Today, Tomorrow, This Week, and Next 30 Days
| Date | Price | Change |
|---|---|---|
| July 06, 2025 | 4.38 | -0.83% |
| July 07, 2025 | 4.34 | -1.00% |
| July 08, 2025 | 4.35 | 0.24% |
| July 09, 2025 | 4.34 | -0.24% |
| July 10, 2025 | 4.34 | 0.05% |
| July 11, 2025 | 4.35 | 0.16% |
| July 12, 2025 | 4.34 | -0.29% |
| July 13, 2025 | 4.38 | 1.00% |
| July 14, 2025 | 4.40 | 0.40% |
| July 15, 2025 | 4.36 | -0.73% |
| July 16, 2025 | 4.33 | -0.79% |
| July 17, 2025 | 4.33 | -0.07% |
| July 18, 2025 | 4.34 | 0.30% |
| July 19, 2025 | 4.31 | -0.79% |
| July 20, 2025 | 4.35 | 0.97% |
| July 21, 2025 | 4.34 | -0.16% |
| July 22, 2025 | 4.32 | -0.49% |
| July 23, 2025 | 4.30 | -0.51% |
| July 24, 2025 | 4.33 | 0.71% |
| July 25, 2025 | 4.35 | 0.56% |
| July 26, 2025 | 4.33 | -0.47% |
| July 27, 2025 | 4.35 | 0.36% |
| July 28, 2025 | 4.36 | 0.19% |
| July 29, 2025 | 4.33 | -0.57% |
| July 30, 2025 | 4.35 | 0.34% |
| July 31, 2025 | 4.36 | 0.38% |
| August 01, 2025 | 4.35 | -0.37% |
| August 02, 2025 | 4.32 | -0.62% |
| August 03, 2025 | 4.31 | -0.14% |
| August 04, 2025 | 4.27 | -0.97% |
Aptos Price Prediction 2024
Setting sail into the forecasting seas of Aptos for 2024 feels like exploring a mysterious territory full of excitement and the unknown. Let me be your guide on this thrilling journey through the twists and turns of crypto market prognostications, shedding light on what the future may hold for Aptos. Brace yourself for a voyage dotted with unexpected twists and turns.
Expect a bit of a wild ride with Aptos possibly taking a slight dip to $3.98, only to find its footing and climb to an average valuation of $4.64. And for those of you who thrive on high stakes, there’s a flicker of possibility that Aptos could soar to a high of $5.30.
Looking ahead to 2024, Aptos appears to be on a trajectory filled with promise. We may not see the kind of heart-stopping volatility that keeps investors glued to their screens, but a steadier path with enough ups and downs to make the story captivating. If you’re thinking about adding some variety to your crypto portfolio, Aptos might just be an interesting addition.
For enthusiasts enchanted by the charm of Aptos, proceed with caution and thoughtful consideration. The crypto world is inherently laden with uncertainties, and Aptos is no exception to this rule. The wise move is to dive deep into research and stay alert to the shifting tides of market trends.
| Month | Minimum Price | Average Price | Maximum Price |
|---|---|---|---|
| February 2024 | 9.01 | 9.36 | 9.74 |
| March 2024 | 9.25 | 9.61 | 10.00 |
| April 2024 | 9.50 | 9.87 | 10.27 |
| May 2024 | 9.76 | 10.13 | 10.55 |
| June 2024 | 10.02 | 10.41 | 10.83 |
| July 2024 | 10.29 | 10.69 | 11.13 |
| August 2024 | 10.57 | 10.98 | 11.43 |
| September 2024 | 10.86 | 11.27 | 11.74 |
| October 2024 | 11.15 | 11.58 | 12.05 |
| November 2024 | 11.45 | 11.89 | 12.38 |
| December 2024 | 11.76 | 12.21 | 12.71 |
| January 2025 | 12.08 | 12.54 | 13.06 |
January 2024: Aptos Price Forecast
In the frosty dawn of 2024, Aptos shows promising signs of stability. The data whispers of a minimum price that stays cozy at $8.19, with an average that could heat up the market to $9.01. For those seeking thrills, the maximum price might just scale the peak of $9.36. Keep your wallets close and your strategies closer, as Aptos may just set a lively tempo for the year’s kickoff.
APT Price Forecast for February 2024
As we step into February, the love for Aptos might grow just a bit stronger. Market murmurs suggest a minimum price cushioning at $9.01, a comfortable average of $9.36 to keep things interesting, and who knows? Maybe a maximum price spike to $9.74, for those romantic enough to believe in February flings with fortune.
March 2024: Aptos Price Forecast
March marches in with a gentle push for Aptos, hinting at a minimum price of $9.25. It’s no bluster when I say the average could rise to $9.61, with a maximum price that might break through to $10.00. As the chill of winter thaws, Aptos investors might just find the spring in their step.
APT Price Forecast for April 2024
Come April, and it’s no fooling around with Aptos. The numbers tell a tale of a minimum price planting itself at $9.50, an average blossoming to $9.87, and a maximum price potentially budding to $10.27. April’s showers could bring May flowers, or in this case, a gentle rain of gains.
May 2024: Aptos Price Forecast
May swings in with the vibrant dance of spring, and Aptos might just join the party. Expect a minimum price to sway at $9.76, while the average price could waltz up to $10.13. And for the grand finale, a maximum price could leap to $10.55. Keep an eye on this rhythm, as the market’s melody could be quite the earworm.
APT Price Forecast for June 2024
As summer starts to sizzle, so could the price of Aptos. June’s forecast sees a minimum price lounging at $10.02, an average price sunbathing at $10.41, and a maximum price possibly taking a dive into the deep end at $10.83. It’s a perfect time to ponder poolside about potential profits.
July 2024: Aptos Price Forecast
July’s forecast for Aptos sparks fireworks in the market, with a minimum price that could illuminate to $10.29, an average that may burst to $10.69, and a maximum price that could rocket up to $11.13. Independence from uncertainty might just be the theme for this month’s financial festivities.
APT Price Forecast for August 2024
August arrives with the simmering potential of Aptos prices. The minimum could anchor at $10.57, while the average may float to $10.98. And for those riding the summer wave, a maximum of $11.43 could be the crest to catch. Whether you’re lounging on the beach or glued to your screens, Aptos could be serving up some hot possibilities.
September 2024: Aptos Price Forecast
As the leaves begin to turn, Aptos could be turning a new leaf in its pricing. September whispers a minimum of $10.86, an average that could rustle up to $11.27, and a maximum price that might just reach a golden hue of $11.74. This month could be a harvest of opportunity for the keen-eyed investor.
APT Price Forecast for October 2024
October’s crisp breeze could carry in a refreshing outlook for Aptos. A sturdy minimum price of $11.15, an average that could climb to $11.58, and a maximum price scaling to $12.05 suggest a potentially fruitful month. Keep your gaze fixed on the horizon; Aptos might just be the apple of the market’s eye.
November 2024: Aptos Price Forecast
As we give thanks in November, Aptos might add to our bounty with a minimum price of $11.45. The average price could be a feast at $11.89, with a maximum price that could stuff the market up to $12.38. This month could serve up a cornucopia of possibilities for those seated at the trading table.
APT Price Forecast for December 2024
December rolls in with the promise of festive gains for Aptos. A minimum price of $11.76 could be the base of the tree, an average price of $12.21 the ornaments, and a maximum price of $12.71 might just top it off like a star.
Aptos Price Prediction 2025
Peering through the lens of our market expertise, Aptos’s price trajectory for 2025 shows a notable upward trend. Our detailed analysis indicates a minimal price of $11.95, which suggests a sturdy floor as investor interest remains robust. We’re projecting an average price hovering around $14.17, signaling steady growth amidst fluctuating market conditions. For those looking for a ceiling to their aspirations, the maximum price could reach an impressive $16.86, painting a bullish picture for the year.
| Month | Minimum Price | Average Price | Maximum Price |
|---|---|---|---|
| February 2025 | 11.95 | 12.41 | 12.91 |
| March 2025 | 12.27 | 12.74 | 13.26 |
| April 2025 | 12.60 | 13.09 | 13.62 |
| May 2025 | 12.94 | 13.44 | 13.99 |
| June 2025 | 13.29 | 13.80 | 14.37 |
| July 2025 | 13.65 | 14.17 | 14.76 |
| August 2025 | 14.02 | 14.56 | 15.15 |
| September 2025 | 14.40 | 14.95 | 15.56 |
| October 2025 | 14.79 | 15.35 | 15.98 |
| November 2025 | 15.18 | 15.77 | 16.41 |
| December 2025 | 15.59 | 16.19 | 16.86 |
| January 2026 | 16.02 | 16.63 | 17.31 |
Aptos Price Prediction 2026
As we cast our forecast net further into 2026, Aptos continues its ascent in the crypto firmament. The analytical consensus points to a minimal price of $15.84, maintaining its momentum from the previous year. With an anticipated average price of $18.80, it appears that the currency is poised for consistent growth. The maximum price is expected to surge to $22.36, suggesting that peak periods could generate significant buzz among traders and investors alike.
| Month | Minimum Price | Average Price | Maximum Price |
|---|---|---|---|
| February 2026 | 15.84 | 16.45 | 17.13 |
| March 2026 | 16.27 | 16.90 | 17.59 |
| April 2026 | 16.71 | 17.35 | 18.06 |
| May 2026 | 17.16 | 17.82 | 18.55 |
| June 2026 | 17.63 | 18.30 | 19.05 |
| July 2026 | 18.10 | 18.80 | 19.57 |
| August 2026 | 18.59 | 19.30 | 20.10 |
| September 2026 | 19.09 | 19.83 | 20.64 |
| October 2026 | 19.61 | 20.36 | 21.20 |
| November 2026 | 20.14 | 20.91 | 21.77 |
| December 2026 | 20.68 | 21.48 | 22.36 |
| January 2027 | 21.24 | 22.06 | 22.96 |
Aptos Price Prediction 2027
Delving into 2027, Aptos appears not to shy away from its upward climb. Our projections see it setting a minimal price baseline of $21.01, reinforcing a trend of year-over-year appreciation. The average price is calculated to be around $24.92, indicative of a maturing asset in a diversifying market. The year’s potential maximum price peak of $29.64 could offer lucrative exit points for the astute investor, should market conditions align.
| Month | Minimum Price | Average Price | Maximum Price |
|---|---|---|---|
| February 2027 | 21.01 | 21.81 | 22.71 |
| March 2027 | 21.57 | 22.40 | 23.32 |
| April 2027 | 22.16 | 23.01 | 23.95 |
| May 2027 | 22.75 | 23.63 | 24.60 |
| June 2027 | 23.37 | 24.27 | 25.26 |
| July 2027 | 24.00 | 24.92 | 25.94 |
| August 2027 | 24.65 | 25.59 | 26.64 |
| September 2027 | 25.31 | 26.29 | 27.36 |
| October 2027 | 26.00 | 27.00 | 28.10 |
| November 2027 | 26.70 | 27.72 | 28.86 |
| December 2027 | 27.42 | 28.47 | 29.64 |
| January 2028 | 28.16 | 29.24 | 30.44 |
Aptos Price Prediction 2028
Glancing towards 2028, the digital currency landscape for Aptos looks promising, reflecting a growing confidence in its technology and utility. With a minimal price of $27.85, it suggests a burgeoning floor value. The expected average price stands at $33.04, demonstrating the asset’s resilience and potential for sustained growth. The anticipation of a maximum price reaching $39.30 could entice a new wave of investment, bolstering the Aptos ecosystem.
| Month | Minimum Price | Average Price | Maximum Price |
|---|---|---|---|
| February 2028 | 27.85 | 28.92 | 30.11 |
| March 2028 | 28.60 | 29.70 | 30.92 |
| April 2028 | 29.37 | 30.50 | 31.75 |
| May 2028 | 30.17 | 31.33 | 32.61 |
| June 2028 | 30.98 | 32.17 | 33.49 |
| July 2028 | 31.82 | 33.04 | 34.40 |
| August 2028 | 32.68 | 33.93 | 35.32 |
| September 2028 | 33.56 | 34.85 | 36.28 |
| October 2028 | 34.47 | 35.79 | 37.26 |
| November 2028 | 35.40 | 36.76 | 38.26 |
| December 2028 | 36.35 | 37.75 | 39.30 |
| January 2029 | 37.33 | 38.77 | 40.36 |
Aptos Price Prediction 2029
Forecasting Aptos’s journey into 2029, the narrative of progress continues. A minimal price of $36.92 is indicative of a steadfast ascent in value, while the average price aims to stabilize at $43.80, offering a semblance of predictability in a typically volatile space. The maximum price for the year could potentially spike to $52.09, suggesting room for significant upside and heightened investor interest.
| Month | Minimum Price | Average Price | Maximum Price |
|---|---|---|---|
| February 2029 | 36.92 | 38.34 | 39.91 |
| March 2029 | 37.92 | 39.37 | 40.99 |
| April 2029 | 38.94 | 40.44 | 42.09 |
| May 2029 | 39.99 | 41.53 | 43.23 |
| June 2029 | 41.07 | 42.65 | 44.40 |
| July 2029 | 42.18 | 43.80 | 45.60 |
| August 2029 | 43.32 | 44.98 | 46.83 |
| September 2029 | 44.49 | 46.20 | 48.09 |
| October 2029 | 45.69 | 47.45 | 49.39 |
| November 2029 | 46.92 | 48.73 | 50.72 |
| December 2029 | 48.19 | 50.04 | 52.09 |
| January 2030 | 49.49 | 51.39 | 53.50 |
Aptos Price Prediction 2030
Turning the page to 2030, Aptos is envisioned to sustain its upward trajectory. The data suggests a minimal price of $48.95, showcasing continued investor trust. An average price of $58.07 could be the new norm, as the asset cements its place in the crypto market. Moreover, a maximum price of $69.06 could become a reality, potentially setting new records for the currency.
| Month | Minimum Price | Average Price | Maximum Price |
|---|---|---|---|
| February 2030 | 48.95 | 50.83 | 52.91 |
| March 2030 | 50.27 | 52.20 | 54.34 |
| April 2030 | 51.62 | 53.61 | 55.81 |
| May 2030 | 53.02 | 55.06 | 57.31 |
| June 2030 | 54.45 | 56.54 | 58.86 |
| July 2030 | 55.92 | 58.07 | 60.45 |
| August 2030 | 57.43 | 59.64 | 62.08 |
| September 2030 | 58.98 | 61.25 | 63.76 |
| October 2030 | 60.57 | 62.90 | 65.48 |
| November 2030 | 62.21 | 64.60 | 67.25 |
| December 2030 | 63.89 | 66.34 | 69.06 |
| January 2031 | 65.61 | 68.13 | 70.93 |
ApeCoin Price Prediction 2031
Advancing to 2031, and assuming the typo meant Aptos, not ApeCoin, the forecast remains optimistic. The minimal price is expected to be $64.89, indicating a persistent positive trend. The average price is likely to hover at $76.98, reflecting gradual, yet firm growth. And with a maximum price possibly reaching $91.56, the year could hold significant opportunities for long-term holders.
| Month | Minimum Price | Average Price | Maximum Price |
|---|---|---|---|
| February 2031 | 64.89 | 67.38 | 70.14 |
| March 2031 | 66.64 | 69.20 | 72.04 |
| April 2031 | 68.44 | 71.07 | 73.98 |
| May 2031 | 70.29 | 72.99 | 75.98 |
| June 2031 | 72.19 | 74.96 | 78.03 |
| July 2031 | 74.13 | 76.98 | 80.14 |
| August 2031 | 76.14 | 79.06 | 82.30 |
| September 2031 | 78.19 | 81.20 | 84.52 |
| October 2031 | 80.30 | 83.39 | 86.81 |
| November 2031 | 82.47 | 85.64 | 89.15 |
| December 2031 | 84.70 | 87.95 | 91.56 |
| January 2032 | 86.98 | 90.33 | 94.03 |
Aptos Price Prediction 2032
Looking out to 2032, Aptos seems to be on an unrelenting path of growth. A minimal price of $86.02 could be the testament to its enduring appeal, while an average price of $102.06 represents steady progress in a complex market. The maximum price, potentially hitting $121.38, may offer a glimpse into the asset’s long-term value proposition and its appeal to savvy investors in the cryptocurrency domain.
| Month | Minimum Price | Average Price | Maximum Price |
|---|---|---|---|
| February 2032 | 86.02 | 89.33 | 92.99 |
| March 2032 | 88.35 | 91.74 | 95.50 |
| April 2032 | 90.73 | 94.22 | 98.08 |
| May 2032 | 93.18 | 96.76 | 100.73 |
| June 2032 | 95.70 | 99.37 | 103.45 |
| July 2032 | 98.28 | 102.06 | 106.24 |
| August 2032 | 100.93 | 104.81 | 109.11 |
| September 2032 | 103.66 | 107.64 | 112.06 |
| October 2032 | 106.46 | 110.55 | 115.08 |
| November 2032 | 109.33 | 113.53 | 118.19 |
| December 2032 | 112.28 | 116.60 | 121.38 |
| January 2033 | 115.32 | 119.75 | 124.66 |
The Main Questions Of Critical Thinking When We Talk About Aptos Price Forecast
As we navigate the complexities of forecasting in the volatile world of cryptocurrencies, critical thinking is paramount. With the focus on Aptos price forecasts, it’s essential to ask the right questions to pierce through the fog of speculation and arrive at a more informed perspective.
- What underlying factors could lead to fluctuations in the Aptos market price?
- How might regulatory changes impact APT’s value in the short and long term?
- In what ways could technological advancements in blockchain influence Aptos’s price forecast?
- What historical data about APT can be considered most indicative of its future performance?
- How does the scalability of the Aptos network correlate with its potential market price?
- Could APT’s price be significantly affected by changes in the cryptocurrency adoption rates?
- What role do global economic events play in shaping the price predictions for Aptos?
- To what extent do market sentiments and investor behavior predict APT’s price movements?
- How could competition from other blockchain projects affect the price forecast for Aptos?
- Are there any emerging technologies that could disrupt APT’s market position and price?
- What are the potential risks of investing in Aptos based on its current price forecast?
- How reliable are the current predictive analytics tools for estimating APT’s future price?
- In what ways could the demand for decentralized applications impact Aptos’s price?
- Is there a correlation between APT’s trading volume and its price stability?
- How could partnerships and collaborations influence the future price of Aptos?
- What are the implications of APT’s coin supply on its price prediction models?
- How does the overall performance of the crypto market affect individual forecasts for Aptos’s price?
- Could the introduction of new features or updates to APT’s platform cause significant price changes?
- What can be learned from the price volatility of Aptos in comparison to other cryptocurrencies?
- How might the technological roadmap and milestones for APT influence investors’ confidence and the asset’s price?
In the quest to distill clarity from uncertainty, these questions serve as a beacon, guiding us through the speculative nature of price forecasting. They are not only a checklist but a framework to approach Aptos price predictions with a measured, analytical mindset.
Concluding, the ability to ask incisive questions is the cornerstone of sound investment strategy, especially within the unpredictable realm of cryptocurrency. Aptos price forecasts are no different; it’s the depth of inquiry that can often separate a well-founded prediction from mere conjecture.
Aptos (APT) Future Price Predictions by Experts
Jumping into the crypto game, I’ve been keeping an ear to the ground for what the crypto experts are saying about Aptos (APT).
- Wallet Investor: According to Wallet Investor, the future price for Aptos (APT) appears bearish. Their analysis suggests that APT could descend to $4.428 by the close of 2024. They anticipate an average price of $1.50 for APT in 2025. Looking ahead to 2028, they forecast that the Aptos token will average around $1.00.
- CoinCodex: CoinCodex’s projections for Aptos (APT) indicate a more optimistic future price in 2024, with a potential high of $11.49. Their predictions for 2025 show a wider range, from a low of $9.74 to a high of $38.97. For the year 2030, CoinCodex estimates that APT’s price could fluctuate between $28.17 and $35.66.
- CryptoPredictions: CryptoPredictions has a cautious stance on the APT’s future valuation, forecasting a drop to $5.658 in 2024. By the end of 2025, they foresee the Aptos token’s value at approximately $6.307. The platform also suggests that the price of Aptos (APT) is unlikely to break the $10 barrier, predicting a trade value of around $8.847 in 2027.
- DigitalCoinPrice: DigitalCoinPrice’s analysis for APT suggests a bullish scenario, with the Aptos token potentially reaching $29.16 in 2024, and climbing to $42.30 by 2025. Their long-term forecast for the end of the decade indicates that APT might close at $91.37. Further, they predict that in 2030, the Aptos token could be trading at $126.95, with a potential rise to $175.55 by 2031.
Here’s a straightforward investment advice: it’s beneficial to consider expert opinions, but they’re just one part of the equation. Their insights can guide you, but the bulk of your investment strategy should come from your own research and understanding of the market. Get to the core of the data, make sense of the trends, and that’s when you’ll gain real clarity on your investments.
Decoding the Charts: Aptos Technical Price Analysis
When we talk about charting the course for Aptos, it’s like piecing together a puzzle. Each bit of the chart tells a story, and it’s our job to put those stories together to see the bigger picture. Let’s break down some of the key tools of the trade:
- Candlestick Patterns: These are the bread and butter of chart reading. They’re like snapshots of price movements, giving us clues about market sentiment.
- Moving Averages: Imagine these as the rhythm of the market, smoothing out the noise to show us underlying trends.
- Volume Analysis: This is where we measure the heft behind price movements, asking, “Is there real weight behind this trend?”
- Support and Resistance Levels: They’re the battlegrounds where buyers and sellers push prices back and forth, setting the stage for breakouts or breakdowns.
- Trend Analysis: This is about spotting the direction where the market’s river is flowing. Are we paddling upstream or riding the current?
- Chart Patterns: These are the patterns we spot in the price charts that hint at what might come next, like the shapes you see in clouds predicting the weather.
- Timeframes: They give us perspective. Looking at different time frames can show us if we’re in a momentary blip or a long-term shift.
Technical Indicators: Origin and Purpose
Technical indicators aren’t just fancy lines on a screen; they’re the distilled wisdom of market behavior. Born from the need to make sense of the ups and downs of stock prices, these indicators have found a new home in the crypto world. They help us sift through the chaos of daily price movements to find order and patterns.
The Role of Technical Indicators in Financial Markets
In the hustle of financial markets, technical indicators are like our compass and map. They don’t predict the future, but they do shine a light on possible paths the market could take. By showing us the history of price action, they give us a way to gauge where we might be headed.
How Technical Indicators Can Help Predict APT Price
Now, with Aptos, technical indicators are the tools we use to carve out a potential future from the stone of past price action. They don’t hand us predictions on a silver platter but rather help us ask better questions. Is Aptos on a trend that’s likely to continue? Are we seeing signs of a reversal? It’s all about probabilities, and technical indicators help us play the odds with a bit more finesse.
Navigating the trading landscape, I’ve come across a few straightforward strategies to decode those complex charts. These methods aren’t a guaranteed shortcut to success, but they do offer clarity amidst the market’s volatility. My investing advice? Pair these strategies with a comprehensive analysis of market trends.
Let’s delve into some of these practical tips. I’ll outline how they can provide insights into APT’s future price movements. Consider this a straightforward exchange of ideas, offering you some tools to better manage the fluctuations in the cryptocurrency market.
Moving Averages (MAs) for Aptos Price Prediction
Moving Averages (MAs) are like the pulse check of the market, smoothing out price data over a specific period to give us a clearer view of the trend direction. They help in identifying the overall direction of the market, whether it’s an uptrend, downtrend, or sideways movement. The most common types are the Simple Moving Average (SMA) and the Exponential Moving Average (EMA), with EMA giving more weight to recent prices.
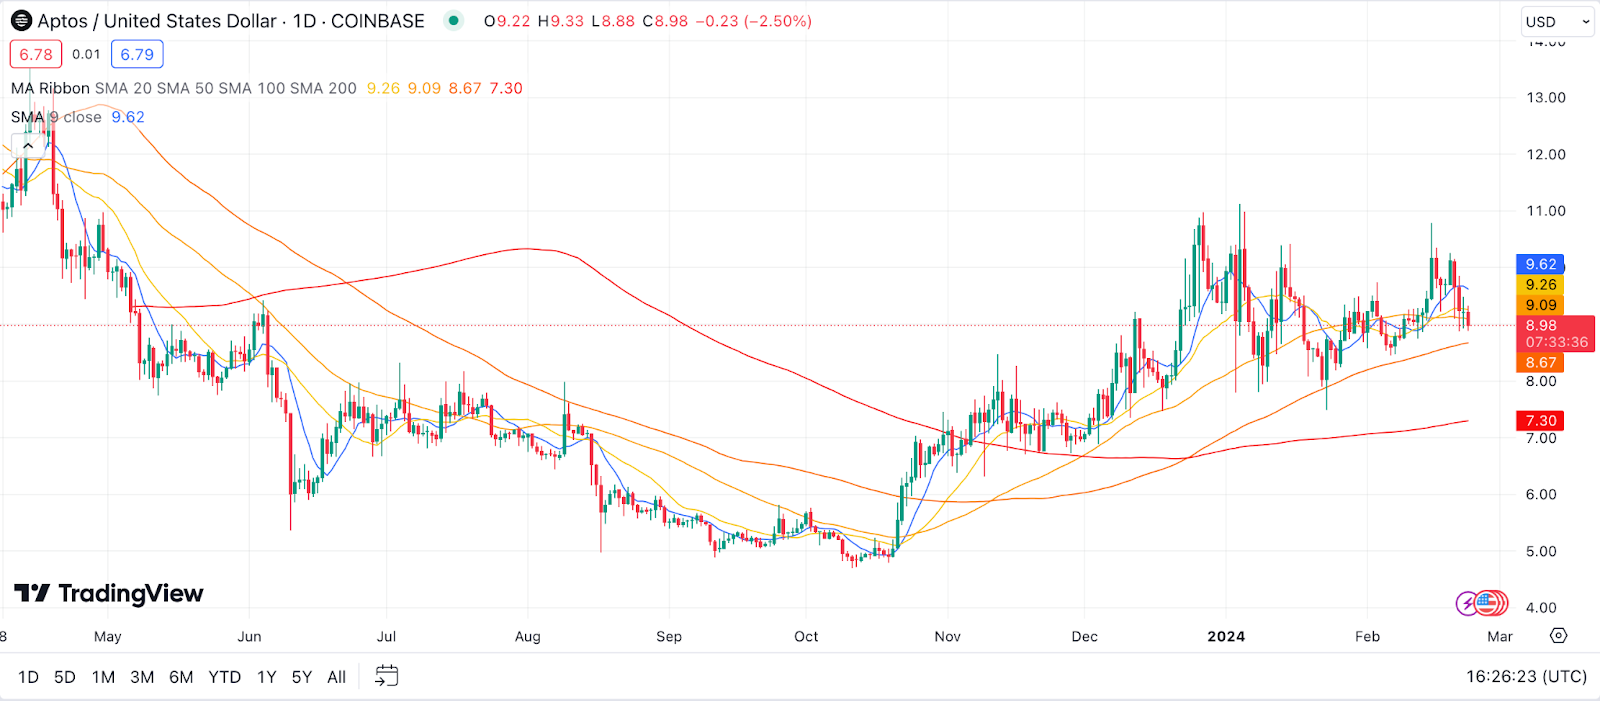
Example: Let’s say Aptos (APT) has been quite the rollercoaster, but you’re looking at its 50-day SMA. If APT’s current price is above this SMA, it might suggest that the overall trend is up, hinting at a good time to consider buying. Conversely, if APT is below its 50-day SMA, the market might be in a downtrend, suggesting caution.
Relative Strength Index (RSI) for Aptos Price Prediction
The Relative Strength Index (RSI) is a momentum oscillator that measures the speed and change of price movements, typically over a 14-day period. It operates on a scale from 0 to 100, with high and low levels marked at 70 and 30, respectively. An RSI above 70 suggests that an asset might be overbought (potentially overvalued), while an RSI below 30 indicates it could be oversold (possibly undervalued).
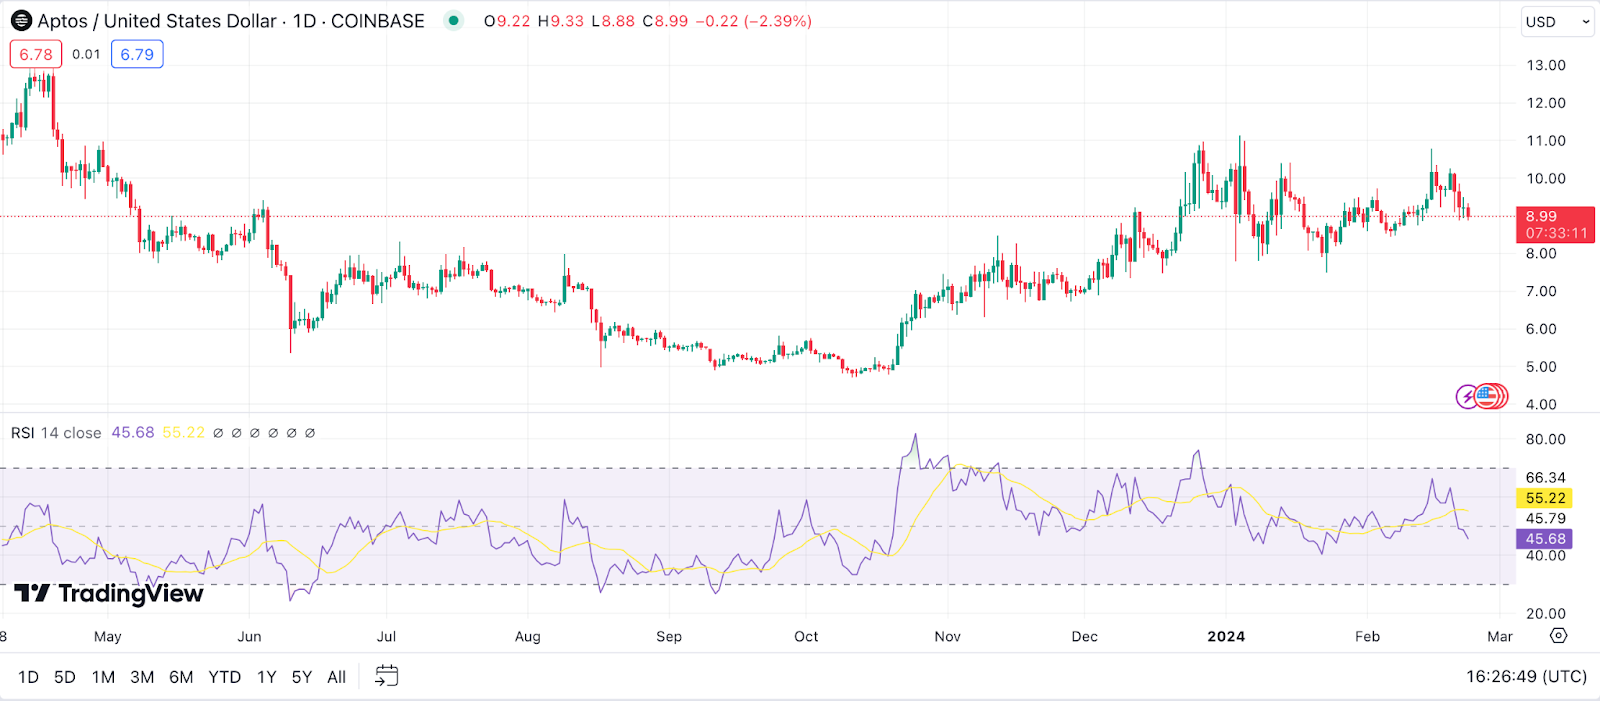
Example: Imagine you’re eyeing APT, and its RSI dips below 30. This might be a signal that APT is oversold, and a price rebound could be on the horizon, presenting a buying opportunity. On the flip side, if APT’s RSI climbs above 70, it could mean the coin is overbought, and a price correction might be imminent.
Moving Average Convergence Divergence (MACD) for Aptos Price Prediction
The Moving Average Convergence Divergence (MACD) is all about the relationship between two moving averages of a security’s price. It consists of the MACD line (the difference between the 26-day EMA and the 12-day EMA), the signal line (the 9-day EMA of the MACD line), and the histogram (the difference between the MACD line and the signal line). MACD signals potential buy or sell opportunities when these lines cross.
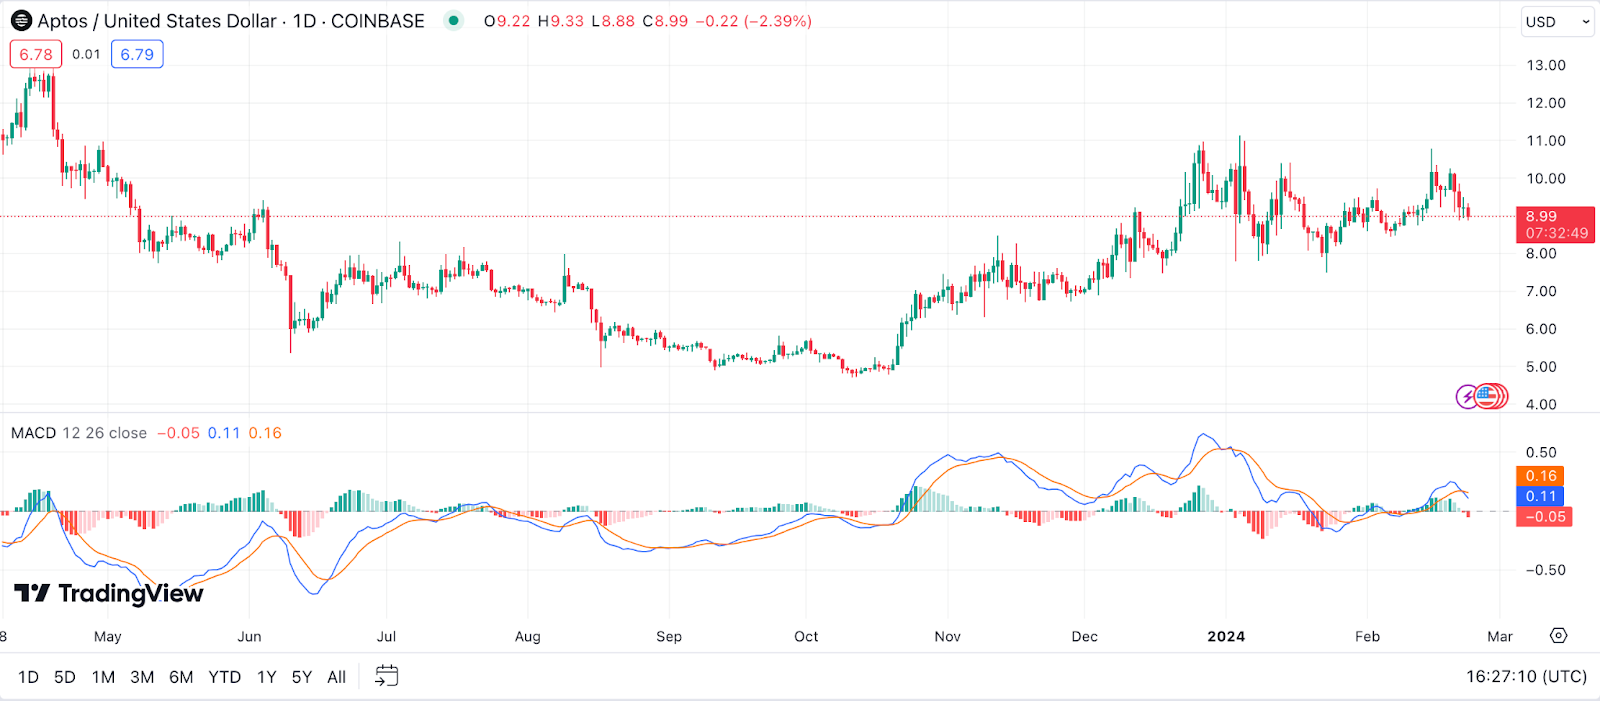
Example: For Aptos (APT), a MACD line crossing above the signal line could be a bullish signal, suggesting it might be time to buy. Conversely, if the MACD line crosses below the signal line, it could be a bearish signal, hinting that it might be time to sell. Watching these crosses in relation to the histogram can also add depth to your analysis, offering more nuanced insights into APT’s price momentum.
Bollinger Bands for Aptos Price Prediction
Bollinger Bands are a type of price envelope that expands and contracts based on market volatility. Created by John Bollinger, these bands consist of a middle SMA (usually a 20-day SMA) and two outer bands that are standard deviations away from the middle SMA. These bands help in identifying overbought or oversold conditions and potential market turning points.
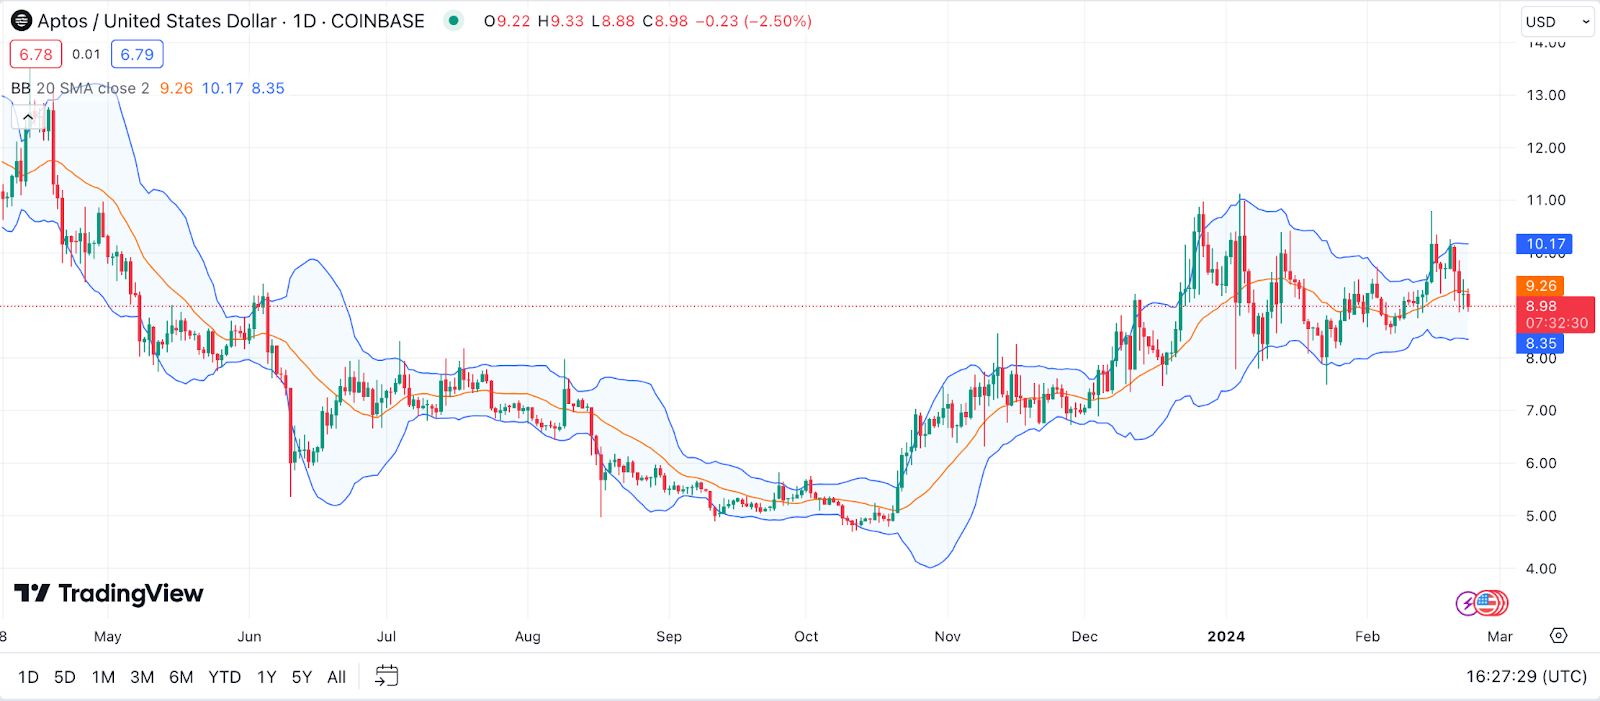
Example: For Aptos (APT), if the price touches or breaches the upper Bollinger Band, it might indicate that APT is overbought, signaling a potential sell-off or price pullback. Conversely, if APT’s price dips down to or breaks through the lower band, it could suggest an oversold condition, potentially signaling a buying opportunity as the price might bounce back.
Stochastic Oscillator for Aptos Price Prediction
The Stochastic Oscillator is a momentum indicator that compares a particular closing price of a security to a range of its prices over a certain period. It generates values between 0 and 100, with readings above 80 considered overbought and below 20 considered oversold. This indicator is useful for predicting price reversals, especially when two lines, %K and %D, cross each other.
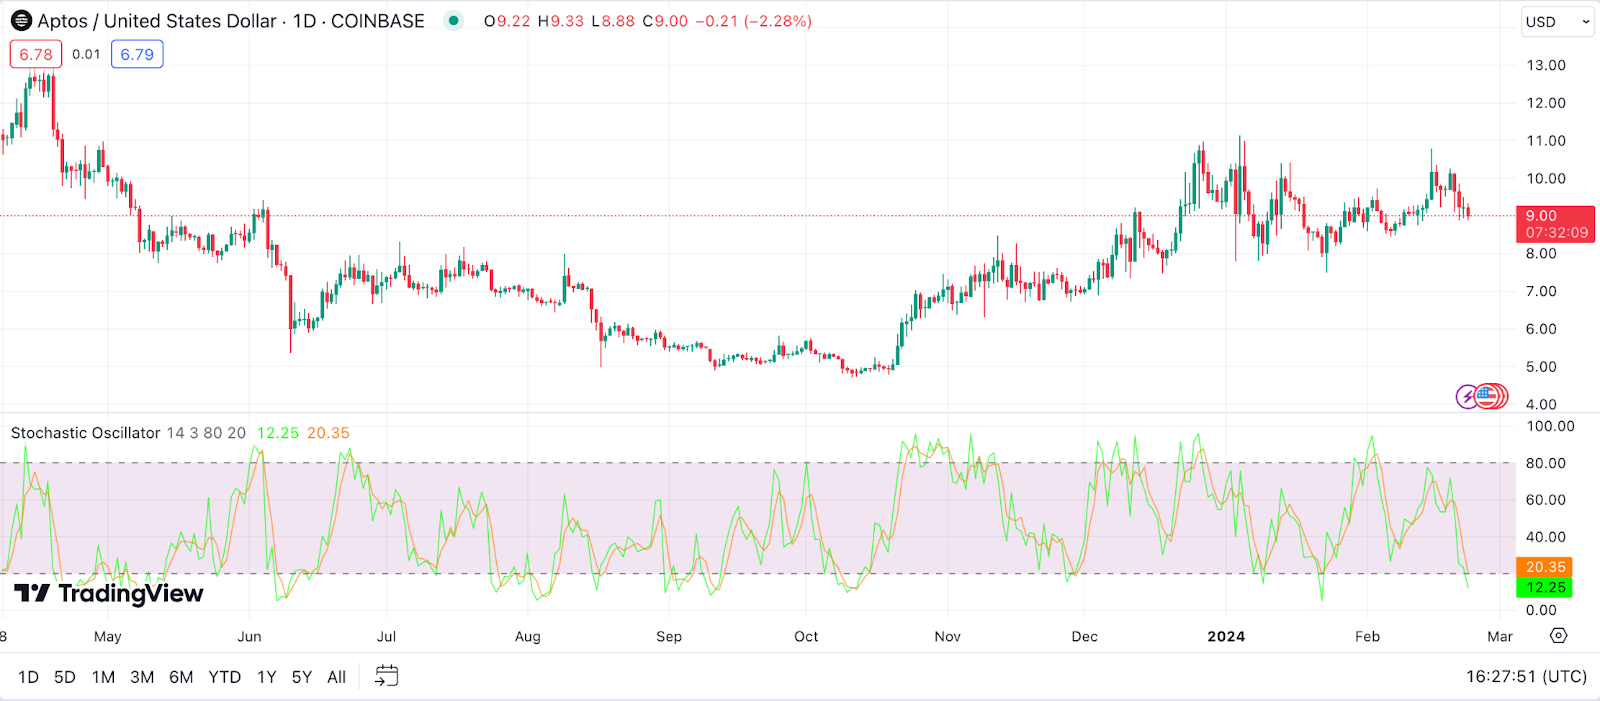
Example: If you’re tracking APT and notice the %K line crossing above the %D line under the 20 level, it could signal a potential upward price reversal, indicating a buying opportunity. On the flip side, if the %K line crosses below the %D line above the 80 level, it might suggest that APT is set for a downward correction, possibly a time to sell or hold off on buying more.
Parabolic SAR (Stop and Reverse) for Aptos Price Prediction
The Parabolic SAR (Stop and Reverse) is designed to find potential reversals in the market price direction of traded goods such as securities or currency exchanges like Aptos (APT). It appears as dots or points plotted on a chart above or below the price of an asset. A dot below the price is considered bullish, while a dot above is bearish, suggesting the direction of the trend.
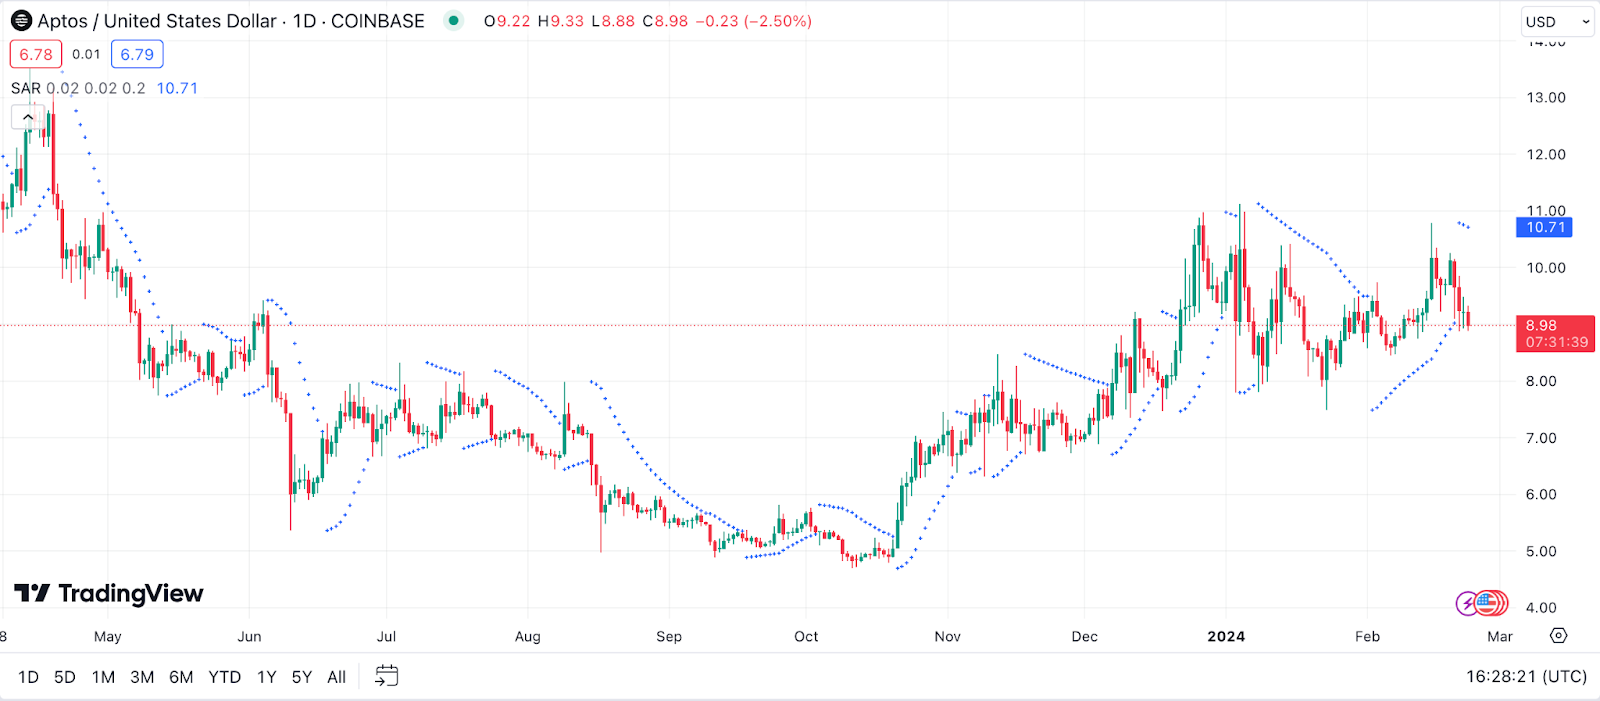
Example: When you observe the Parabolic SAR dots flip from being above APT’s price to below, it could indicate a bullish turn, suggesting a potential buy signal. Conversely, if the dots switch from below to above APT’s price, it might signal a bearish trend, potentially warning of a good time to sell or at least be cautious about further investments in APT.
Ichimoku Cloud for Aptos Price Prediction
The Ichimoku Cloud, or Ichimoku Kinko Hyo, is a comprehensive indicator that defines support and resistance, identifies trend direction, gauges momentum, and provides trading signals, all at a glance. It consists of five main components: Tenkan-sen, Kijun-sen, Senkou Span A, Senkou Span B, and Chikou Span. The “cloud” refers to the space between Senkou Span A and B and can indicate potential future support or resistance levels.
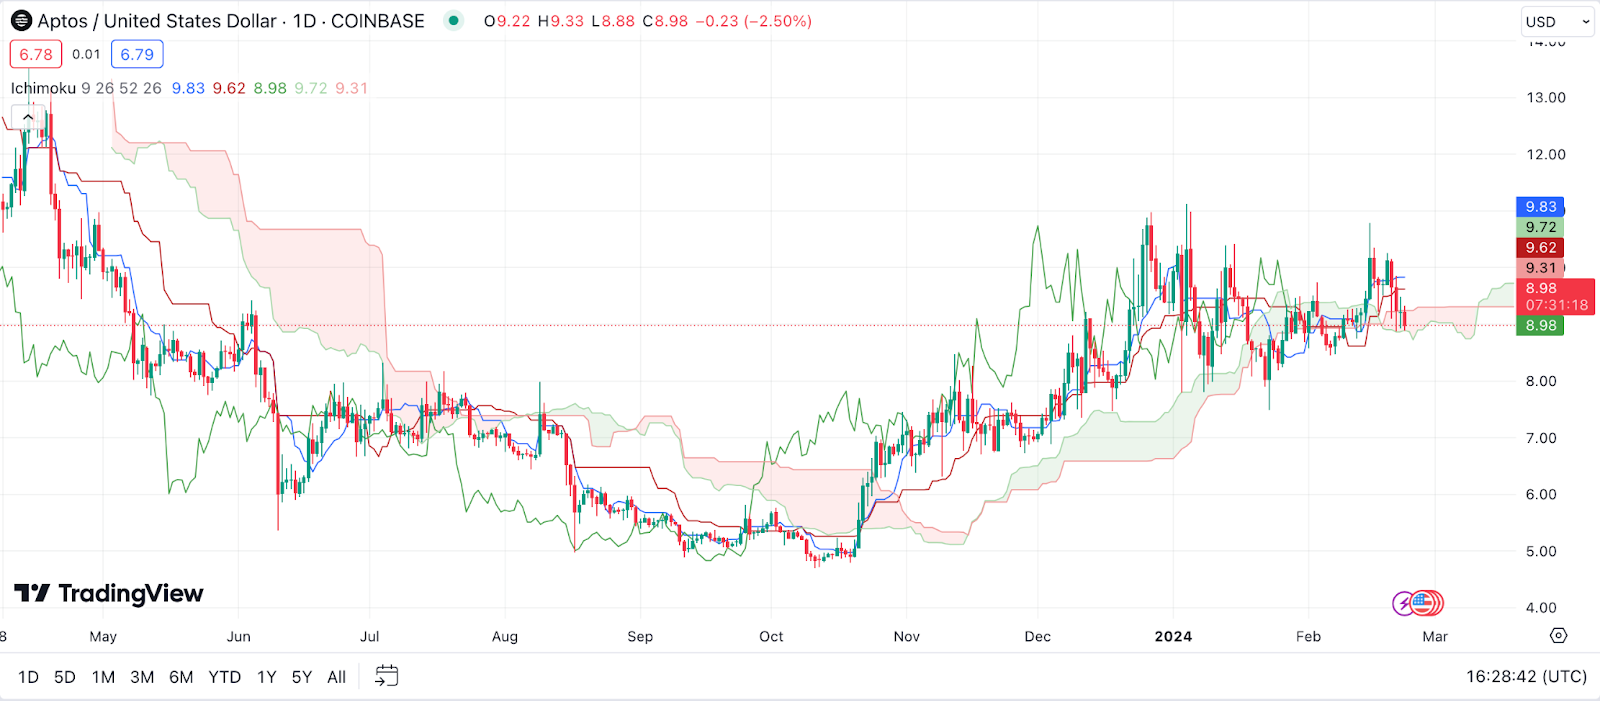
Example: If APT’s price moves above the Ichimoku Cloud, it could be a sign that the market is trending upwards, possibly a good time to buy. Conversely, if APT’s price falls below the Cloud, it might indicate a downward trend, suggesting a potential selling point. Watching the Cloud’s color change can also provide insights into market sentiment and potential trend reversals.
Fibonacci Retracement for Aptos Price Prediction
Fibonacci Retracement is a tool used to identify potential support and resistance levels based on Fibonacci numbers. Traders draw horizontal lines at percentages of Fibonacci sequence numbers — commonly 23.6%, 38.2%, 61.8%, and sometimes 50% and 78.6% — on a chart between a high and low point. These levels can indicate where prices might pause or reverse.
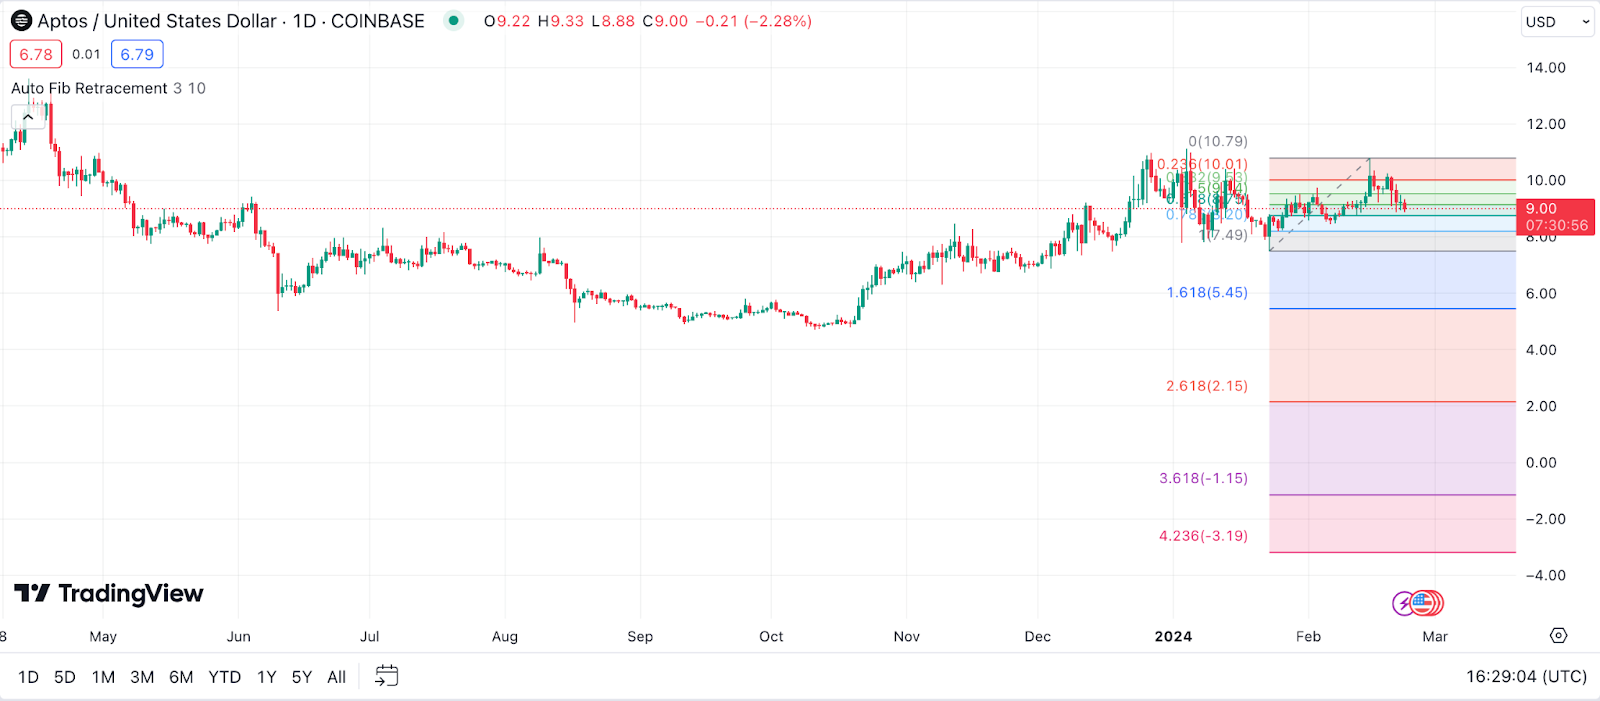
Example: Let’s say APT has experienced a significant rally and then starts to pull back. By applying Fibonacci Retracement levels to the chart, you might find that the 61.8% level aligns with a previous support area. If APT’s price bounces off this level, it could suggest a strong area of buying interest, potentially a good entry point for investors.
Average Directional Index (ADX) for Aptos Price Prediction
The Average Directional Index (ADX) is an indicator used to measure the strength of a trend, regardless of its direction. The ADX is part of the Directional Movement System developed by J. Welles Wilder and includes two other indicators: the Positive Directional Indicator (+DI) and the Negative Directional Indicator (-DI). An ADX value above 25 typically indicates a strong trend, either up or down, while values below 20 suggest a weak trend or trading range conditions.
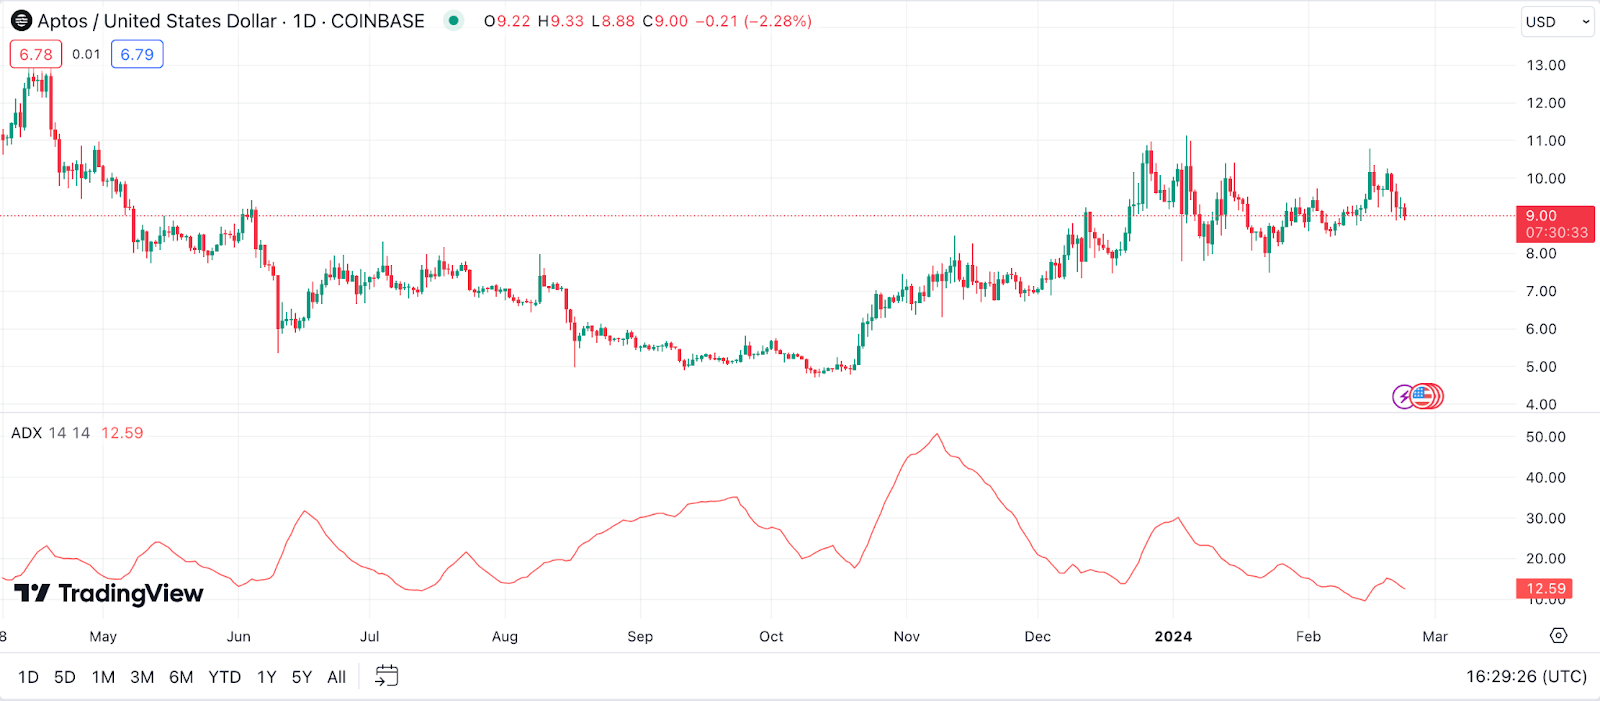
Example: If you’re analyzing APT and notice that the ADX is rising above 25 while the +DI is above the -DI, it could indicate a strong upward trend, signaling a potential buy opportunity. Conversely, if the ADX is above 25 and the -DI is above the +DI, it might suggest a strong downward trend, warning of a possible sell or hold strategy.
On Balance Volume (OBV) for Aptos Price Prediction
On Balance Volume (OBV) is a momentum indicator that uses volume flow to predict changes in stock price. The concept behind OBV is based on the distinction between smart money – supposedly knowledgeable investors who know when to buy or sell – and less sophisticated retail investors. OBV increases or decreases during each trading day in correlation with the price’s movement. Essentially, the theory posits that volume precedes price movement, so if a cryptocurrency like Aptos is experiencing an increase in OBV, it’s often thought that the price will follow.
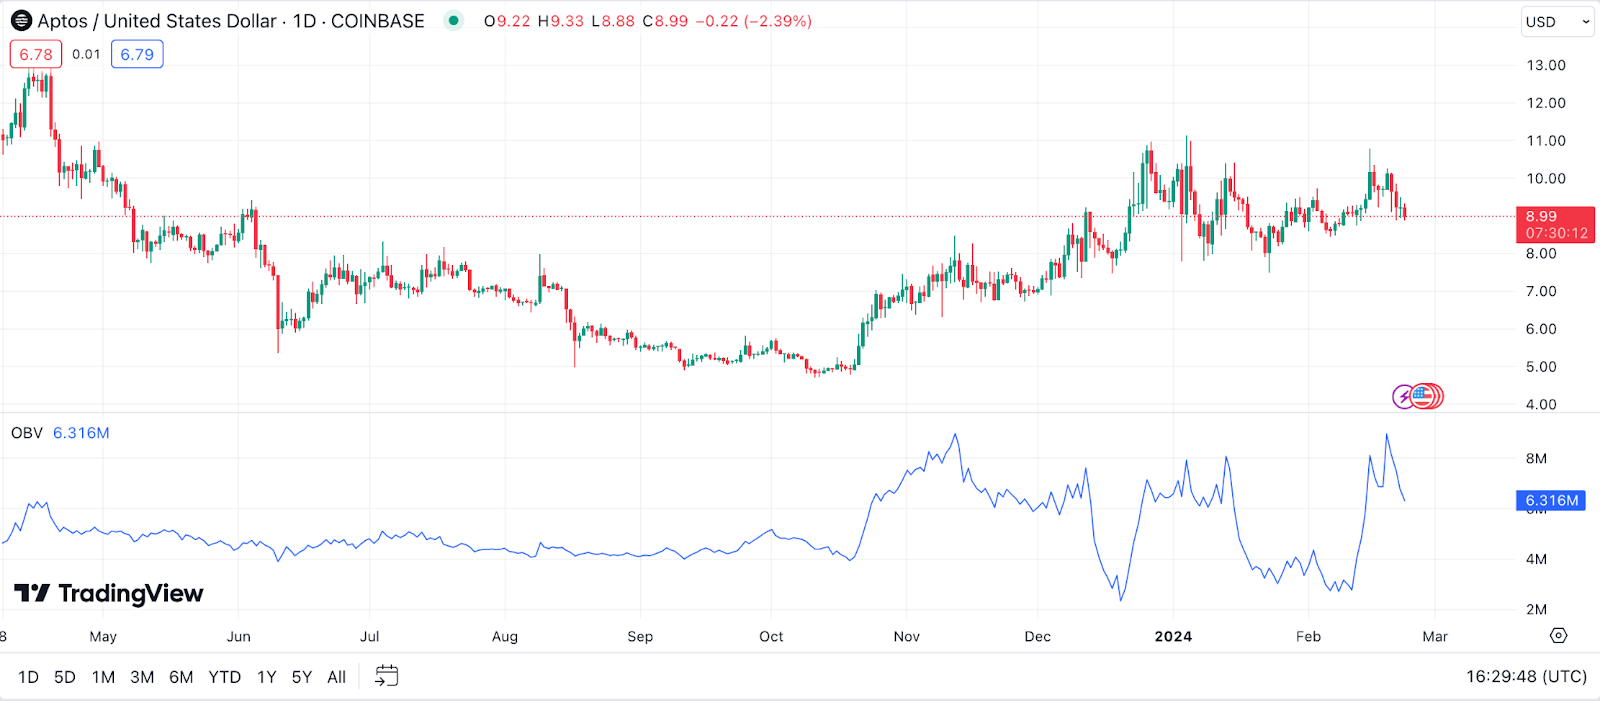
Example: If Aptos (APT) sees a significant uptick in OBV while its price is relatively stable, this could be an early indicator that a price surge is on the horizon, as it suggests accumulation by savvy investors. Conversely, if APT’s price is climbing but OBV is flat or declining, it might signal that the uptrend is not supported by volume and could be nearing its end.
Rate of Change (ROC) for Aptos Price Prediction
The Rate of Change (ROC) is a momentum oscillator that measures the percentage change in price between the current price and the price a certain number of periods ago. The ROC indicator signals bullish conditions when it moves above the zero line and bearish conditions when it crosses below, indicating the speed at which the Aptos price is changing. A rising ROC typically confirms an uptrend, while a falling ROC suggests a downtrend.
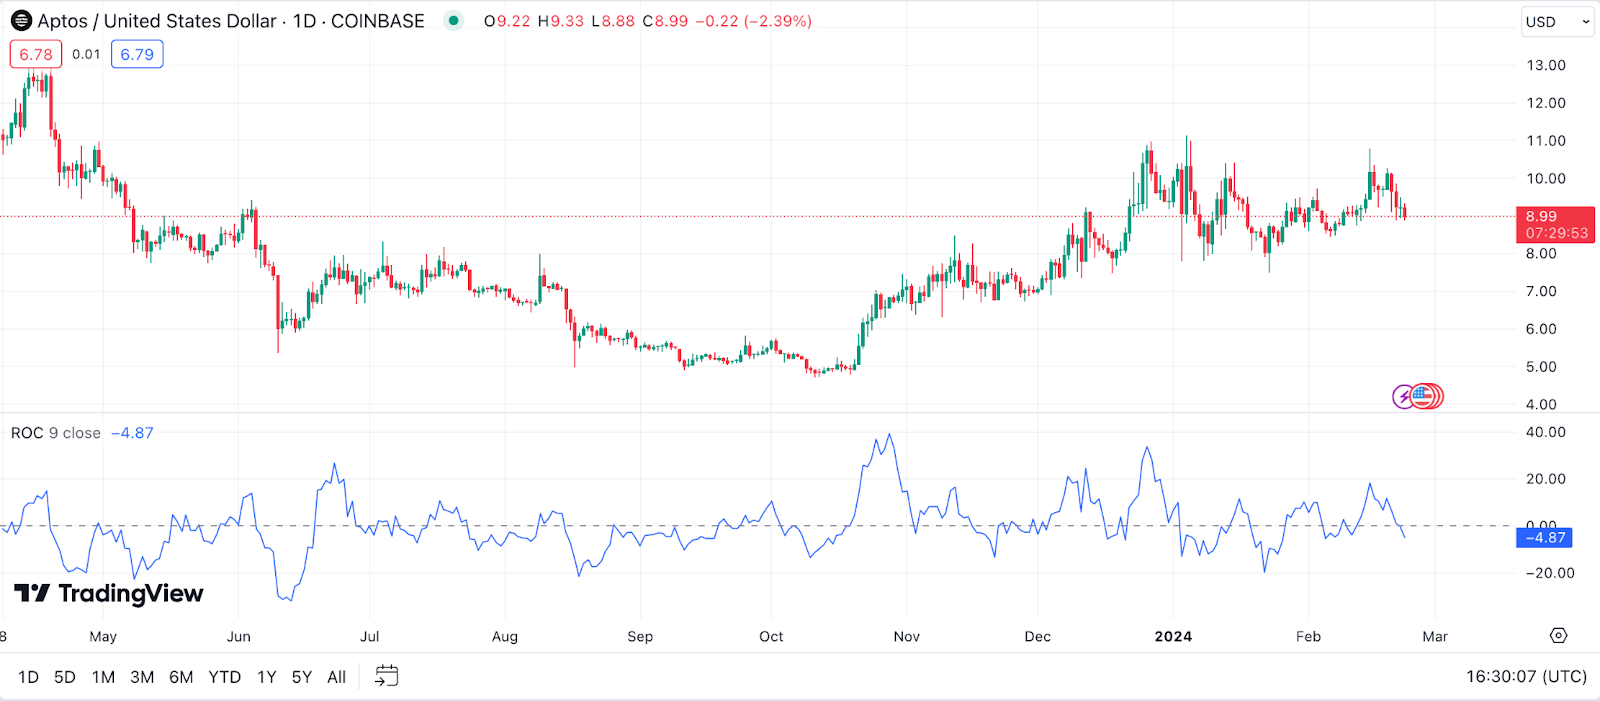
Example: Should the ROC for Aptos display a sharp increase and cross above the zero line, this might imply that APT’s price is gaining momentum upwards, potentially indicating a buying opportunity. On the flip side, if the ROC falls below the zero line, it could signal that APT’s price is on a downward trajectory, possibly advising caution or a sell strategy.
Commodity Channel Index (CCI) for Aptos Price Prediction
The Commodity Channel Index (CCI) is an oscillator used to identify cyclical trends in securities, including cryptocurrencies like Aptos. It compares the current price to an average price over a specific period. The CCI fluctuates above and below zero, with high readings indicating that the price is well above the historical average, and low readings suggesting the price is well below the average. This can help traders identify overbought or oversold conditions.
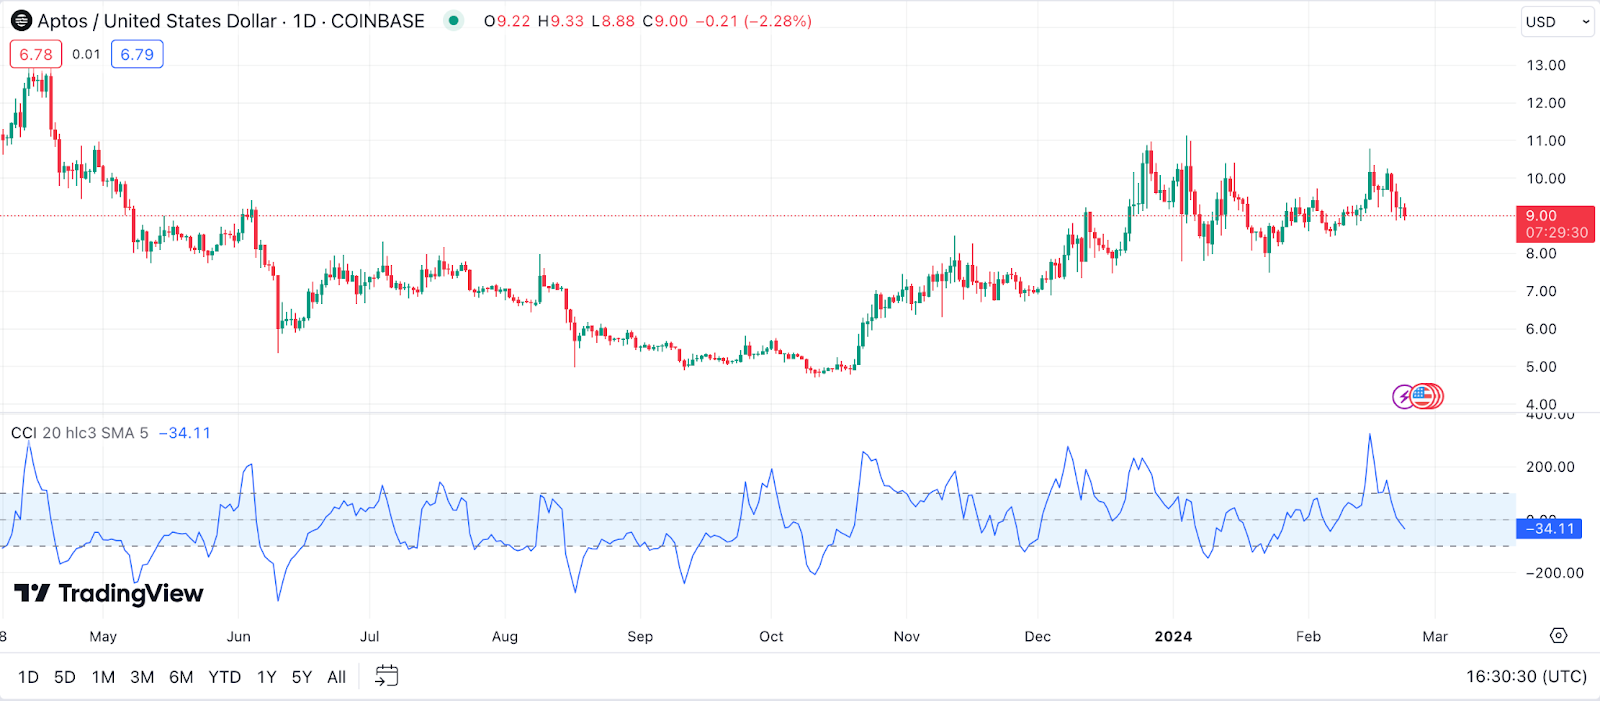
Example: If the CCI for APT spikes above +100, it might suggest that Aptos is entering overbought territory, potentially signaling a pullback or correction in the near future. Conversely, if the CCI dips below -100, it could indicate that APT is oversold, possibly presenting a good buying opportunity as a price rebound might be imminent.
Accumulation/Distribution Line (A/D Line) for Aptos Price Prediction
The Accumulation/Distribution Line (A/D Line) is a volume-based indicator designed to measure the cumulative flow of money into and out of an asset, like Aptos (APT). It does this by looking at the close price relative to the range for a given period and then factoring in the volume. The idea is to determine whether Aptos is being “accumulated” (bought up) or “distributed” (sold off). A rising A/D Line suggests accumulation, while a falling A/D Line indicates distribution.
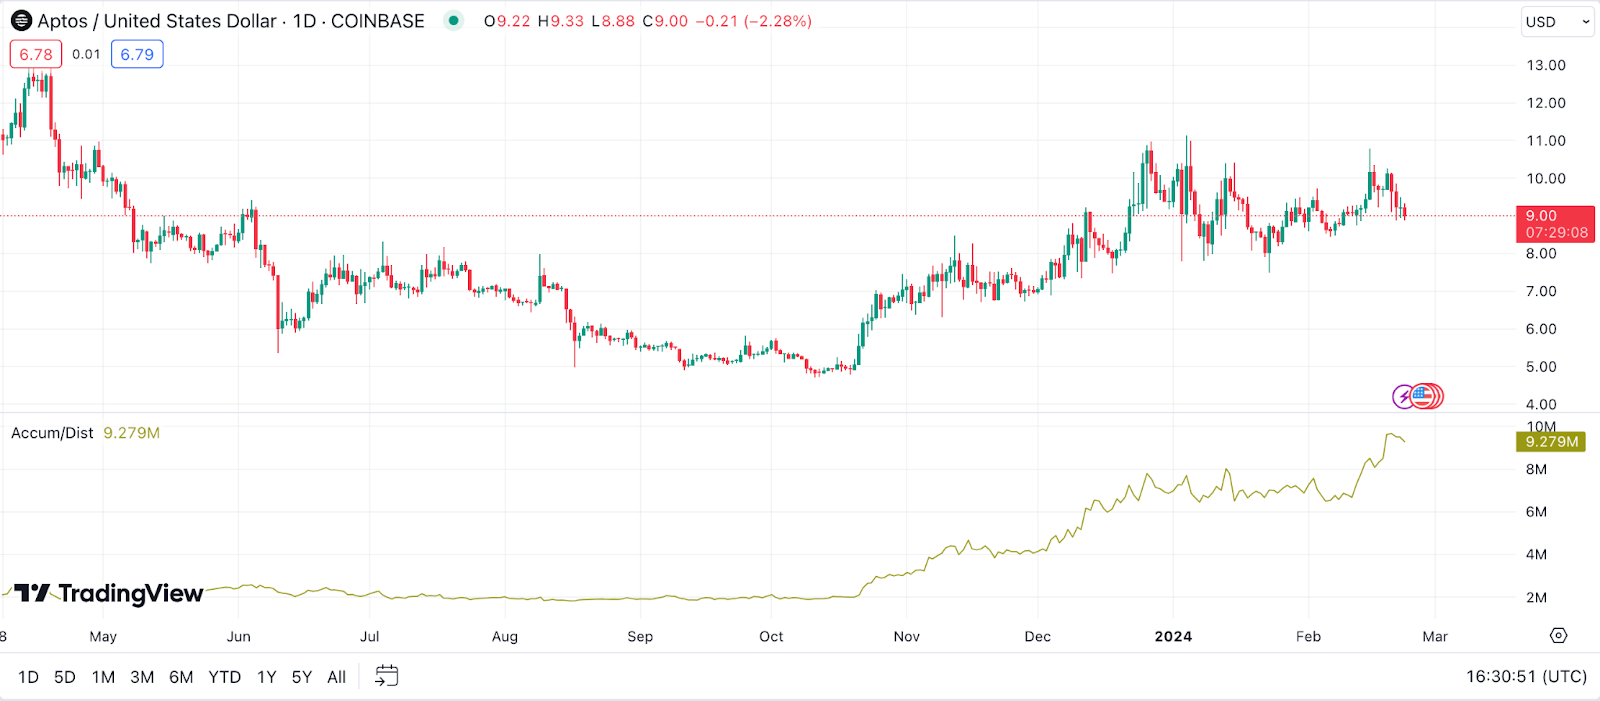
Example: If you notice the A/D Line for Aptos trending upwards while the price of APT is also increasing, it’s a strong sign that the uptrend is supported by significant buying pressure and might continue. Conversely, if the A/D Line is declining while the price is rising, it could indicate that the uptrend is not sustainable and a reversal might be imminent.
Pivot Points for Aptos Price Prediction
Pivot Points are a technical analysis tool used to determine potential support and resistance levels and the overall market trend. They are calculated based on the high, low, and close of the previous trading period. Traders use pivot points to identify potential turning points in Aptos price where it might reverse or extend the current trend. The main pivot point (P) is central, with levels of support (S1, S2, S3) below and resistance (R1, R2, R3) above.
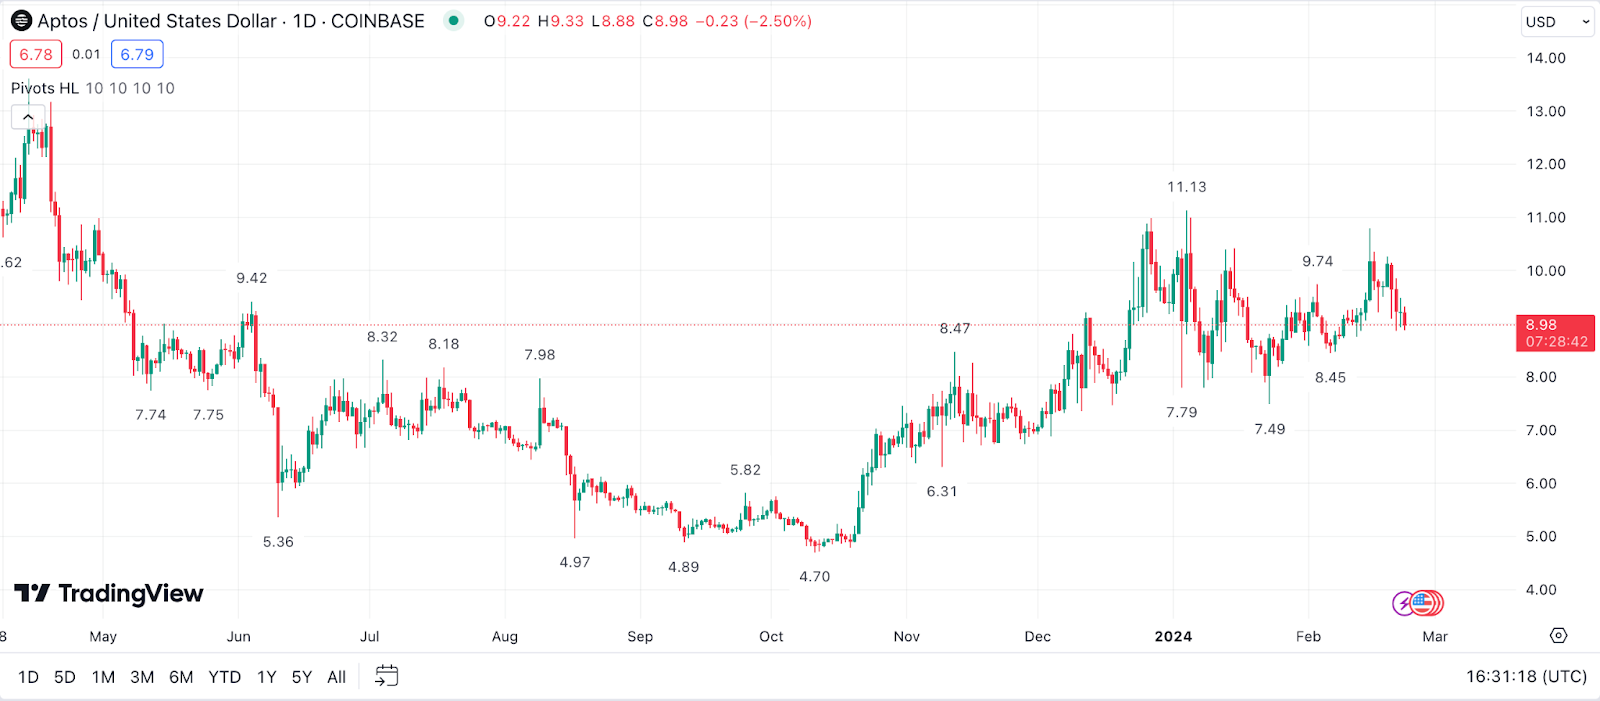
Example: If Aptos is trading above the main pivot point for the day, it’s generally seen as a bullish signal, suggesting that APT might continue to climb towards the first resistance level (R1). If APT drops below the pivot point, it could be a bearish sign, indicating a potential move down to the first support level (S1).
Chaikin Money Flow (CMF) for Aptos Price Prediction
Chaikin Money Flow (CMF) combines price and volume to measure the buying and selling pressure for a given period. The CMF value fluctuates between 1 and -1, with positive values indicating buying pressure (accumulation) and negative values signaling selling pressure (distribution). The indicator is especially useful for confirming the strength of price trends and spotting reversals by analyzing divergences between price and money flow.
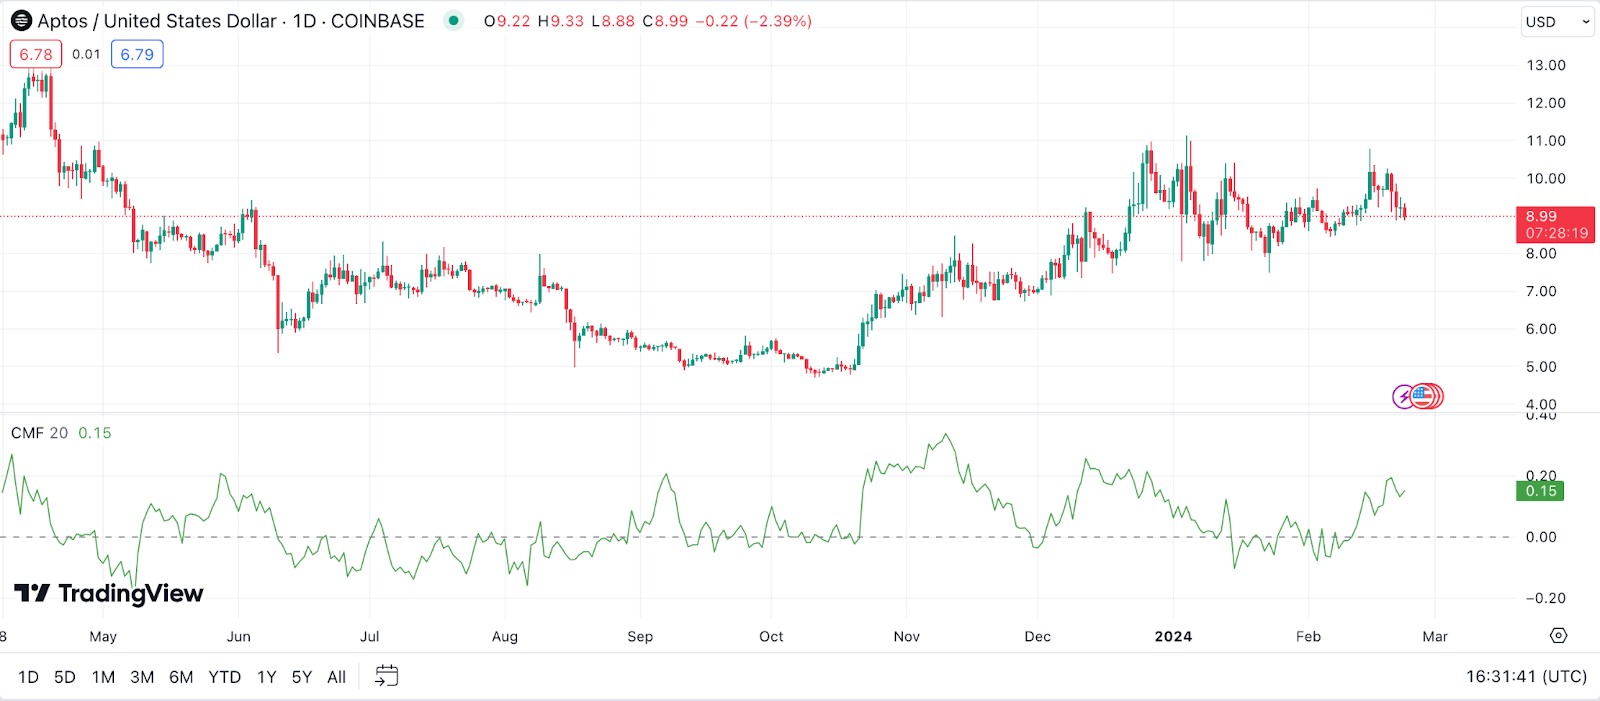
Example: A positive CMF for Aptos could indicate that buying pressure is dominating, especially if the CMF remains positive during a price uptrend, suggesting the uptrend could continue. On the other hand, if Aptos is experiencing a price increase but the CMF is negative or declining, it could signal that the uptrend is weakening, and a price correction or reversal might be on the horizon.
Aroon Indicator for Aptos Price Prediction
The Aroon Indicator is a technical tool used to identify trend changes in the price of an asset, such as Aptos (APT), and the strength of that trend. It consists of two lines: Aroon Up, which measures the time since the last high, and Aroon Down, which measures the time since the last low. Both are expressed as a percentage of the time period. A high Aroon Up value indicates a strong uptrend, while a high Aroon Down value suggests a strong downtrend.
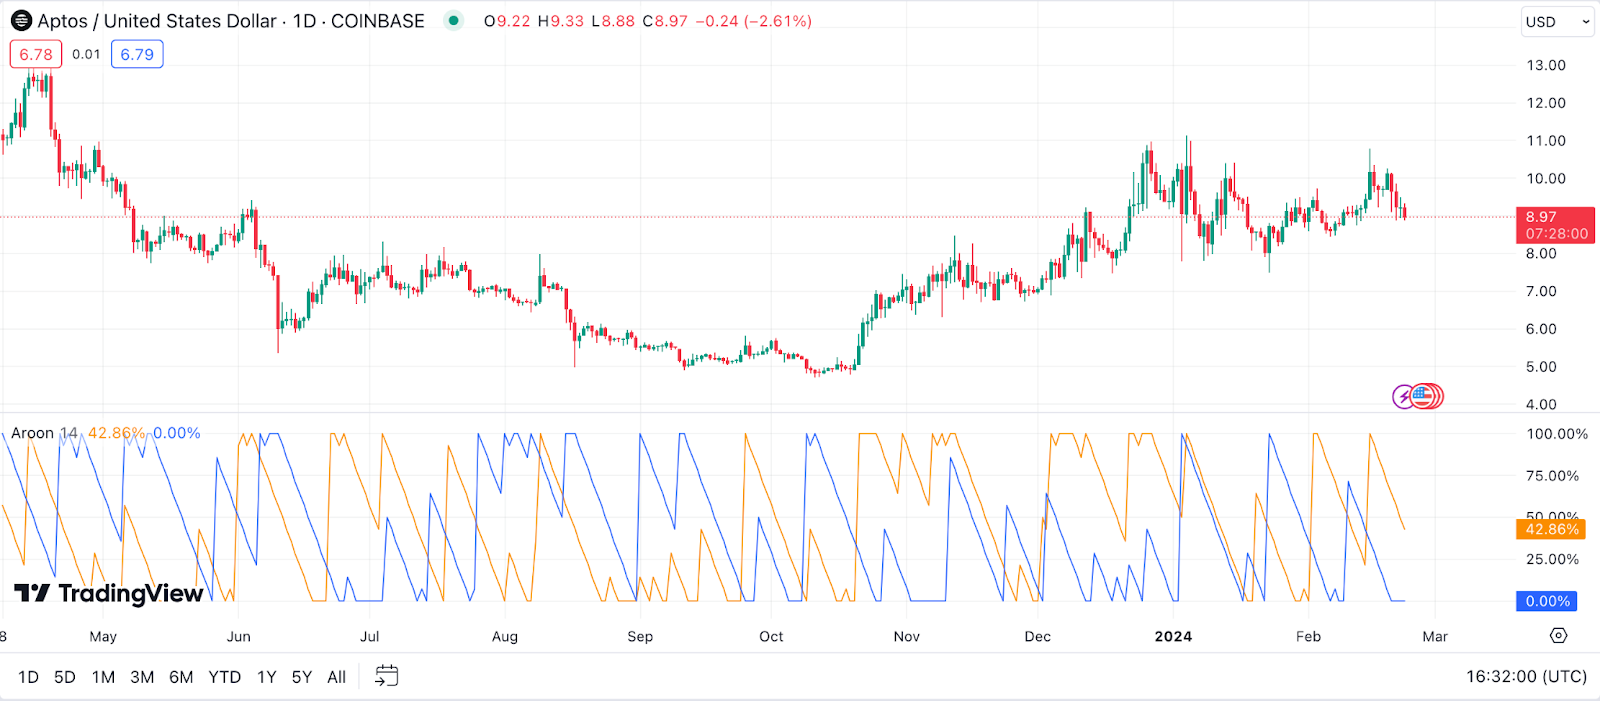
Example: If the Aroon Up line for Aptos crosses above the Aroon Down line, it might signal that APT is entering an uptrend, making it a potential buying opportunity. Conversely, if the Aroon Down line crosses above the Aroon Up line, it could indicate a downtrend, suggesting a possible selling point or a time to hold off on purchasing more APT.
Gann Fan for Aptos Price Prediction
The Gann Fan is a technical analysis tool based on the ideas of W.D. Gann. It involves drawing lines at different angles from a significant high or low point to represent potential support and resistance levels based on time and price movements. These lines help traders determine the direction of the trend and potential reversal points for assets like Aptos.
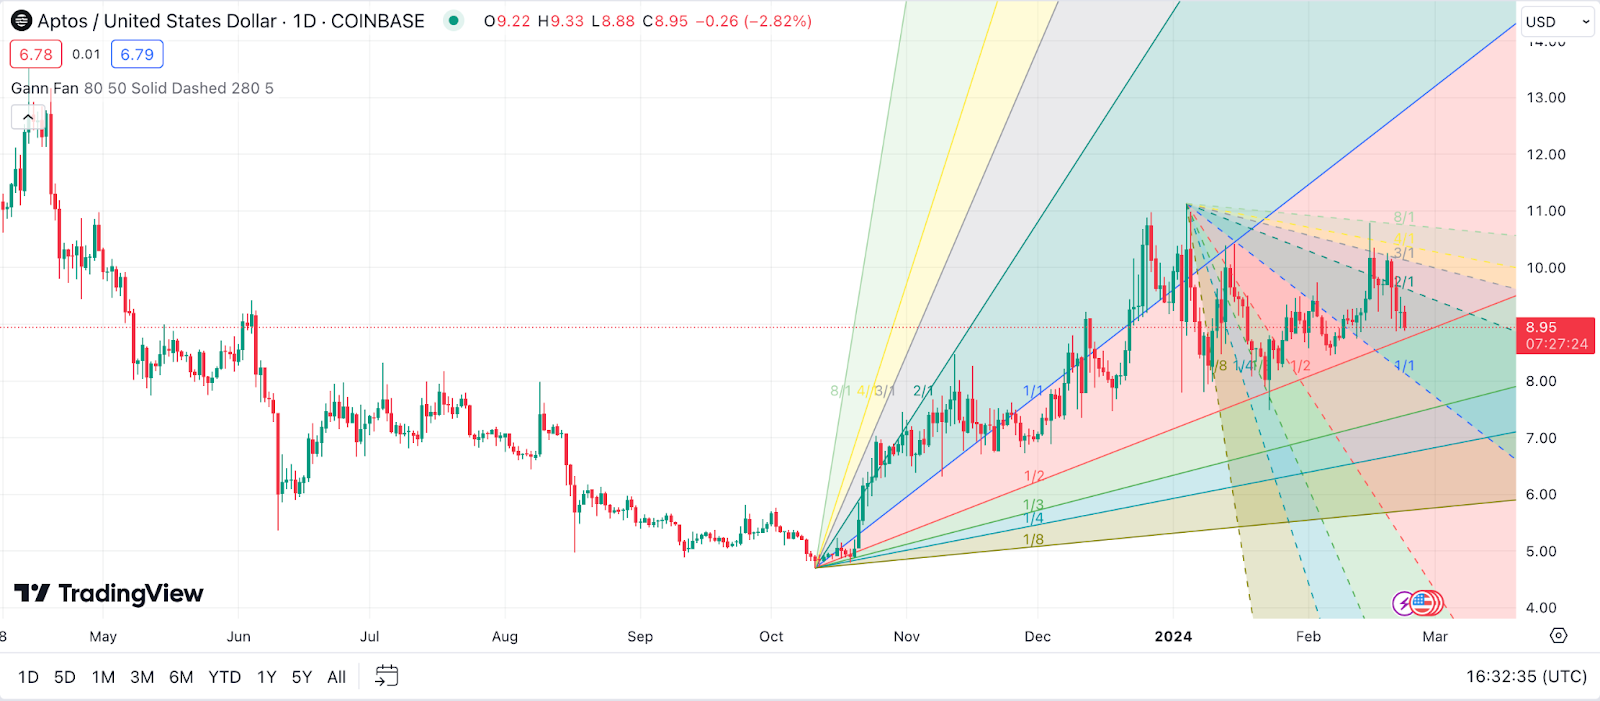
Example: When applying a Gann Fan to the APT chart from a significant low, if the price stays above one of the upward-sloping lines, it could indicate that Aptos is in an uptrend and may continue to rise. If the price breaks below one of these lines, it might signal a potential trend reversal or slowdown, suggesting caution for APT investors.
Keltner Channel for Aptos Price Prediction
The Keltner Channel is a volatility-based technical indicator that consists of three lines: an exponential moving average (EMA) of the closing price (usually a 20-period EMA) and two outer bands plotted above and below the EMA. These bands are typically set two times the Average True Range (ATR) away from the EMA. The Keltner Channel can help identify trend direction and volatility in the price of Aptos.
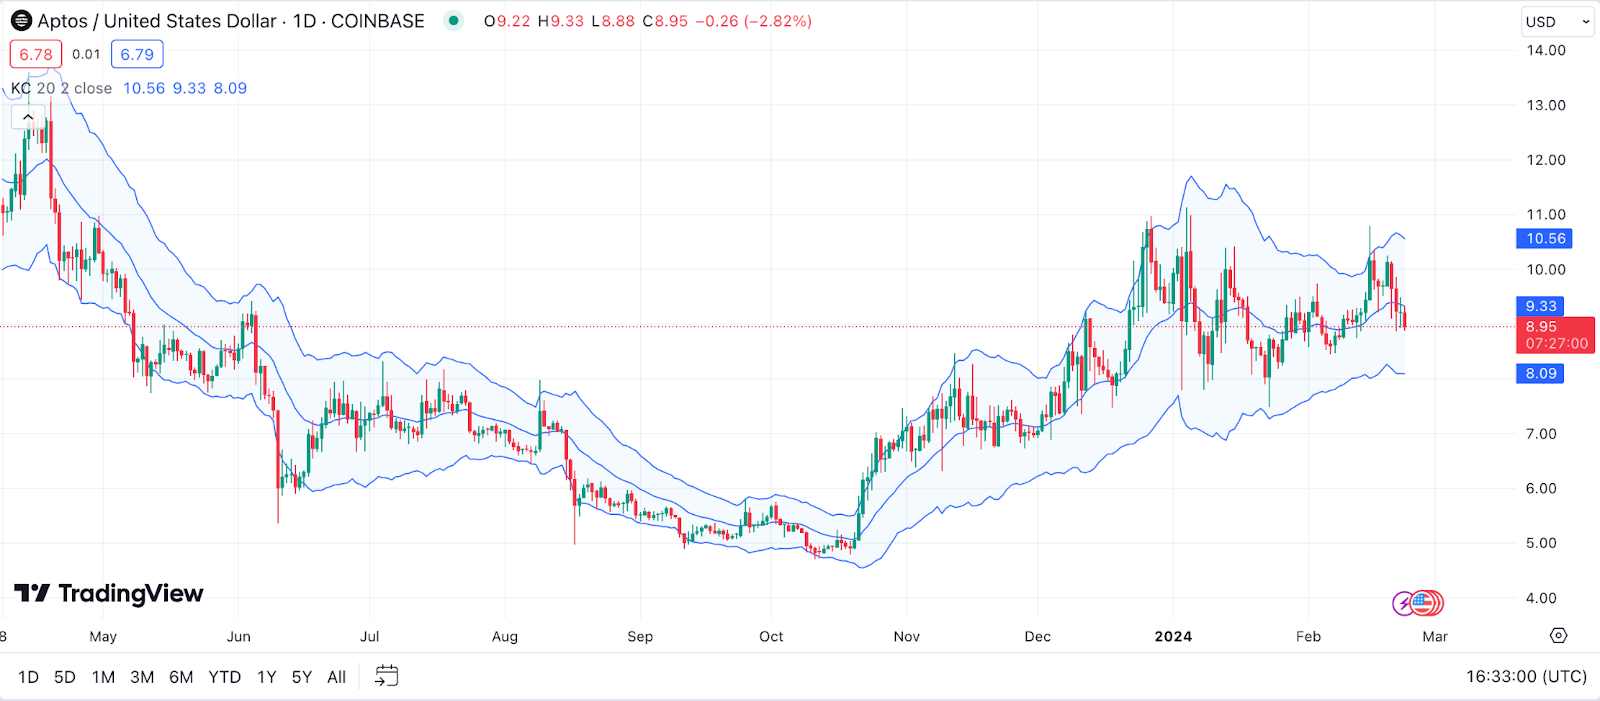
Example: If Aptos’s price consistently touches or breaks through the upper band of the Keltner Channel, it may indicate a strong uptrend and potentially bullish behavior, suggesting a buying opportunity. Conversely, if APT’s price frequently touches or dips below the lower band, it could signify a downtrend, potentially indicating a selling point or a time to reassess holding APT.
Money Flow Index (MFI) for Aptos Price Prediction
The Money Flow Index (MFI) is a momentum indicator that incorporates both price and volume data to identify potential reversals in the market by measuring buying and selling pressure. Think of it as a volume-weighted RSI. The MFI ranges from 0 to 100, with readings over 80 indicating overbought conditions and under 20 signaling oversold conditions.
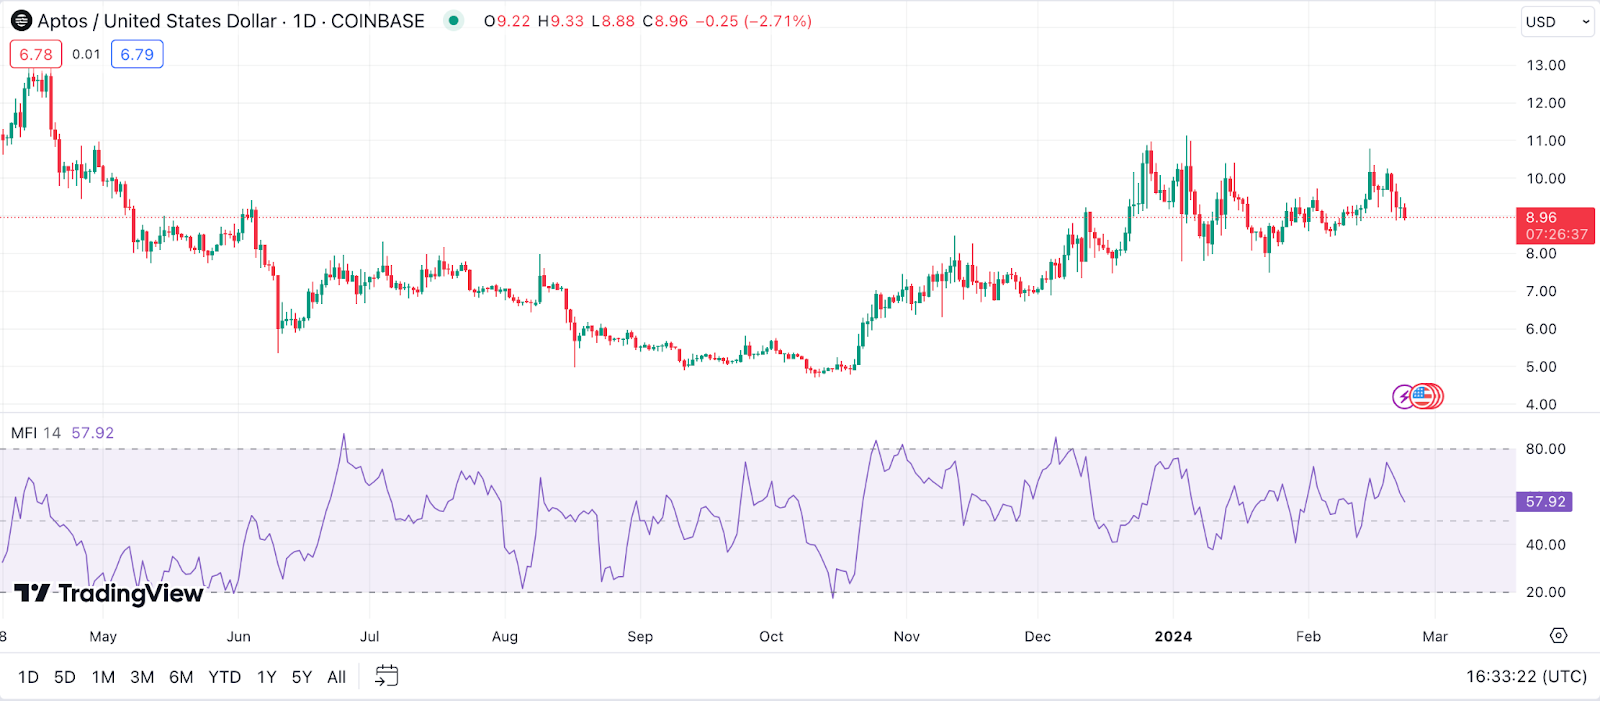
Example: If the MFI for Aptos (APT) climbs above 80, it might suggest that APT is overbought, indicating a potential pullback or reversal could be on the horizon. Conversely, an MFI reading below 20 could imply that APT is oversold, potentially setting the stage for a bullish reversal as buyers may start stepping in.
TRIX for Aptos Price Prediction
TRIX is a momentum oscillator that smooths price data and filters out market noise to highlight the underlying trend of an asset, such as Aptos. It’s calculated as the rate of change of a triple exponentially smoothed moving average of the closing price. TRIX oscillates around a zero line, with positive values indicating bullish momentum and negative values signaling bearish momentum.
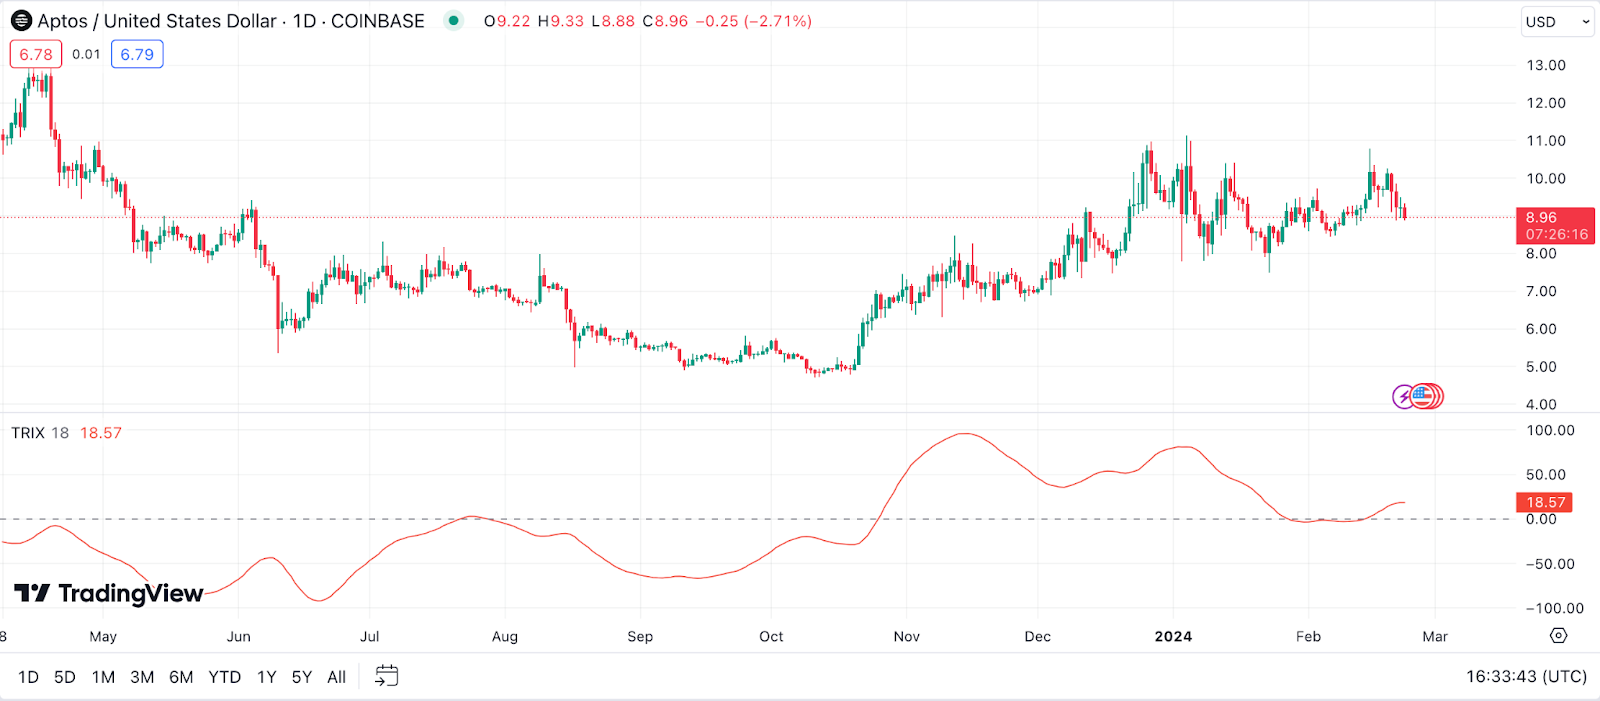
Example: A rising TRIX line for APT, particularly when it crosses above the zero line, could signal increasing bullish momentum, suggesting a potential entry point for investors. On the other hand, a declining TRIX line, especially when it crosses below the zero line, might indicate growing bearish momentum, warning of a possible downtrend.
The Zig Zag Indicator for Aptos Price Prediction
The Zig Zag indicator is used to identify price trends by filtering out minor price changes and highlighting significant movements. It’s particularly useful for analyzing the overarching direction of an asset’s price and identifying support and resistance levels. The Zig Zag lines are drawn by connecting significant lows (support levels) to significant highs (resistance levels) and vice versa.

Example: In the context of Aptos, if the Zig Zag lines show a pattern of higher highs and higher lows, it could indicate an uptrend, suggesting a favorable buying condition. Conversely, a pattern of lower highs and lower lows could signify a downtrend, potentially advising caution or a sell strategy for APT holders.
Detrended Price Oscillator (DPO) for Aptos Price Prediction
The Detrended Price Oscillator (DPO) is a tool designed to remove the influence of long-term trends from the price action to more easily identify cycles and overbought or oversold conditions in the short term. It does this by comparing past prices to a shifted moving average, essentially looking to isolate the price cycles.

Example: For Aptos (APT), a DPO that moves above the zero line might indicate that APT is in a short-term bullish cycle relative to the longer-term trend, possibly suggesting a good time to buy. Conversely, a DPO moving below the zero line could suggest that APT is in a bearish cycle, potentially signaling a time to sell or wait before making further investments.
Vortex Indicator (VI) for Aptos Price Prediction
The Vortex Indicator (VI) is a technical indicator used to identify the start of a new trend or the continuation of an existing trend within asset price data. It consists of two lines: VI+ (positive trend indicator) and VI- (negative trend indicator). A crossover of these lines can signal trend changes.
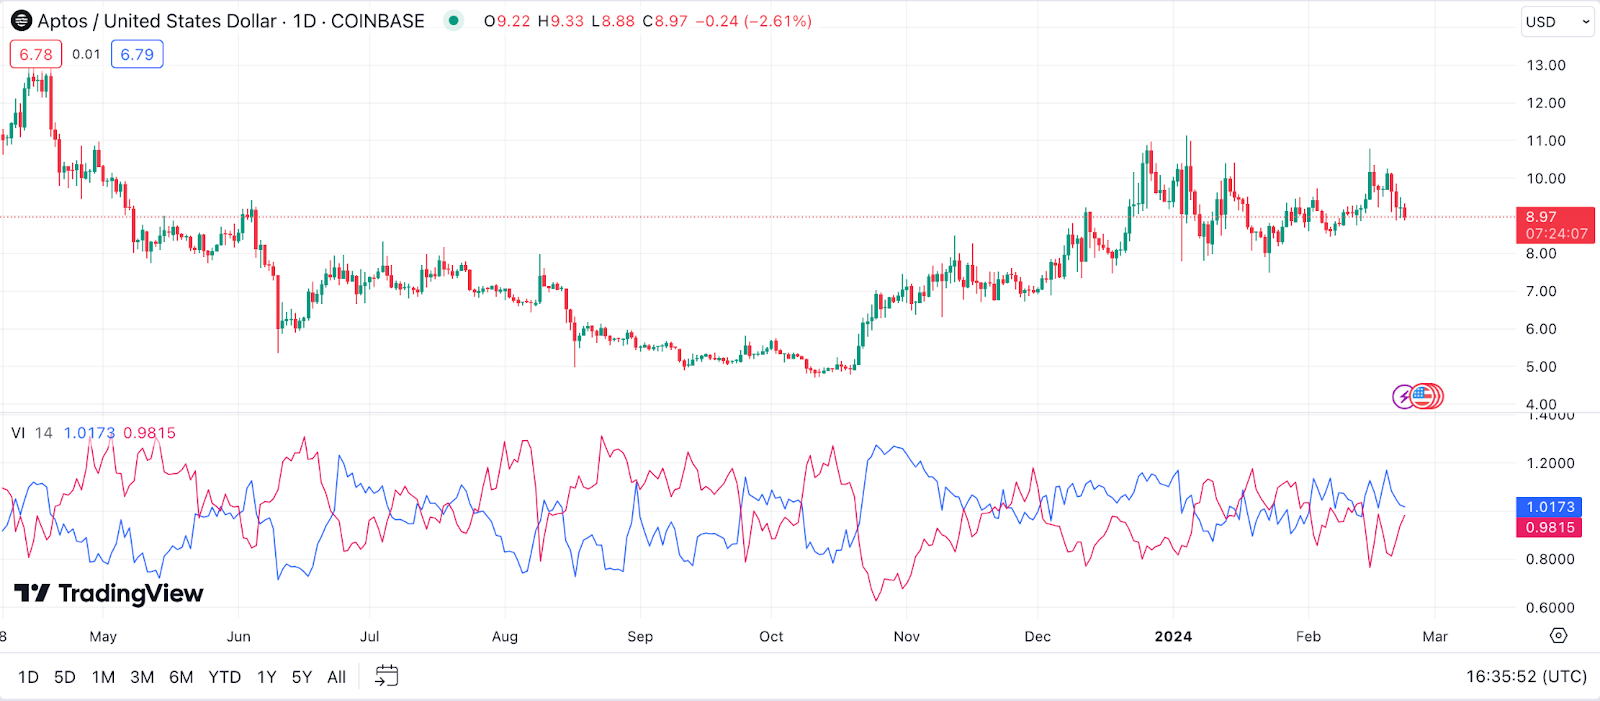
Example: If the VI+ line for Aptos crosses above the VI- line, it may indicate the start of a new uptrend, making it a potentially opportune time for investors to consider buying APT. On the flip side, if the VI- line crosses above the VI+ line, it could signal the beginning of a downtrend, suggesting that investors might want to sell or hold off on purchasing more APT.
Elder’s Force Index (EFI) for Aptos Price Prediction
Elder’s Force Index (EFI) combines price movements and volume to measure the buying or selling pressure behind market moves. It’s a valuable tool for identifying potential reversals and price corrections by analyzing the force with which the market moves in a particular direction.
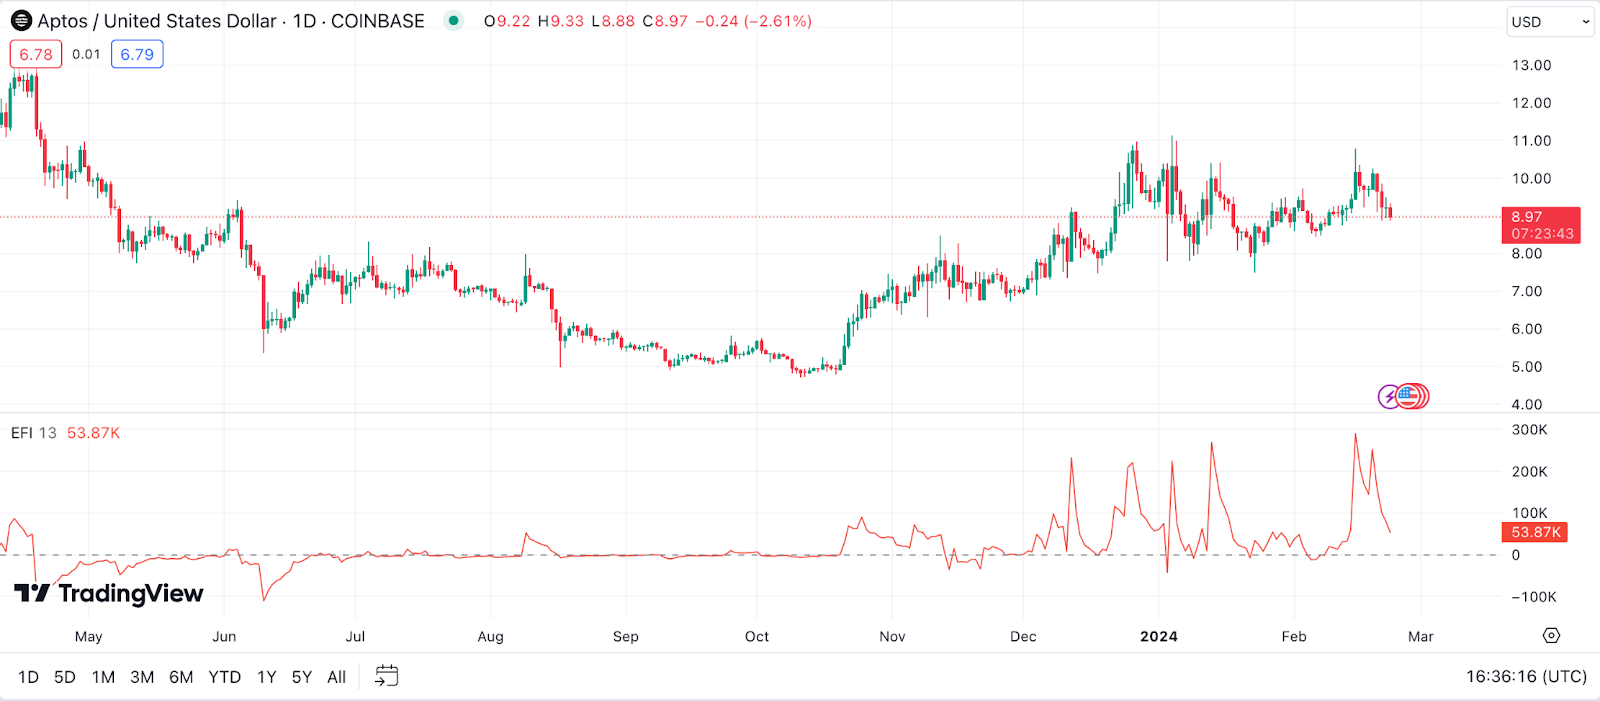
Example: A rising EFI for Aptos, especially when it crosses above the zero line, could indicate increasing buying pressure, suggesting a bullish trend and potentially a good buying opportunity. Conversely, a falling EFI that crosses below the zero line might indicate growing selling pressure, suggesting a bearish trend and possibly a signal to sell or be cautious with APT investments.
Williams %R for Aptos Price Prediction
Williams %R, also known as the Williams Percent Range, is a momentum indicator that measures overbought and oversold levels, similar to the Stochastic Oscillator. It oscillates between 0 and -100, with levels above -20 indicating overbought conditions and levels below -80 suggesting oversold conditions. This indicator helps in identifying potential reversal points in the market by comparing the closing price to the high-low range over a specific period.
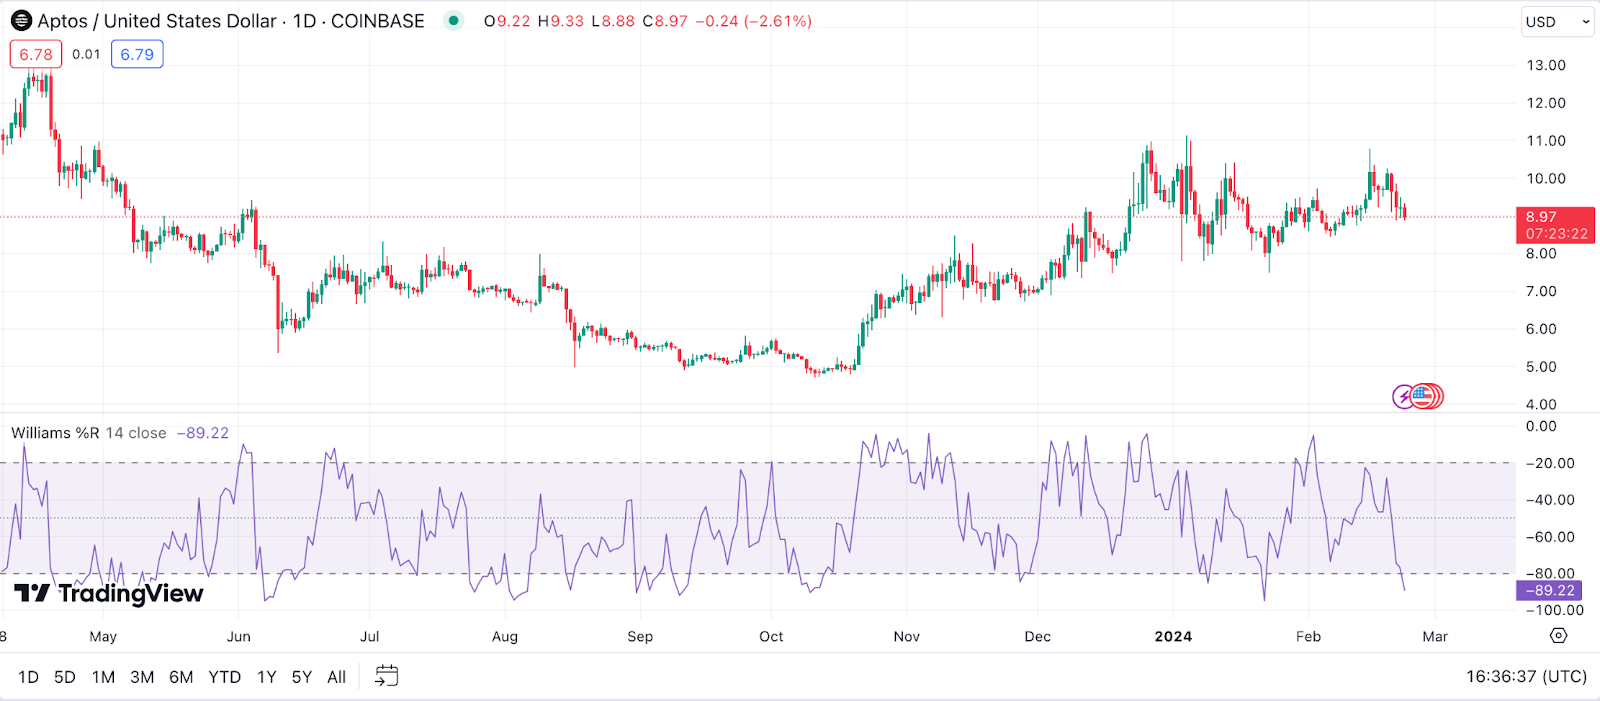
Example: If the Williams %R for Aptos (APT) dips below -80, it might suggest that APT is oversold, potentially signaling a buying opportunity as the market could be due for a reversal to the upside. Conversely, if the Williams %R rises above -20, it could indicate that APT is overbought, suggesting a possible pullback or correction might be on the horizon, and it might be wise to consider selling or holding off on new investments.
Combining Technical Indicators for Accurate Aptos Price Prediction
Navigating the world of cryptocurrency investments, particularly with coins like Aptos (APT), can feel akin to steering a ship through foggy waters. One beacon alone might not offer the clarity needed, but a constellation of them can guide you safely. This is where the art of combining technical indicators comes into play, transforming solitary signals into a symphony of insights.
The Importance of Using Multiple Technical Indicators
Relying on a single technical indicator is like trying to understand a story by reading only one page. Each indicator tells a part of the market’s tale, but it’s by listening to the chorus of signals that we can grasp the full narrative. By weaving together various indicators, we’re not just looking for confirmation; we’re building a 3D view of the market, capturing nuances that might otherwise slip through the cracks.
How to Combine Various Indicators for a Comprehensive Analysis
When it comes to assembling a toolkit for analyzing APT’s price movements, diversity and balance are key. Here are some tips on blending different technical tools to achieve a rounded perspective:
- Start with Trend Indicators: Begin by establishing the general direction of the market with trend indicators like Moving Averages or the MACD. These will set the stage for your analysis, helping you to understand the broader narrative.
- Incorporate Momentum Indicators: Once the trend is clear, layer in momentum indicators such as the RSI or Stochastic Oscillator. These will show you the strength behind the price movements, highlighting potential entry or exit points.
- Add Volume Indicators: Volume is the fuel that drives the market. Tools like the On Balance Volume (OBV) or the Chaikin Money Flow (CMF) can offer insights into the buying or selling pressure behind price changes, adding depth to your analysis.
- Consider Volatility: With cryptocurrencies being notoriously volatile, gauging the market’s mood swings is crucial. Bollinger Bands or the Average True Range (ATR) can help you understand the potential range of price movements.
- Look for Confluence: Seek areas where different indicators converge, suggesting a stronger signal. For instance, if a Fibonacci retracement level aligns with a key moving average and is also at a point where the RSI shows oversold conditions, you might have found a robust support level.
- Balance Is Key: While it’s tempting to pile on indicators, clarity often lies in simplicity. Choose a set of indicators that complement each other without overcrowding your chart. Too much information can be just as confusing as too little.
By harmonizing these various signals, you’re not just guessing; you’re making educated predictions backed by a chorus of market voices. Remember, the goal isn’t to predict the future with certainty but to tilt the odds in your favor, making each investment decision a little less like a gamble and more like a strategic move on the chessboard of the crypto market.
The Pillars of Aptos Prediction: Fundamental Factors
Diving into the Aptos (APT) forecast, it’s not just the charts that whisper secrets about its future. The story of APT unfolds through a tapestry of fundamental factors, each thread revealing a different facet of its potential. Let’s unravel these threads to better understand where APT might be headed.
Adoption Rate
The adoption rate of Aptos (APT) is akin to watching a seed grow; it’s about nurturing and monitoring its journey from a sapling to a towering tree. This growth is not just a number but a story of expanding influence and acceptance in the crypto ecosystem. When we talk about adoption, we’re peeling back layers to understand how and why APT is becoming a staple in the portfolios and projects of users and developers alike.
- Node Expansion: The spread and increase in the number of nodes on the Aptos network can signal a robust and healthy network, indicative of wider adoption.
- Retail Integration: APT’s acceptance by online and brick-and-mortar retailers as a payment method can significantly boost its visibility and usability.
- Institutional Investment: When big players start holding or investing in APT, it’s a strong signal of its market potential and adoption.
- Educational Initiatives: Efforts to educate the public about Aptos and its benefits can lead to increased interest and adoption.
- Tech Upgrades: Continuous improvements and updates to the Aptos blockchain can attract more developers and users, enhancing its adoption rate.
Each of these metrics and developments paints a picture of Aptos’s journey through the crypto landscape. They tell us not just about the current state of APT but also hint at its future trajectory. As these factors evolve, they provide key insights into the broader narrative of adoption, helping us understand where Aptos stands and where it might be heading.
Regulatory Developments
The regulatory landscape for cryptocurrencies like Aptos (APT) is ever-evolving, acting as both a catalyst and a checkpoint for its growth and adoption. Regulatory shifts can send ripples across the crypto pond, influencing investor sentiment, market stability, and the broader acceptance of APT. Understanding these regulatory nuances is crucial for anyone looking to navigate the Aptos ecosystem with finesse.
- International Collaboration on Crypto Regulation: Joint efforts by global regulators could introduce standardized crypto regulations, potentially affecting APT’s accessibility and utility across borders.
- Anti-Money Laundering (AML) and Know Your Customer (KYC) Compliance: Stricter AML and KYC regulations could impact the ease of use and anonymity of APT transactions, influencing its adoption rate.
- Securities Law Application: How regulatory bodies classify APT, whether as a security or otherwise, could significantly impact its trading, investment, and development aspects.
- Environmental Regulations: Given the increasing focus on sustainability, regulations around the environmental impact of blockchain technology could affect the development and use of energy-efficient protocols within the Aptos network.
- Innovation-Friendly Regulations: On the flip side, regulations designed to foster innovation and protect investors could bolster confidence in Aptos, attracting more developers and investors to the ecosystem.
Navigating these regulatory waters requires a keen eye on both current policies and emerging trends. By staying informed about these regulatory developments, stakeholders in the Aptos ecosystem can better anticipate and adapt to changes that could impact APT’s market dynamics and long-term viability.
Utility
The true essence of Aptos (APT) lies in its utility – the myriad ways it can be woven into the fabric of digital transactions, contracts, and applications. This utility is the lifeblood of APT’s value proposition, offering a glimpse into its potential to reshape and innovate within the blockchain space. Beyond its role as a digital asset, Aptos’s utility is a testament to its versatility and adaptability across various sectors and use cases.
- Digital Identity Verification: Aptos could play a crucial role in secure and decentralized identity verification processes, streamlining everything from online logins to governmental services.
- Decentralized Autonomous Organizations (DAOs): APT could be pivotal in the governance mechanisms of DAOs, offering a transparent and efficient way to manage collective decisions and resources.
- Gaming and Virtual Goods: With the rise of blockchain gaming, Aptos can facilitate the creation, ownership, and trade of in-game assets and virtual goods, opening up new revenue and engagement models.
- Interoperability Solutions: As the blockchain ecosystem grows more fragmented, Aptos’s potential in facilitating interoperability between different networks could enhance its utility manifold.
- Tokenization of Assets: Aptos can be used to tokenize real-world assets, from real estate to artwork, making them more accessible and divisible among a broader range of investors.
As Aptos continues to evolve, its utility may expand into new and unforeseen domains, further solidifying its position in the crypto market. Each new application not only broadens Aptos’s horizons but also cements its relevance in an increasingly digital world, offering a clearer picture of its long-term trajectory and potential impact on various industries.
Market Sentiment: How APT News Prediction Works
The narrative surrounding Aptos (APT) is constantly shaped by the collective mood and perceptions of the market participants. This sentiment is a powerful force, capable of driving trends and influencing the trajectory of APT’s price movements. Delving into market sentiment involves listening to the market’s heartbeat, understanding its ebbs and flows, and discerning how news, rumors, and developments could sway the crowd’s emotions and investment decisions.
- Algorithmic Sentiment Analysis: Advanced algorithms and AI tools parse through vast amounts of data from social media, news outlets, and forums to quantify the market’s mood towards APT, offering insights into potential market movements.
- Investor Surveys and Polls: Regularly conducted surveys and polls within the crypto community can provide a direct gauge of investor sentiment, revealing prevailing attitudes and expectations regarding Aptos.
- Market Analysis Webinars and Podcasts: Engaging with expert discussions and analyses through webinars and podcasts can shed light on underlying market sentiments and potential shifts in APT’s valuation.
- Behavioral Analytics: Platforms that track user behavior, such as wallet activity and transaction patterns, can offer clues about investor confidence and sentiment towards Aptos.
- Sentiment-Driven Trading Bots: The emergence of trading bots that make investing decisions based on sentiment analysis highlights the growing influence of market mood on trading strategies, potentially affecting APT’s price dynamics.
By keeping a finger on the pulse of market sentiment, investors and enthusiasts can navigate the Aptos landscape with greater awareness and strategic acumen. Understanding how news and developments translate into market sentiment allows for more informed predictions and decisions, making it an essential component of any comprehensive analysis of APT’s future prospects.
The Bottom Line: Making Your Own Aptos Price Predictions
As we wrap up our exploration into Aptos price prediction, we’ve traversed a landscape shaped by expert insights, technical intricacies, and the foundational pillars of fundamental analysis. This journey has been about piecing together a mosaic of perspectives, each offering a unique vantage point on Aptos’s potential path forward.
By intertwining the precision of technical indicators with the broader narratives of adoption, utility, and market sentiment, we’ve attempted to construct a well-rounded view that respects the complexity of the crypto market. Remember, the world of cryptocurrency is as dynamic as it is exciting, and while predictions offer a map, the terrain is always changing. Stay informed, stay curious, and let this be a guide, not gospel, as you navigate the ever-evolving saga of Aptos.
FAQ
When Will APT Go Up?
Ah, the million-dollar question! Timing the market is like trying to catch a wave with your bare hands – thrilling but super tricky. APT’s climb depends on a bunch of stuff like tech updates, how many folks are getting on board, and the overall mood of the crypto world. Keep an eye on the news and remember, the crypto sea is always changing.
Should I Buy APT?
Thinking about jumping into APT? It’s all about doing your homework and listening to your gut. Peek under APT’s hood, see what it’s all about, and think about how it fits with what you’re aiming for with your cash. Doing your own research and digging into the latest on APT can help you make a savvy move.
How High Can APT Go?
Everyone’s wondering, “What’s the top floor for APT?” Well, it’s a mix of crystal ball gazing and smart guessing. How many people are using it, the cool tech twists coming up, and the vibes in the crypto space can all push APT’s ceiling higher. But remember, the crypto skies are always shifting.
Will APT Crash Again in 2024?
Crypto’s known for its wild rides, and APT’s no stranger to the ups and downs. Pinpointing a crash is as tough as predicting a winning lottery ticket. But keeping your eyes peeled for market trends, big news, and the world’s economic heartbeat can give you some clues. Having a mix of investments and a cool head can help you ride out any wild waves.