Welcome to our latest deep dive, where today we’re unpacking the intriguing world of Algorand price predictions for 2024-2030. In the ever-evolving landscape of cryptocurrency, understanding the potential trajectory of ALGO’s value is no small feat. That’s precisely why we’re here – to sift through the complexities and provide you with a comprehensive look into the future of Algorand.
Predicting the price of ALGO is akin to navigating a labyrinth, fraught with twists and turns at every corner. This journey requires more than just a cursory glance at past performance charts; it demands a thorough exploration of Algorand’s origins, its foundational purpose, and the myriad factors that influence its market standing. Our article today is dedicated to peeling back these layers, employing a blend of analytical tools, trading techniques, and expert insights to forecast the ALGO cryptocurrency rate with as much precision as possible.
Understanding the value predictions of ALGO is not just an academic exercise; it’s a crucial endeavor for investors, developers, and enthusiasts alike. The implications of these forecasts extend far beyond mere speculation, influencing investment strategies, technological adoption, and the broader ecosystem’s development. In essence, getting to grips with ALGO’s potential price movements is about staying informed and ahead in a rapidly changing digital economy.
So, whether you’re a seasoned trader, a curious observer, or somewhere in between, I invite you to join me on this fascinating journey. Let’s unravel the mysteries of Algorand together, armed with insights and an open mind. Continue reading, and let’s explore what the future holds for ALGO.
Algorand (ALGO) Overview
| ALGO Price | $0.2930 |
| ALGO Price Change 24h | -7.63% |
| ALGO Price Change 7d | 32.65% |
| ALGO Market Cap | $2,541,821,100.61 |
| ALGO Circulating Supply | 8,676,591,292.45 |
| ALGO Trading Volume | $435,951,143.62 |
| ALGO All-Time High (ATH) | $3.28 |
| ALGO All-Time Low (ATL) | $0.08761 |
A Brief History: Algorand and Its Purpose
Diving into the realm of cryptocurrency, Algorand stands out as a beacon of innovation and purposeful design. Born from the genius mind of Silvio Micali, a Turing Award-winning cryptographer, Algorand was unveiled to the world with a clear mission: to streamline and democratize the financial systems of tomorrow.
At its core, Algorand is a public blockchain platform that prides itself on speed, security, and decentralization, aiming to solve the notorious blockchain trilemma. It’s a platform where anyone, from anywhere, can participate without the fear of scalability issues or security compromises. The essence of Algorand’s purpose is to foster a boundaryless economy, where digital assets can move as fluidly as information does today.
Now, if we pivot to the financial side of things, particularly the Algorand price prediction, it’s like watching a high-stakes drama unfold. The ALGO token, the lifeblood of the Algorand ecosystem, has seen its fair share of rollercoaster rides in the market. It’s this volatility that captivates investors and traders, each keen to decipher the token’s future trajectory.
Notable Price Movements of ALGO
The journey of ALGO’s value has been marked by several significant fluctuations. Here’s a glance at some of the pivotal moments:
- The Launch High: Shortly after its entrance into the market, ALGO saw a sharp spike, drawing in early investors.
- The Stabilization Phase: Following the initial excitement, ALGO found a more stable footing, albeit with minor swings that kept traders on their toes.
- Bull Market Surges: During periods of general market optimism, ALGO has experienced substantial upswings, aligning with broader cryptocurrency trends.
- Correction Dips: Like all cryptocurrencies, ALGO has not been immune to market corrections, seeing notable declines after peak periods.
Algorand – ALGO Price Prediction For Today, Tomorrow, This Week, and Next 30 Days
| Date | Price | Change |
|---|---|---|
| July 19, 2025 | 0.2934 | 0.15% |
| July 20, 2025 | 0.2912 | -0.77% |
| July 21, 2025 | 0.2904 | -0.27% |
| July 22, 2025 | 0.2880 | -0.82% |
| July 23, 2025 | 0.2870 | -0.36% |
| July 24, 2025 | 0.2876 | 0.23% |
| July 25, 2025 | 0.2887 | 0.38% |
| July 26, 2025 | 0.2905 | 0.63% |
| July 27, 2025 | 0.2897 | -0.29% |
| July 28, 2025 | 0.2909 | 0.41% |
| July 29, 2025 | 0.2913 | 0.13% |
| July 30, 2025 | 0.2905 | -0.28% |
| July 31, 2025 | 0.2882 | -0.78% |
| August 01, 2025 | 0.2899 | 0.61% |
| August 02, 2025 | 0.2920 | 0.70% |
| August 03, 2025 | 0.2916 | -0.12% |
| August 04, 2025 | 0.2912 | -0.15% |
| August 05, 2025 | 0.2917 | 0.17% |
| August 06, 2025 | 0.2895 | -0.76% |
| August 07, 2025 | 0.2922 | 0.94% |
| August 08, 2025 | 0.2894 | -0.97% |
| August 09, 2025 | 0.2920 | 0.93% |
| August 10, 2025 | 0.2945 | 0.83% |
| August 11, 2025 | 0.2934 | -0.35% |
| August 12, 2025 | 0.2947 | 0.42% |
| August 13, 2025 | 0.2952 | 0.19% |
| August 14, 2025 | 0.2940 | -0.41% |
| August 15, 2025 | 0.2951 | 0.35% |
| August 16, 2025 | 0.2958 | 0.24% |
| August 17, 2025 | 0.2953 | -0.15% |
Algorand Price Prediction 2024
Jumping into predictions for Algorand in 2024 feels like starting an exciting journey, much like getting lost in a great book full of mysteries. I’m here to help you navigate through the ups and downs of cryptocurrency forecasts, shining a light on what the future might hold for Algorand. Believe me, this adventure is going to be packed with surprises.
Get ready for some twists and turns as Algorand might take a small dip to $0.2637 before it gets back on track and settles at an average of $0.3076. And for those who love a bit of excitement, there’s a chance that Algorand could reach new heights, going up to $0.3515.
Looking ahead to 2024, it seems Algorand has a promising road ahead. We’re not expecting the kind of wild fluctuations that make you hold your breath, but rather a more stable journey with enough highs and lows to keep things interesting. If you’re looking to add a little excitement to your crypto collection, Algorand could be a good pick.
For anyone drawn to Algorand, here’s a piece of advice: go slow and steady. The crypto world is always full of unexpected twists, and Algorand is no exception. The best way forward is to do your research and stay updated on the latest news.
| Month | Minimum Price | Average Price | Maximum Price |
|---|---|---|---|
| February 2024 | 0.1980 | 0.2056 | 0.2140 |
| March 2024 | 0.2033 | 0.2112 | 0.2198 |
| April 2024 | 0.2088 | 0.2169 | 0.2257 |
| May 2024 | 0.2145 | 0.2227 | 0.2318 |
| June 2024 | 0.2203 | 0.2287 | 0.2381 |
| July 2024 | 0.2262 | 0.2349 | 0.2445 |
| August 2024 | 0.2323 | 0.2412 | 0.2511 |
| September 2024 | 0.2386 | 0.2478 | 0.2579 |
| October 2024 | 0.2450 | 0.2544 | 0.2649 |
| November 2024 | 0.2516 | 0.2613 | 0.2720 |
| December 2024 | 0.2584 | 0.2684 | 0.2794 |
| January 2025 | 0.2654 | 0.2756 | 0.2869 |
January 2024: Algorand Price Forecast
With the New Year comes a new set of predictions for Algorand. January looks like it’s setting the stage with a minimum price hinting at $0.1802, an average that could likely hover around $0.1980, and a maximum price that may touch $0.2056. These numbers suggest a cautious optimism among traders, signaling a steady start to the year for Algorand enthusiasts.
ALGO Price Forecast for February 2024
As February rolls in, Algorand’s financial weather report shows a minimum price chill at $0.1980, but don’t let that cool your interest. The average price looks to warm up to $0.2056, with potential highs soaring to a more comfortable $0.2140. This could be a sweet spot for those looking to capitalize on Algorand’s ebb and flow.
March 2024: Algorand Price Forecast
March heralds a period of steady growth for Algorand, with experts highlighting a climb to a minimum price of $0.2033. The average price is expected to blossom to $0.2112, and there’s even talk of a maximum price reaching $0.2198. This uptick is a clear signal to keep a keen eye on Algorand’s market movements.
ALGO Price Forecast for April 2024
Come April, and the spring of Algorand’s market seems to be in full swing. A modest increase sets the minimum price at $0.2088, and the average price could see a pleasant rise to $0.2169. Those peak price predictions of $0.2257 could mean April showers bring Algorand flowers for savvy investors.
May 2024: Algorand Price Forecast
The merry month of May could be a harbinger of good fortune for Algorand, with a minimum price predicted at $0.2145. A steady average price of $0.2227 and a maximum price possibly blooming to $0.2318 suggests a continued upward trend. This gentle ascent might just be the rhythm traders are looking to groove to.
ALGO Price Forecast for June 2024
As summer heats up, so does Algorand’s forecast. June’s minimum price might see a sunny $0.2203, with an average price of $0.2287. And for those long summer days, a maximum price of $0.2381 could mean bright skies ahead for ALGO enthusiasts.
July 2024: Algorand Price Forecast
July’s forecast for Algorand shows no sign of a summer slump. The minimum price is expected to hover around $0.2262, while the average price could climb to $0.2349. And if the maximum price hits $0.2445, it might just be time for fireworks in the Algorand community.
ALGO Price Forecast for August 2024
Algorand’s price in August could be as hot as the summer sun, with a minimum price reaching $0.2323. An average of $0.2412 suggests stability in the heat, and a maximum price of $0.2511 indicates that the upward trend is likely to continue. This month might offer the perfect climate for growth-oriented strategies.
September 2024: Algorand Price Forecast
As the leaves begin to turn, September could see Algorand’s minimum price changing to $0.2386. The average price is predicted to settle at a comfortable $0.2478, with the maximum price potentially reaching a robust $0.2579. This growth could signify a season of positive change for ALGO holders.
ALGO Price Forecast for October 2024
October’s prediction for Algorand is looking vibrant with a minimum price of $0.2450. The average price, sitting at $0.2544, indicates a stable climb, while a maximum price of $0.2649 could signal a strong autumn rally. This could be a signal to prepare for potentially brisk market activity.
November 2024: Algorand Price Forecast
November’s Algorand forecast suggests a cozy minimum price of $0.2516, with an average that could warm up to $0.2613. If the maximum price wraps up at $0.2720, this could be an early holiday gift for investors tracking ALGO’s progress.
ALGO Price Forecast for December 2024
Closing the year, December’s forecast for Algorand brings a festive minimum price of $0.2584. An average price of $0.2684 offers a stable end-of-year outlook, and a maximum price of $0.2794 could mean a merry season for ALGO traders, wrapping up the year with potential gains to celebrate.
Algorand Price Prediction 2025
The horizon of 2025 shows Algorand standing firm with an anticipated minimum price of $0.2625. It’s a figure that whispers stability in the dynamic crypto market. Crypto enthusiasts can expect an average price hovering around $0.3114, suggesting a year that could be marked by steady growth and gaining investor confidence. Those looking for a ceiling can set their sights on a maximum price of $0.3704, indicating that Algorand might just outdo the conservative estimates.
| Month | Minimum Price | Average Price | Maximum Price |
|---|---|---|---|
| February 2025 | 0.2625 | 0.2726 | 0.2837 |
| March 2025 | 0.2696 | 0.2799 | 0.2914 |
| April 2025 | 0.2768 | 0.2875 | 0.2993 |
| May 2025 | 0.2843 | 0.2952 | 0.3074 |
| June 2025 | 0.2920 | 0.3032 | 0.3156 |
| July 2025 | 0.2999 | 0.3114 | 0.3242 |
| August 2025 | 0.3080 | 0.3198 | 0.3329 |
| September 2025 | 0.3163 | 0.3284 | 0.3419 |
| October 2025 | 0.3248 | 0.3373 | 0.3511 |
| November 2025 | 0.3336 | 0.3464 | 0.3606 |
| December 2025 | 0.3426 | 0.3558 | 0.3704 |
| January 2026 | 0.3519 | 0.3654 | 0.3804 |
Algorand Price Prediction 2026
As we chart the course for 2026, the Algorand landscape appears to be cultivating fertile ground for growth, with the minimum price expected to plant itself at $0.3480. With an average price forecasted at $0.4129, investors might find 2026 to be a year of progressive climbs. Meanwhile, the maximum price could reach a robust $0.4911, offering a potential harvest for those playing the long game.
| Month | Minimum Price | Average Price | Maximum Price |
|---|---|---|---|
| February 2026 | 0.3480 | 0.3614 | 0.3762 |
| March 2026 | 0.3574 | 0.3712 | 0.3864 |
| April 2026 | 0.3671 | 0.3812 | 0.3968 |
| May 2026 | 0.3770 | 0.3915 | 0.4075 |
| June 2026 | 0.3872 | 0.4020 | 0.4185 |
| July 2026 | 0.3976 | 0.4129 | 0.4298 |
| August 2026 | 0.4084 | 0.4240 | 0.4414 |
| September 2026 | 0.4194 | 0.4355 | 0.4533 |
| October 2026 | 0.4307 | 0.4473 | 0.4656 |
| November 2026 | 0.4423 | 0.4593 | 0.4782 |
| December 2026 | 0.4543 | 0.4717 | 0.4911 |
| January 2027 | 0.4665 | 0.4845 | 0.5043 |
Algorand Price Prediction 2027
Looking towards 2027, Algorand’s growth trajectory seems to be on an upward trend, with the minimum price predicted to rise to $0.4614. The average price is slated to ascend to $0.5474, hinting at a consistent upward momentum in market sentiment. For the optimists, a maximum price of $0.6510 could be on the horizon, showcasing the potential for impressive peaks.
| Month | Minimum Price | Average Price | Maximum Price |
|---|---|---|---|
| February 2027 | 0.4614 | 0.4791 | 0.4987 |
| March 2027 | 0.4738 | 0.4920 | 0.5122 |
| April 2027 | 0.4866 | 0.5053 | 0.5260 |
| May 2027 | 0.4998 | 0.5190 | 0.5402 |
| June 2027 | 0.5133 | 0.5330 | 0.5548 |
| July 2027 | 0.5271 | 0.5474 | 0.5698 |
| August 2027 | 0.5413 | 0.5621 | 0.5852 |
| September 2027 | 0.5560 | 0.5773 | 0.6010 |
| October 2027 | 0.5710 | 0.5929 | 0.6172 |
| November 2027 | 0.5864 | 0.6089 | 0.6339 |
| December 2027 | 0.6022 | 0.6254 | 0.6510 |
| January 2028 | 0.6185 | 0.6422 | 0.6686 |
Algorand Price Prediction 2028
The year 2028 looms with promises of prosperity for Algorand, as the minimum price is forecasted to notch up to $0.6117. An average price of $0.7257 could mean another year of fruitful development for the cryptocurrency. The ambitious might look towards a maximum price of $0.8631, a number that suggests significant strides forward in market valuation.
| Month | Minimum Price | Average Price | Maximum Price |
|---|---|---|---|
| February 2028 | 0.6117 | 0.6352 | 0.6612 |
| March 2028 | 0.6282 | 0.6523 | 0.6791 |
| April 2028 | 0.6452 | 0.6700 | 0.6974 |
| May 2028 | 0.6626 | 0.6881 | 0.7163 |
| June 2028 | 0.6805 | 0.7066 | 0.7356 |
| July 2028 | 0.6989 | 0.7257 | 0.7555 |
| August 2028 | 0.7177 | 0.7453 | 0.7759 |
| September 2028 | 0.7371 | 0.7654 | 0.7968 |
| October 2028 | 0.7570 | 0.7861 | 0.8183 |
| November 2028 | 0.7774 | 0.8073 | 0.8404 |
| December 2028 | 0.7984 | 0.8291 | 0.8631 |
| January 2029 | 0.8200 | 0.8515 | 0.8864 |
Algorand Price Prediction 2029
Moving into the tail end of the decade, 2029 holds potential for continued expansion in Algorand’s valuation, with a minimum price of $0.8110. An average price of $0.9621 might become the new normal, as the crypto matures further. The high mark for the year could see a maximum price of $1.1443, a figure that might reflect a culmination of sustained growth efforts and market adoption.
| Month | Minimum Price | Average Price | Maximum Price |
|---|---|---|---|
| February 2029 | 0.8110 | 0.8421 | 0.8767 |
| March 2029 | 0.8329 | 0.8649 | 0.9003 |
| April 2029 | 0.8554 | 0.8882 | 0.9246 |
| May 2029 | 0.8785 | 0.9122 | 0.9496 |
| June 2029 | 0.9022 | 0.9368 | 0.9753 |
| July 2029 | 0.9265 | 0.9621 | 1.0016 |
| August 2029 | 0.9516 | 0.9881 | 1.0286 |
| September 2029 | 0.9772 | 1.0148 | 1.0564 |
| October 2029 | 1.0036 | 1.0422 | 1.0849 |
| November 2029 | 1.0307 | 1.0703 | 1.1142 |
| December 2029 | 1.0586 | 1.0992 | 1.1443 |
| January 2030 | 1.0871 | 1.1289 | 1.1752 |
Algorand Price Prediction 2030
As we turn the corner into 2030, the Algorand odyssey is expected to progress, with the minimum price forecasted to be $1.0751. With an average price of $1.2755, this could be indicative of Algorand’s solidifying presence in the market. Looking up, a maximum price of $1.5170 might be within reach, suggesting a decade of growth coming to fruition.
| Month | Minimum Price | Average Price | Maximum Price |
|---|---|---|---|
| February 2030 | 1.0751 | 1.1165 | 1.1622 |
| March 2030 | 1.1042 | 1.1466 | 1.1936 |
| April 2030 | 1.1340 | 1.1776 | 1.2258 |
| May 2030 | 1.1646 | 1.2093 | 1.2589 |
| June 2030 | 1.1960 | 1.2420 | 1.2929 |
| July 2030 | 1.2283 | 1.2755 | 1.3278 |
| August 2030 | 1.2615 | 1.3100 | 1.3637 |
| September 2030 | 1.2956 | 1.3453 | 1.4005 |
| October 2030 | 1.3305 | 1.3817 | 1.4383 |
| November 2030 | 1.3665 | 1.4190 | 1.4772 |
| December 2030 | 1.4034 | 1.4573 | 1.5170 |
| January 2031 | 1.4413 | 1.4966 | 1.5580 |
Algorand Price Prediction 2031
Venturing into 2031, the financial soothsayers predict Algorand’s minimum price to be an impressive $1.4254. The average price is expected to ascend to $1.6911, potentially showcasing the crypto’s resilience and long-term appeal. A maximum price of $2.0113 might just be the crowning achievement for investors betting on Algorand’s success.
| Month | Minimum Price | Average Price | Maximum Price |
|---|---|---|---|
| February 2031 | 1.4254 | 1.4802 | 1.5409 |
| March 2031 | 1.4639 | 1.5202 | 1.5825 |
| April 2031 | 1.5035 | 1.5612 | 1.6252 |
| May 2031 | 1.5441 | 1.6034 | 1.6691 |
| June 2031 | 1.5857 | 1.6467 | 1.7142 |
| July 2031 | 1.6286 | 1.6911 | 1.7605 |
| August 2031 | 1.6725 | 1.7368 | 1.8080 |
| September 2031 | 1.7177 | 1.7837 | 1.8568 |
| October 2031 | 1.7641 | 1.8318 | 1.9069 |
| November 2031 | 1.8117 | 1.8813 | 1.9584 |
| December 2031 | 1.8606 | 1.9321 | 2.0113 |
| January 2032 | 1.9108 | 1.9843 | 2.0656 |
Algorand Price Prediction 2032
By 2032, the crystal ball reveals a minimum price of $1.8898 for Algorand, suggesting a future where the digital currency has cemented its reputation. An average price of $2.2420 could signify a stabilizing asset popular with investors. Those aiming high could potentially revel in a maximum price of $2.6665, a testament to Algorand’s enduring appeal and market strength.
| Month | Minimum Price | Average Price | Maximum Price |
|---|---|---|---|
| February 2032 | 1.8898 | 1.9624 | 2.0428 |
| March 2032 | 1.9408 | 2.0154 | 2.0980 |
| April 2032 | 1.9932 | 2.0698 | 2.1547 |
| May 2032 | 2.0470 | 2.1257 | 2.2128 |
| June 2032 | 2.1023 | 2.1831 | 2.2726 |
| July 2032 | 2.1591 | 2.2420 | 2.3339 |
| August 2032 | 2.2174 | 2.3025 | 2.3970 |
| September 2032 | 2.2772 | 2.3647 | 2.4617 |
| October 2032 | 2.3387 | 2.4286 | 2.5281 |
| November 2032 | 2.4019 | 2.4941 | 2.5964 |
| December 2032 | 2.4667 | 2.5615 | 2.6665 |
| January 2033 | 2.5333 | 2.6306 | 2.7385 |
The Main Questions Of Critical Thinking When We Talk About Algorand Price Forecast
When embarking on the intricate task of forecasting the price of ALGO, it’s crucial to engage in a level of critical thinking that goes beyond surface-level analysis. This means asking the right questions to challenge assumptions, consider alternative outcomes, and evaluate the reliability of data sources.
- What fundamental factors could significantly impact Algorand’s market value in the coming years?
- How might regulatory changes in major economies influence the price of ALGO?
- In what ways could Algorand’s technological advancements outpace competitors and affect its price?
- What historical market trends can we analyze to predict the future volatility of ALGO?
- How do the tokenomics of Algorand, including supply and demand, play a role in its price forecast?
- Could the adoption of ALGO by mainstream financial institutions lead to an increase in its price?
- What potential global economic events could pose a risk to Algorand’s price stability?
- How resilient is ALGO to the shifting sentiments and trends in the cryptocurrency market?
- How could partnerships and collaborations with other blockchain projects influence Algorand’s price?
- What are the technological risks, such as network security concerns, that could impact the value of ALGO?
- In what manner might the overall growth of the blockchain industry affect Algorand’s market positioning?
- Could the entry of new, similar cryptocurrencies dilute ALGO’s market share and value?
- How might changes in Algorand’s protocol or governance model affect investor confidence and price?
- What external market forces, such as inflation or deflation in fiat currencies, could affect the trading price of ALGO?
- How will Algorand’s scalability and transaction speed compare to emerging technologies in influencing its price?
- How susceptible is ALGO to “pump and dump” schemes or market manipulation by influential figures?
- What impact could community support and sentiment have on Algorand’s long-term price trajectory?
- How might international political developments that affect digital currency acceptance impact ALGO prices?
- How well is Algorand positioned to adapt to evolving regulatory and compliance requirements?
- What influence might advancements in quantum computing have on the security of ALGO and its market price?
In conclusion, delving into the Algorand price forecast with a critical eye is essential. By interrogating the various facets of ALGO’s ecosystem and market behavior through these questions, we equip ourselves with a more robust foundation for making informed predictions and investment decisions.
Algorand (ALGO) Future Price Predictions by Experts
Stepping into the choppy waters of cryptocurrency, I’ve been listening to what the experts say about Algorand (ALGO).
- Wallet Investor: The long-term outlook from Wallet Investor suggests that ALGO may not be a sound investment. They project that the token’s value could diminish, with a potential drop to $0.01024 by the end of 2024, implying that the current investment could depreciate over a 5-year period.
- Price Prediction: Price Prediction’s analysis indicates that ALGO’s future price might surpass $1.40, with an expected return on investment (ROI) of around 900%. Their forecast suggests that holding ALGO for 5 years could be a profitable bet for investors in the cryptocurrency.
- Crypto Predictions: Crypto Predictions has a positive view on ALGO’s future, anticipating the token could achieve an average price of $0.2915 in 2024. They forecast that the maximum price of Algorand could reach $0.36444 by the year’s end, with a minimum price of $0.24782.
- GOV Capital: GOV Capital’s ambitious bullish forecast for 2024 proposes that the year could end exceptionally well for Algorand, potentially hitting the $0.90 mark. They also suggest that, based on their ALGO price prediction, the token’s price might climb as high as $4.199 within the next 5 years.
- Digital Coin Price: The prediction from Digital Coin Price acknowledges Algorand’s entry into the highly competitive off-chain scaling sector. They posit that, due to listings on prestigious platforms and the token’s reputable origins, an increase in price above $0.75 by the end of 2025 is a strong possibility.
Here’s what I’ve picked up: investment advice from these experienced folks can be really helpful, but it’s not everything. Think of their tips like a pinch of seasoning; it’s good to add, but it won’t make your whole meal. You’ve got to do your own digging and learn the details yourself. That’s the honest way to really get what’s going on with your investment.
Decoding the Charts: Algorand Technical Price Analysis
Diving into the world of Algorand’s price movements, it’s like piecing together a complex puzzle. The key to understanding this puzzle lies in the charts—a cryptic treasure map for traders. Now, let’s roll up our sleeves and break down some of the tools that chart analysts use to tease out the secrets of price action:
- Candlestick Patterns: These are the bread and butter of any chart guru, showing the tug-of-war between buyers and sellers.
- Moving Averages: Think of these as the trail of breadcrumbs that shows where ALGO has been and hints at where it’s going.
- Volume Analysis: This tells you how loud the market’s shouting about ALGO—more volume usually means more conviction behind a price move.
- Support and Resistance Levels: These are the lines in the sand where ALGO’s price has historically bounced back or broken down.
- Trend Analysis: It’s like spotting which way the river’s flowing for ALGO’s prices—super handy for going with the flow or swimming upstream.
- Chart Patterns: These are the market’s secret handshakes; recognize them, and you might just get an invite to the profit party.
- Timeframes: Whether you’re in it for a quick fling or a long-term romance with ALGO, the timeframe you choose can set the stage for your trading strategy.
Technical Indicators: Origin and Purpose
Harking back to the days of ticker tapes and telegraphs, technical indicators were the crystal balls of the financial markets. Created to make sense of price movements, these indicators have become the compasses for navigating the choppy seas of trading. They help you to see beyond the horizon, offering glimpses of potential market directions.
The Role of Technical Indicators in Financial Markets
In the bustling world of financial markets, technical indicators serve as our north stars. They are the distilled essence of market sentiments, presenting data in a form that can help predict the next market swing. From the frantic floors of stock exchanges to the digital dashboards of crypto traders, these indicators provide a semblance of order, helping traders to cut through the noise and make informed decisions.
How Technical Indicators Can Help Predict ALGO Price
When it comes to ALGO, technical indicators are like the secret spices that can turn a bland price chart into a flavorful forecast. By analyzing past price actions and volumes, these indicators can signal potential price movements. They’re the trusty sidekicks for any ALGO enthusiast, providing clues that can help you decide when to hold tight and when it might be time to saddle up and ride the crypto wave.
In my trip through the land of trading, I’ve picked up a few handy tricks for making sense of those complex-looking charts – it’s like having a flashlight in a dark forest. These tricks won’t always lead you to a treasure chest, but they sure help clear the fog. My investing advice? Mix and match these tricks with a good, hard look at the overall market trends.
Let me share with you some of these trusty tools. I’m going to break down how they can give us a clue about where ALGO’s price might be swinging next. Think of it as a friendly tip, where I’m dishing out some insights that could help you navigate the highs and lows of crypto with a bit more confidence.
Moving Averages (MAs) for Algorand Price Prediction
Moving averages smooth out price data to create a single flowing line, making it easier to identify the direction of the trend. For Algorand, using MAs can help clarify whether we’re in a bull or bear market phase. You might use a short-term MA to get a sense of the immediate trend and a long-term MA to gauge the overall market sentiment.
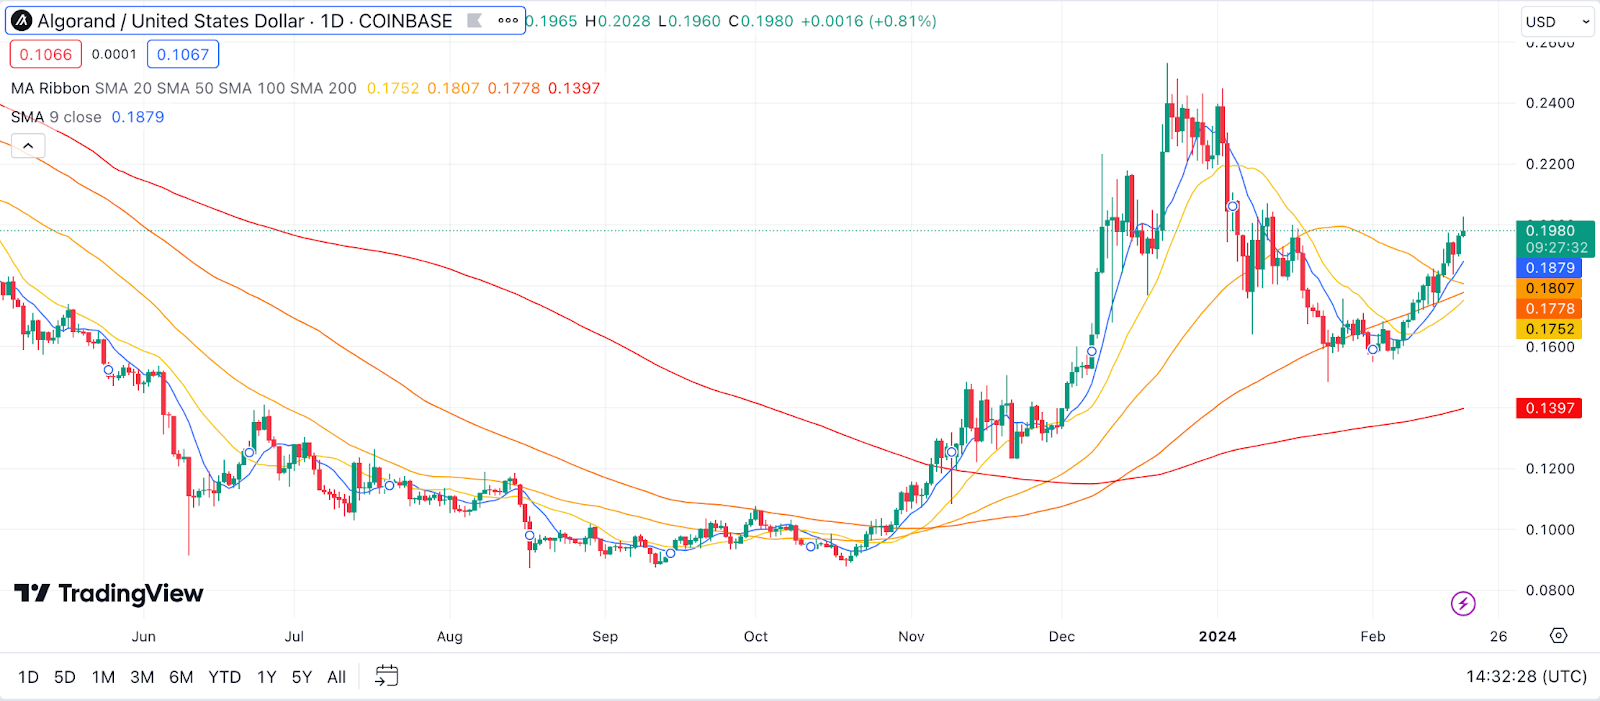
Example: Let’s say ALGO’s price has been a rollercoaster, but you’re looking at a 50-day MA creeping above a 200-day MA. This could be your signal that a bullish trend is picking up steam, suggesting it might be time to consider your move.
Relative Strength Index (RSI) for Algorand Price Prediction
The Relative Strength Index is a momentum oscillator that measures the speed and change of price movements on a scale from 0 to 100. For ALGO, an RSI above 70 might indicate it’s overbought (and potentially overvalued), while an RSI below 30 could suggest it’s oversold (and possibly undervalued).
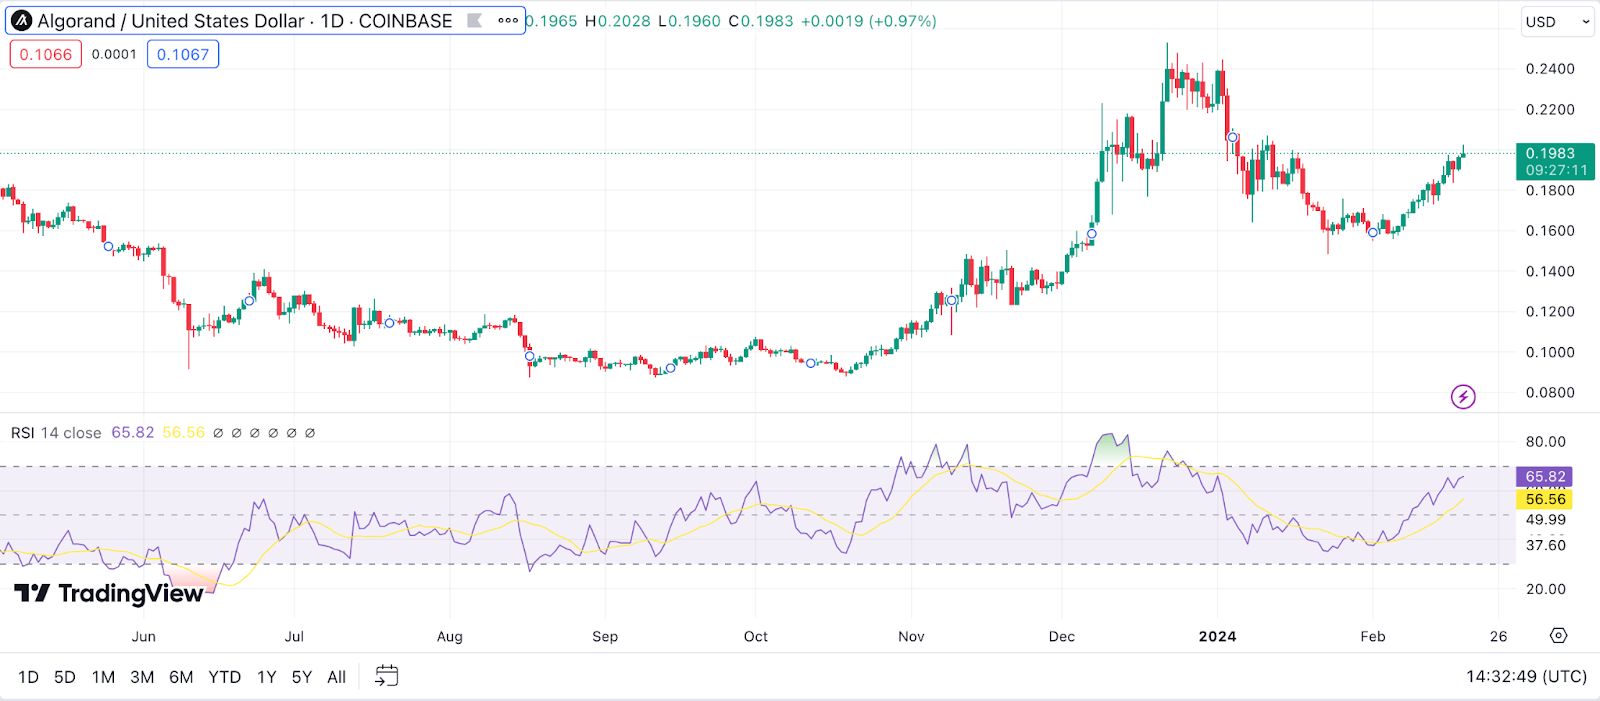
Example: If ALGO has been on a tear and the RSI hovers around 75, it might be time to brace for a potential pullback or correction. This high RSI reading could hint that the market’s enthusiasm for ALGO might be a bit overheated.
Moving Average Convergence Divergence (MACD) for Algorand Price Prediction
The MACD is all about the relationship between two moving averages of a cryptocurrency’s price. By comparing short-term momentum to longer-term momentum, MACD can signal changes in the trend’s direction. For ALGO, a MACD crossover can indicate a buying or selling opportunity, depending on the direction of the cross.
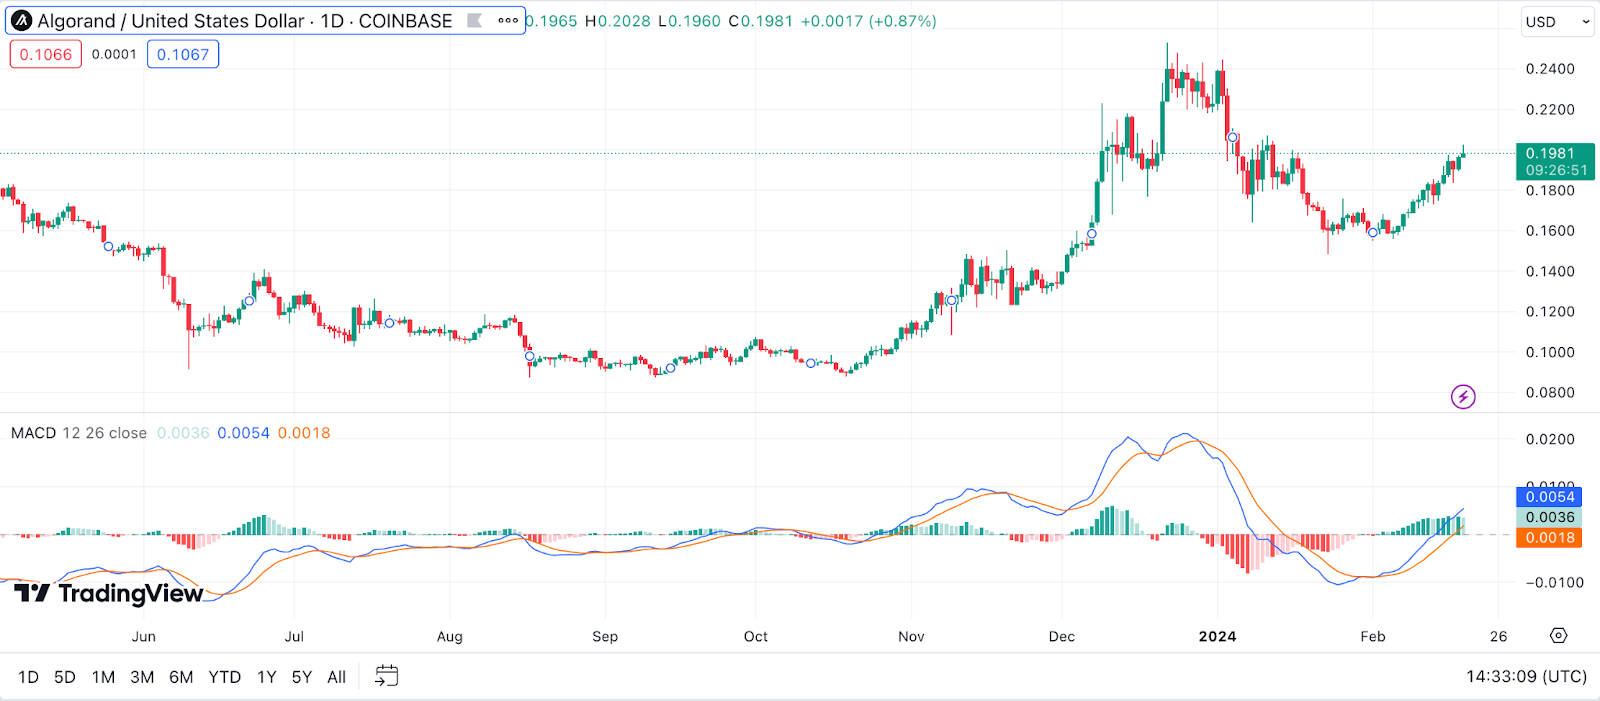
Example: Imagine the MACD line for ALGO crosses above the signal line – this could be your cue that bullish momentum is building. On the flip side, if the MACD line dips below the signal line, it might be a warning sign that bearish winds are blowing.
Bollinger Bands for Algorand Price Prediction
Bollinger Bands are like the guardrails of the crypto price highway, consisting of a middle line (which is a moving average) flanked by two standard deviation lines. These bands expand and contract based on ALGO’s volatility. When the price touches the upper band, it might be considered overbought; touching the lower band could indicate it’s oversold.
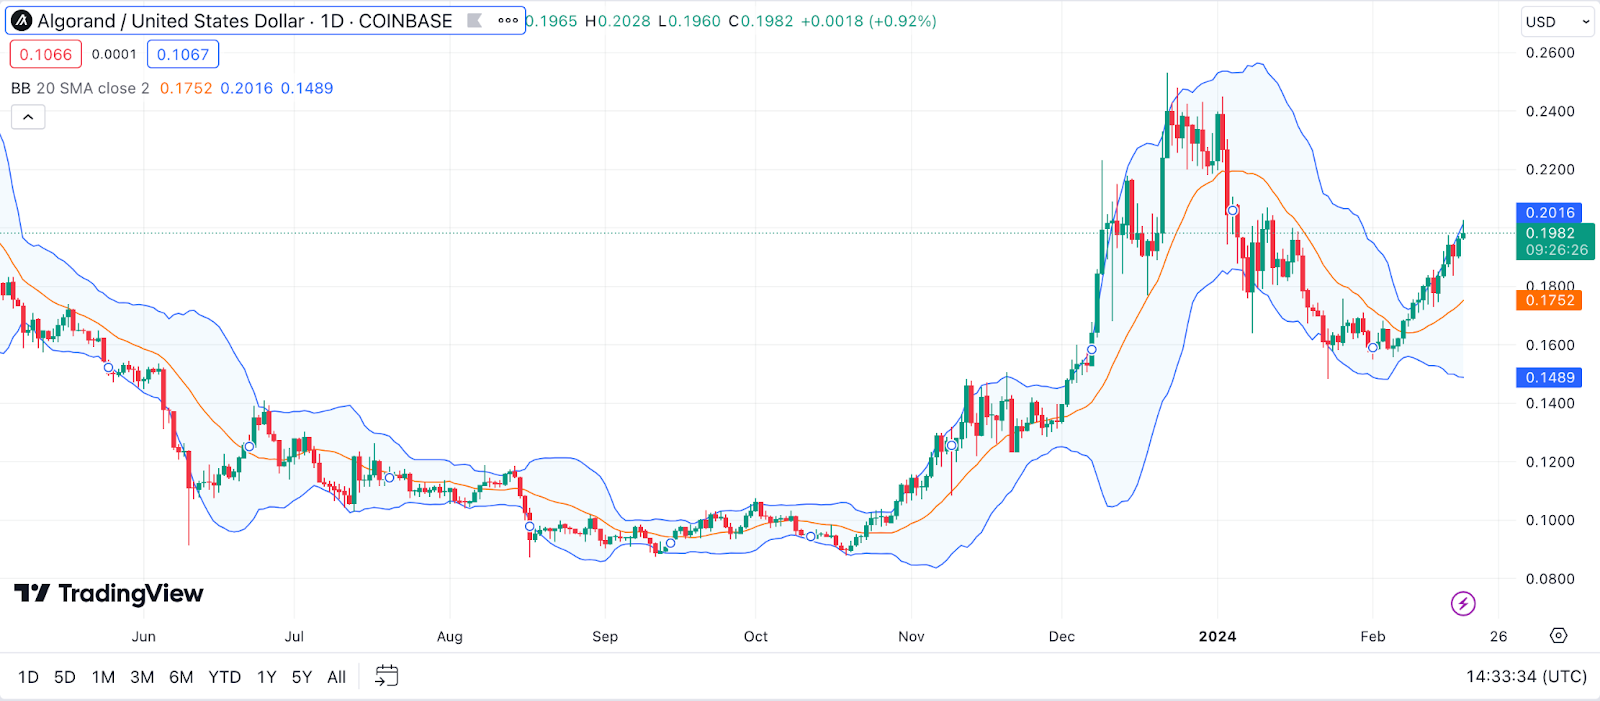
Example: If ALGO’s price starts hugging the upper Bollinger Band with increased volume, it might be signaling strong buying pressure. But, if it suddenly starts to flirt with the lower band, that could be a cue for potential selling pressure or even a downward trend.
Stochastic Oscillator for Algorand Price Prediction
The Stochastic Oscillator is all about momentum, comparing ALGO’s closing price to a range of its prices over a certain period. The idea is to identify when ALGO might be overbought or oversold, suggesting a reversal could be on the horizon. The scale runs from 0 to 100, with high readings indicating overbought conditions and low readings signaling oversold conditions.
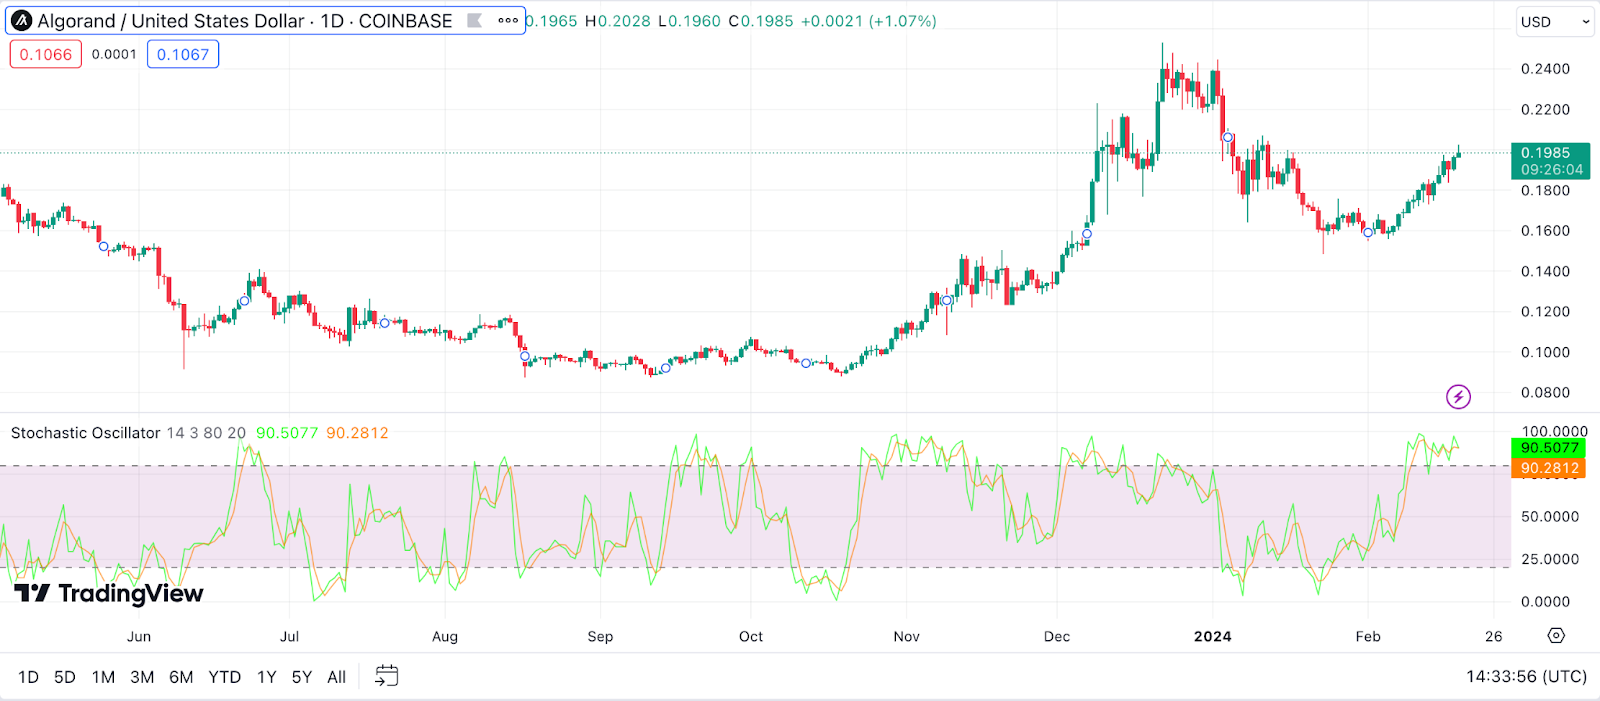
Example: Suppose ALGO’s stochastic lines cross above 80. This might be your hint that the market is getting a bit too excited and a price pullback could be in order. Conversely, a dip below 20 suggests ALGO might be undervalued, potentially setting the stage for a bullish reversal.
Parabolic SAR (Stop and Reverse) for Algorand Price Prediction
The Parabolic SAR is a nifty tool for spotting potential reversals in ALGO’s price direction. It places dots or points on a chart that indicate potential “stop and reverse” points, providing visual cues for entry and exit points. When the dots are below the candles, it suggests an upward trend; above the candles, a downward trend.
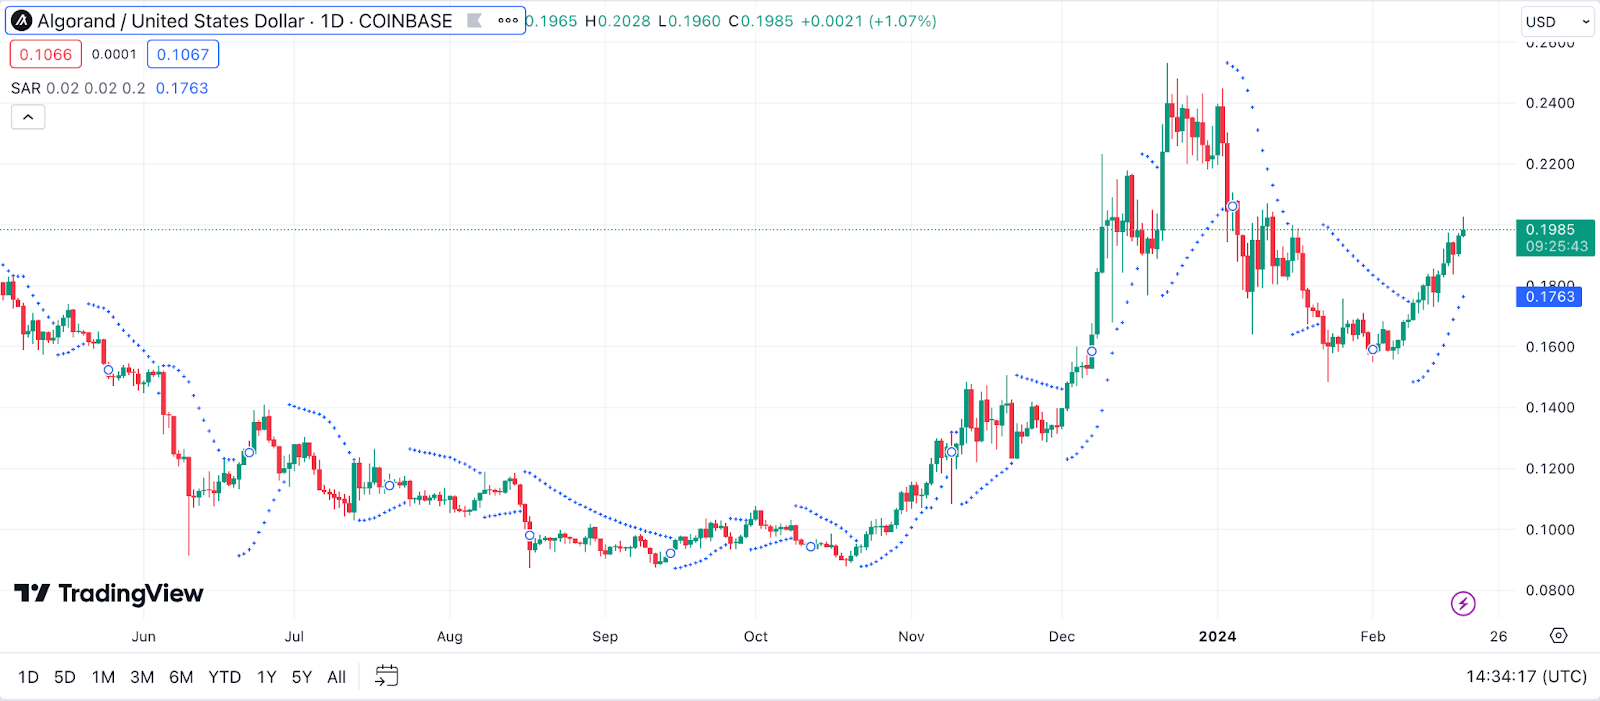
Example: Watching ALGO’s chart, you notice the Parabolic SAR dots flip below the price candles, moving from above. This switch could be your green light that the trend is shifting from bearish to bullish, potentially opening up a buying opportunity.
Ichimoku Cloud for Algorand Price Prediction
The Ichimoku Cloud offers a comprehensive look at market sentiment by providing five distinct indicators on a single chart. This “glance” gives a nuanced picture of ALGO’s potential price action, highlighting support and resistance levels, trend direction, and momentum. When ALGO’s price is above the cloud, it’s generally seen as bullish; below the cloud, bearish.
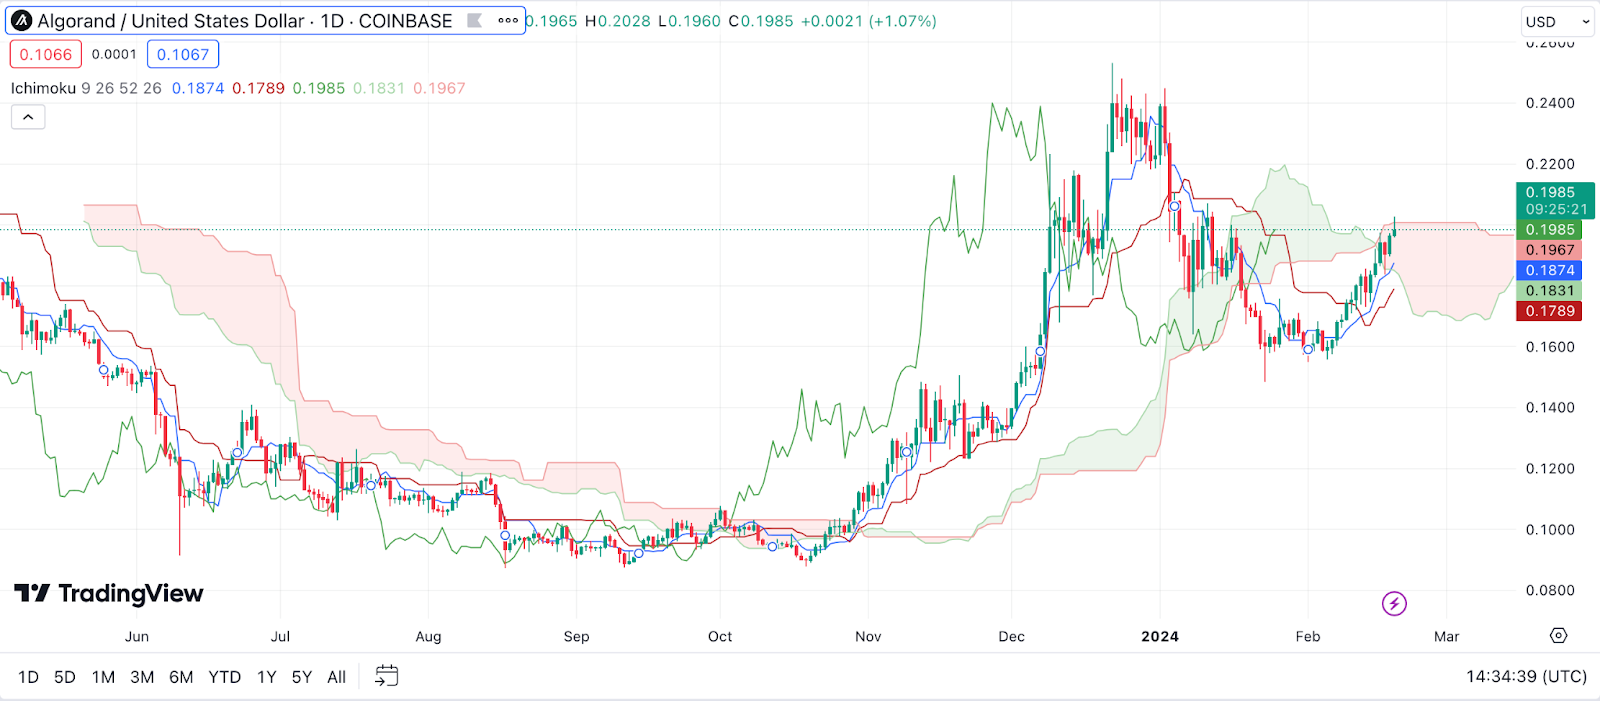
Example: Imagine ALGO’s price breaks through and sits above the Ichimoku Cloud. This could be a strong bullish signal, suggesting the path ahead is clear for potential upward momentum. Conversely, if the price drops below the Cloud, it might be time to buckle up for a possible downtrend.
Fibonacci Retracement for Algorand Price Prediction
Fibonacci Retracement levels are based on the key numbers identified by mathematician Leonardo Fibonacci. These levels are used to identify potential reversal points by drawing lines at certain percentages of a price move. For ALGO, these retracement levels can indicate where support and resistance might occur during pullbacks in an uptrend or rallies in a downtrend.
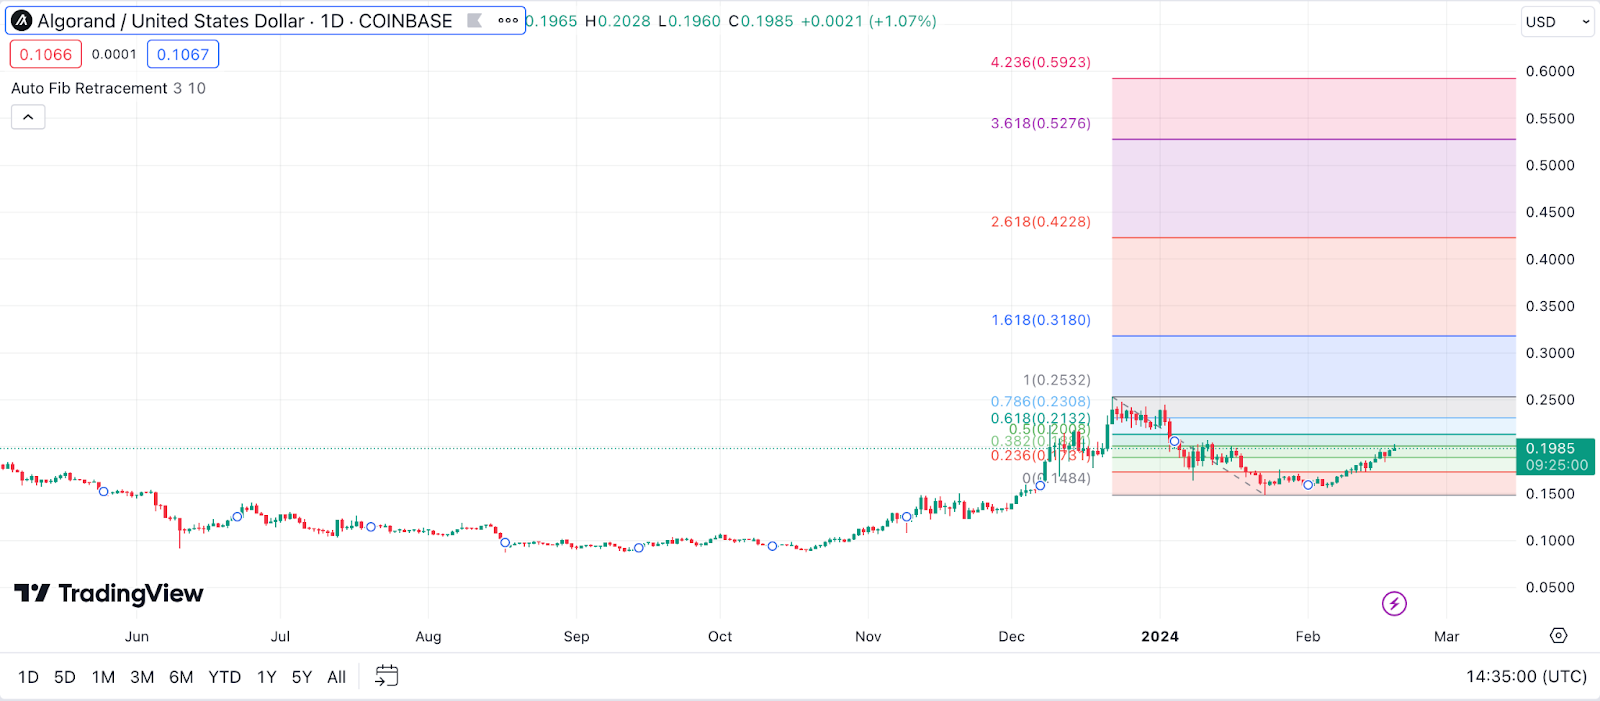
Example: Let’s say ALGO has experienced a significant price surge. By applying Fibonacci Retracement levels to this move, you might find potential support levels during a retracement at 38.2%, 50%, and 61.8%. If ALGO’s price dips but then bounces off one of these levels, it could indicate the uptrend is still intact.
Average Directional Index (ADX) for Algorand Price Prediction
The ADX is a technical analysis indicator used to quantify the strength of a trend, regardless of its direction. An ADX value above 25 generally indicates a strong trend, either up or down, while below 25 suggests a weaker trend or trading range. For ALGO, a rising ADX could indicate that the current trend (bullish or bearish) is gaining momentum.
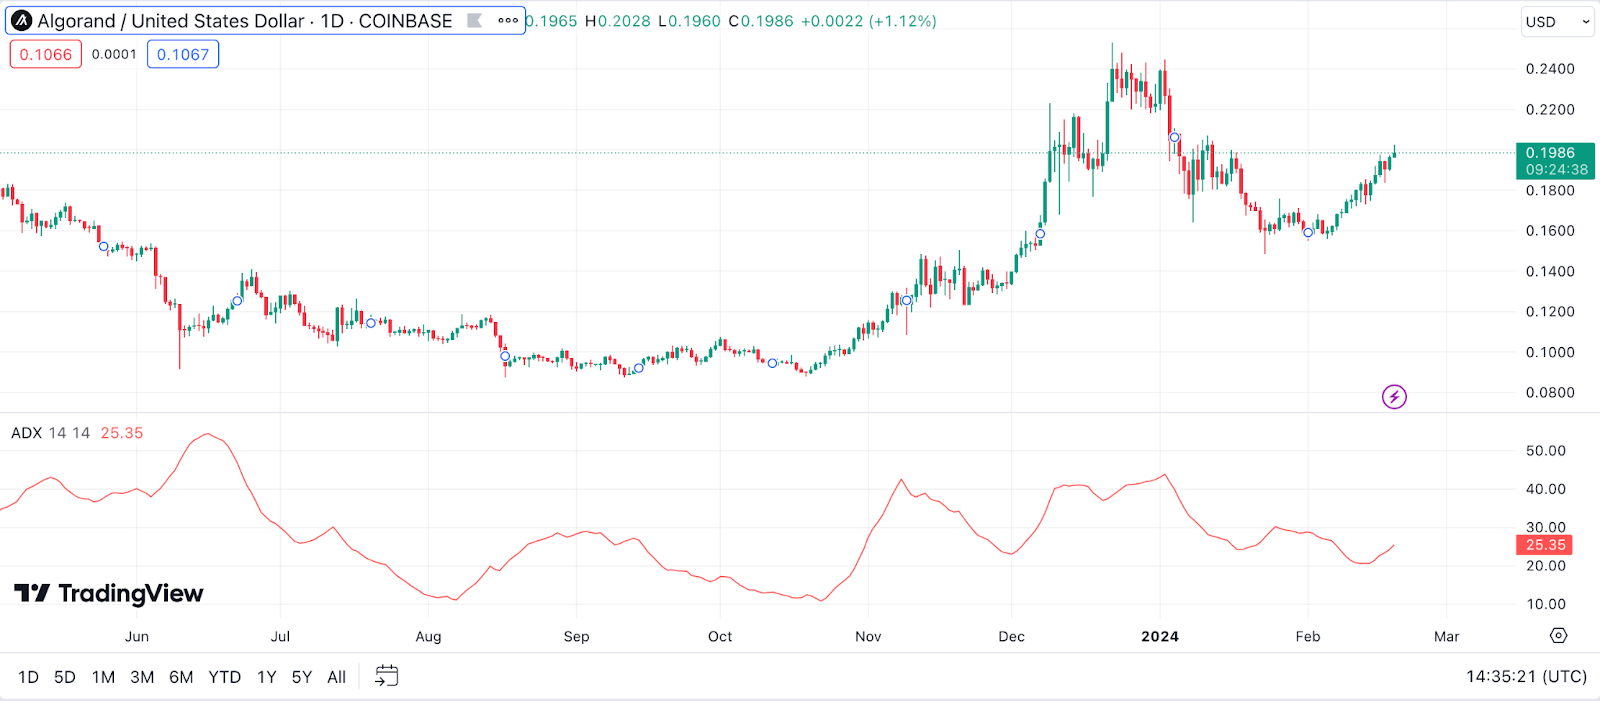
Example: If you’re tracking ALGO and notice the ADX begins to climb above 25 while the price is trending upwards, it might reinforce your confidence in a strong bullish trend. Conversely, an ADX rise during a downtrend could signal that bearish pressures are strengthening, warranting caution.
On Balance Volume (OBV) for Algorand Price Prediction
On Balance Volume (OBV) is a momentum indicator that uses volume flow to predict changes in ALGO price. The theory is that volume precedes price movement, so if OBV is rising, it’s generally thought that positive momentum is building up. Conversely, if OBV is falling, it might indicate that selling pressure is increasing.
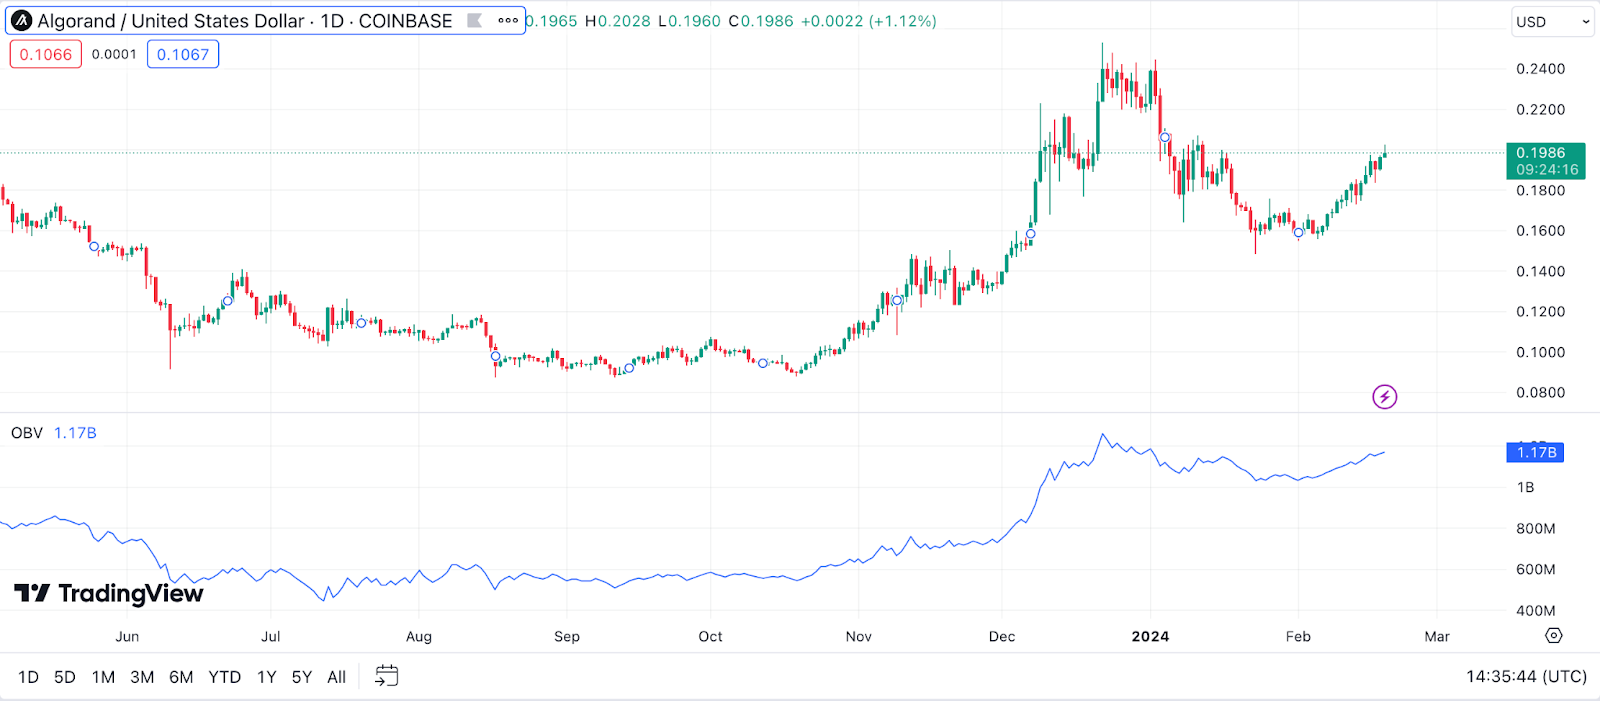
Example: Consider a scenario where ALGO’s price is somewhat stagnant, but you notice a steady increase in OBV. This divergence could hint at underlying buying pressure that hasn’t yet reflected in the price, suggesting a potential upward breakout might be on the cards.
Rate of Change (ROC) for Algorand Price Prediction
The Rate of Change (ROC) is a straightforward momentum oscillator that measures the percentage change in price between the current price and the price a certain number of periods ago. For ALGO, a rising ROC indicates acceleration, which could signal strengthening bullish momentum, while a falling ROC might indicate a slowdown or bearish momentum.
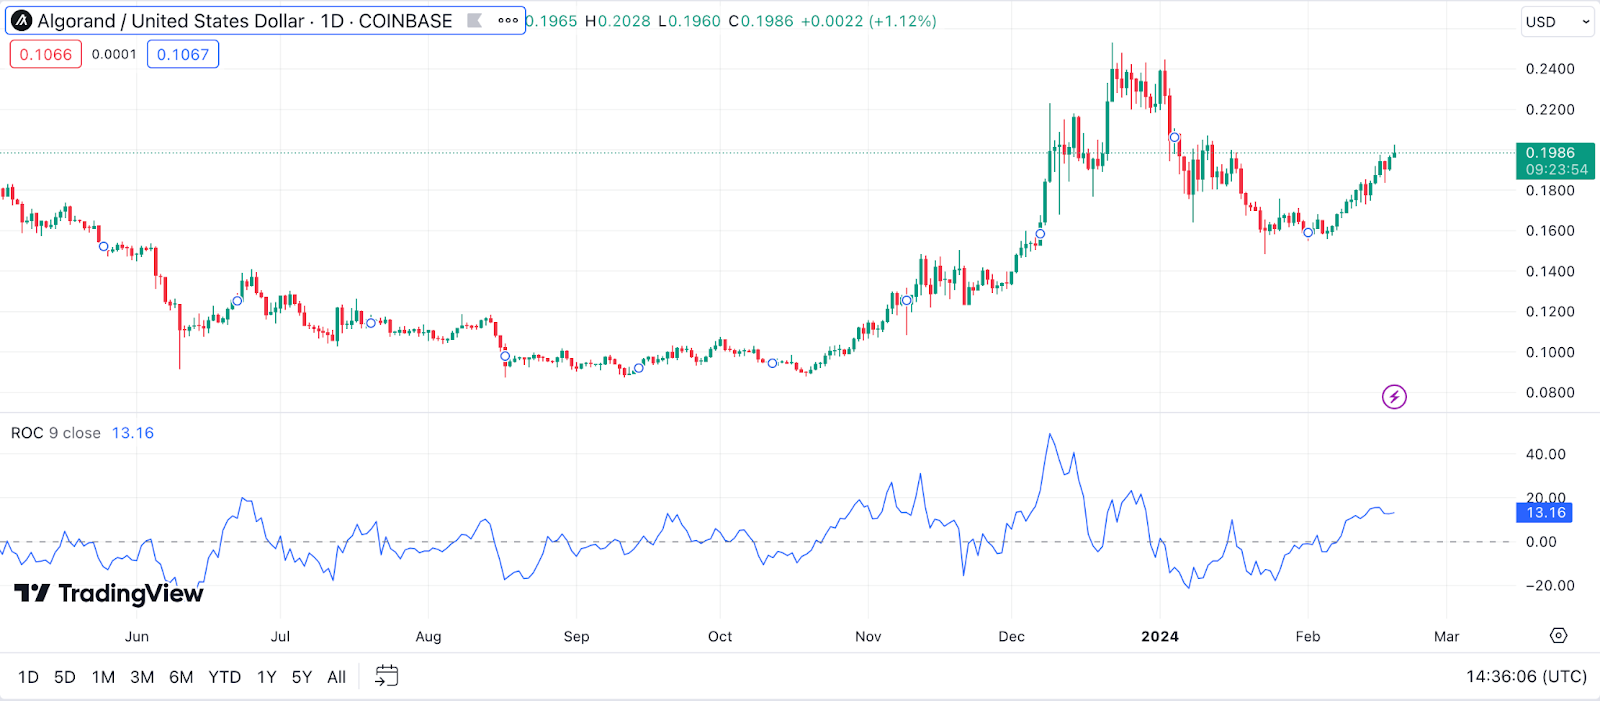
Example: If ALGO has been on a steady climb and the ROC starts to trend upward sharply, it’s signaling that the price is gaining speed to the upside. This rapid change could be a sign that the bullish trend is picking up steam, potentially offering a good entry point for momentum traders.
Commodity Channel Index (CCI) for Algorand Price Prediction
The Commodity Channel Index (CCI) is an oscillator that can help identify cyclical trends in ALGO’s price. It moves above and below zero, highlighting periods of overbought or oversold conditions based on typical deviation from an average price. A high CCI indicates that ALGO’s price is above its average, suggesting overbought conditions, while a low CCI indicates oversold conditions.
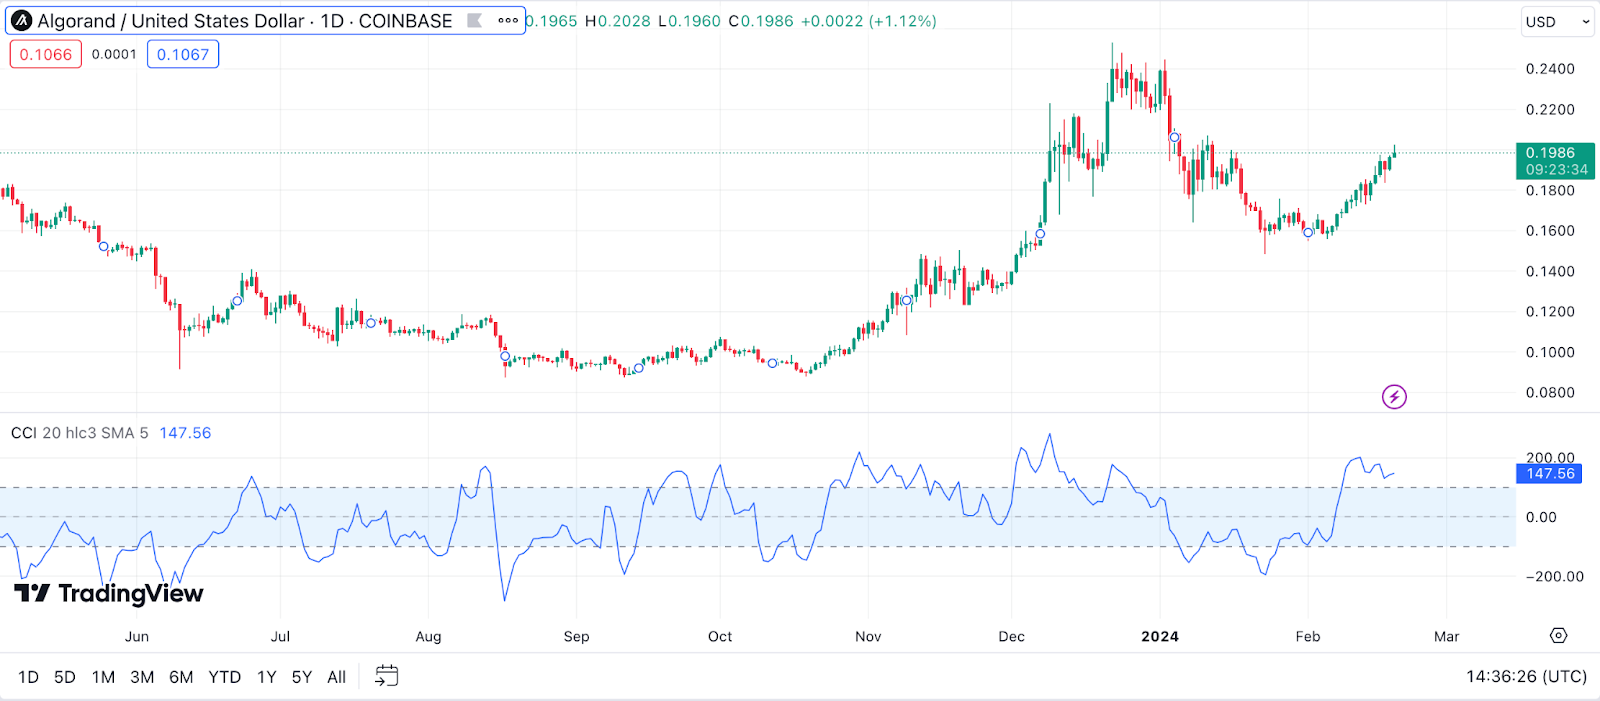
Example: If the CCI for ALGO spikes above +100, it might be time to watch for a potential pullback as the price could be reaching a peak. On the flip side, a dip below -100 could indicate that ALGO is undervalued at its current price level, potentially presenting a buying opportunity for those looking to catch a rebound.
Accumulation/Distribution Line (A/D Line) for Algorand Price Prediction
The Accumulation/Distribution Line (A/D Line) is a volume-based indicator designed to measure the cumulative flow of money into and out of ALGO. It helps to identify whether ALGO is being “accumulated” (bought) or “distributed” (sold). An upward trend in the A/D Line suggests accumulation and could be a bullish sign, while a downward trend might indicate distribution, potentially a bearish signal.
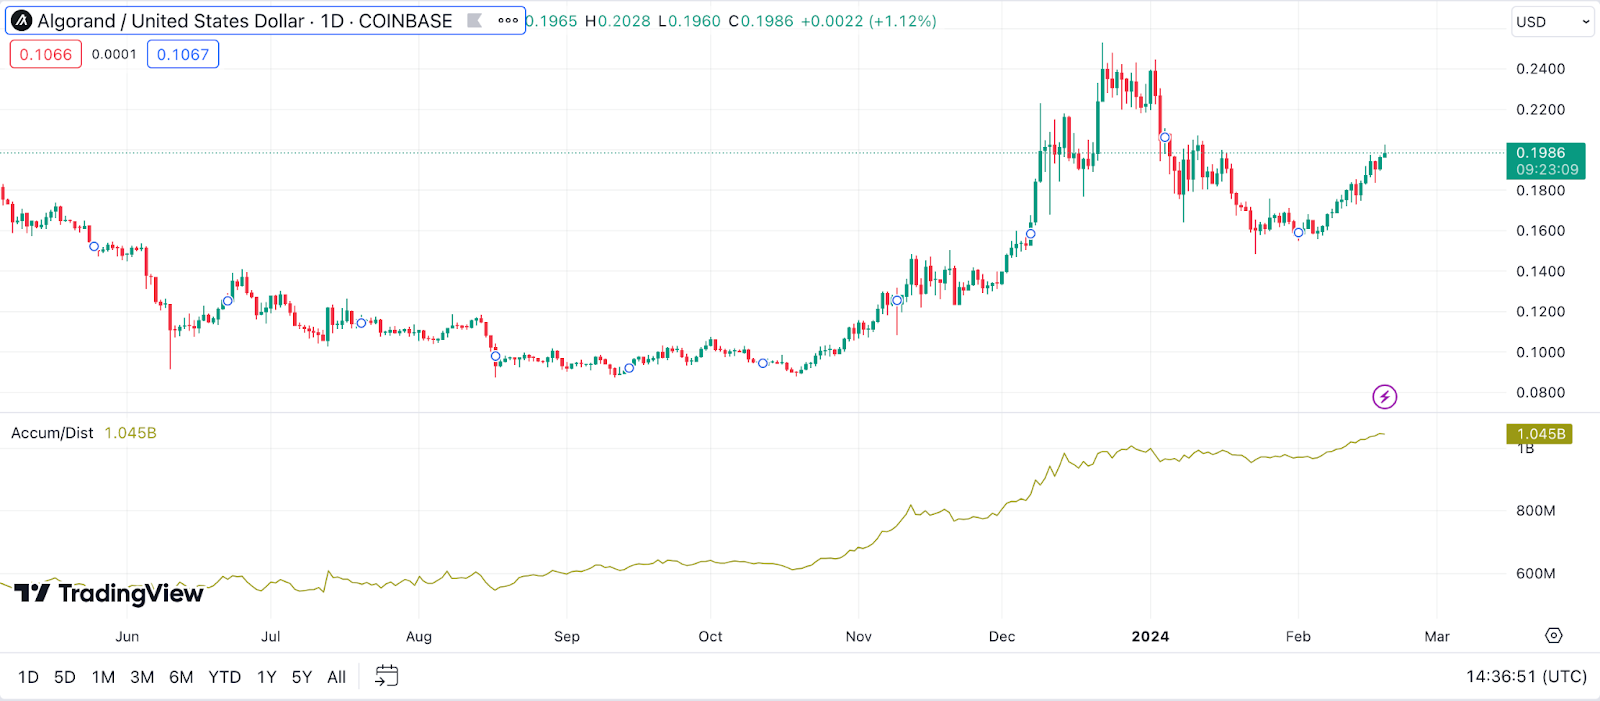
Example: If you see ALGO’s price making a new high but the A/D Line isn’t following suit, it could be a warning that despite the higher prices, the asset isn’t being accumulated aggressively, possibly hinting at a lack of strong buyer support.
Pivot Points for Algorand Price Prediction
Pivot Points are used to identify potential support and resistance levels based on previous highs, lows, and closing prices. For ALGO, these points can act as markers for traders, indicating levels where the price of ALGO might experience resistance or support, and potentially reverse direction.
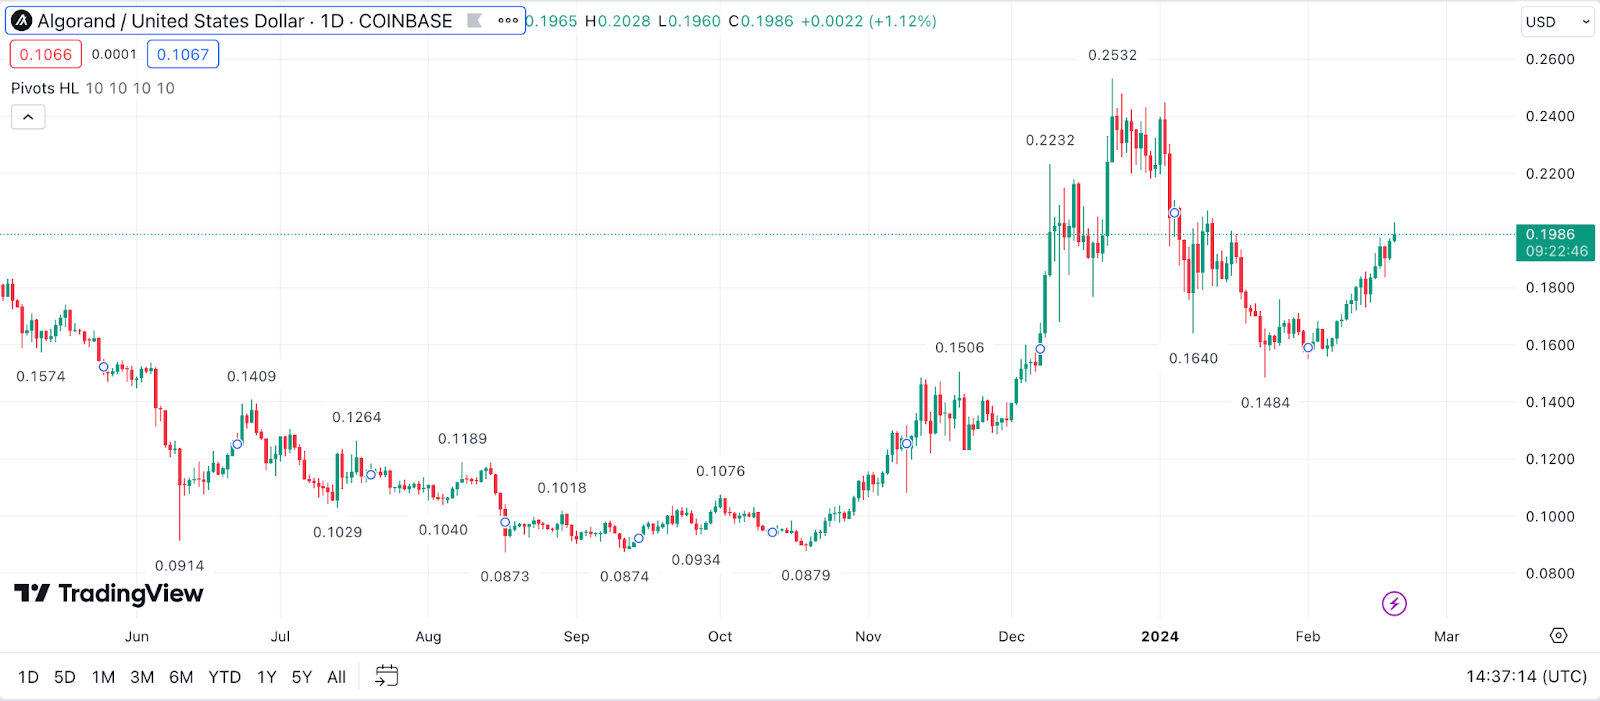
Example: Imagine ALGO is trading upward towards a calculated pivot point. If the price starts to stall or reverse at this level, it could be a sign that the pivot point is acting as resistance, suggesting a possible selling opportunity or a point to set a stop-loss for long positions.
Chaikin Money Flow (CMF) for Algorand Price Prediction
The Chaikin Money Flow (CMF) combines price and volume to measure the buying and selling pressure for ALGO over a set period. A positive CMF would indicate that buying pressure is dominant, suggesting bullish sentiment, while a negative CMF indicates selling pressure, which might be considered bearish.
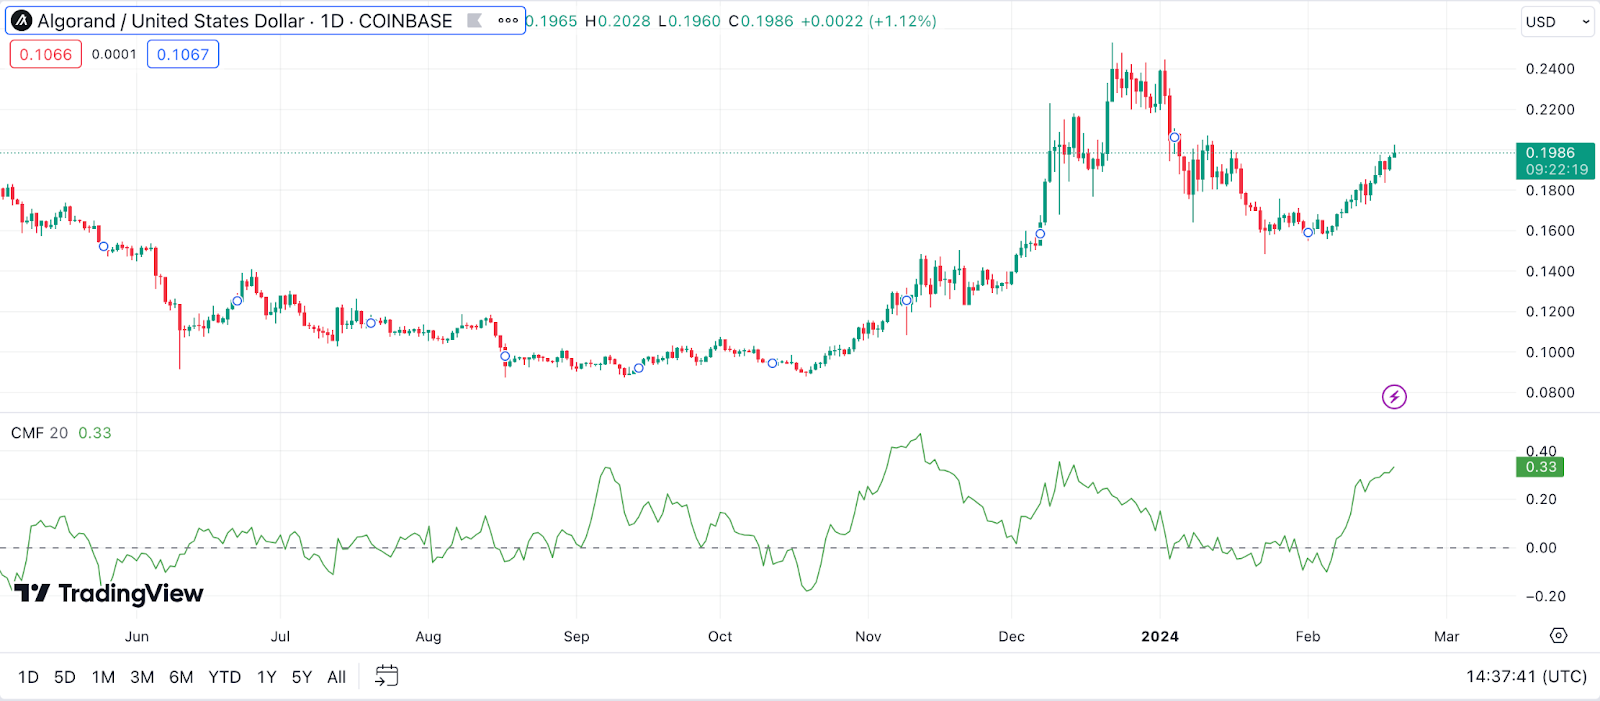
Example: If ALGO’s price is consolidating but you notice a rising CMF, this divergence could suggest that buying pressure is building up beneath the surface, potentially leading to a breakout to the upside. Conversely, a falling CMF during a consolidation phase might warn of an impending price drop.
Aroon Indicator for Algorand Price Prediction
The Aroon Indicator is a tool used to identify trend changes and the strength of a trend by measuring the time it takes for the price to reach its high and low points over a given time period. For ALGO, the Aroon Up and Aroon Down lines can signal the start of a new trend or the end of a current one. A high Aroon Up combined with a low Aroon Down can indicate a strong bullish trend, and vice versa for bearish trends.
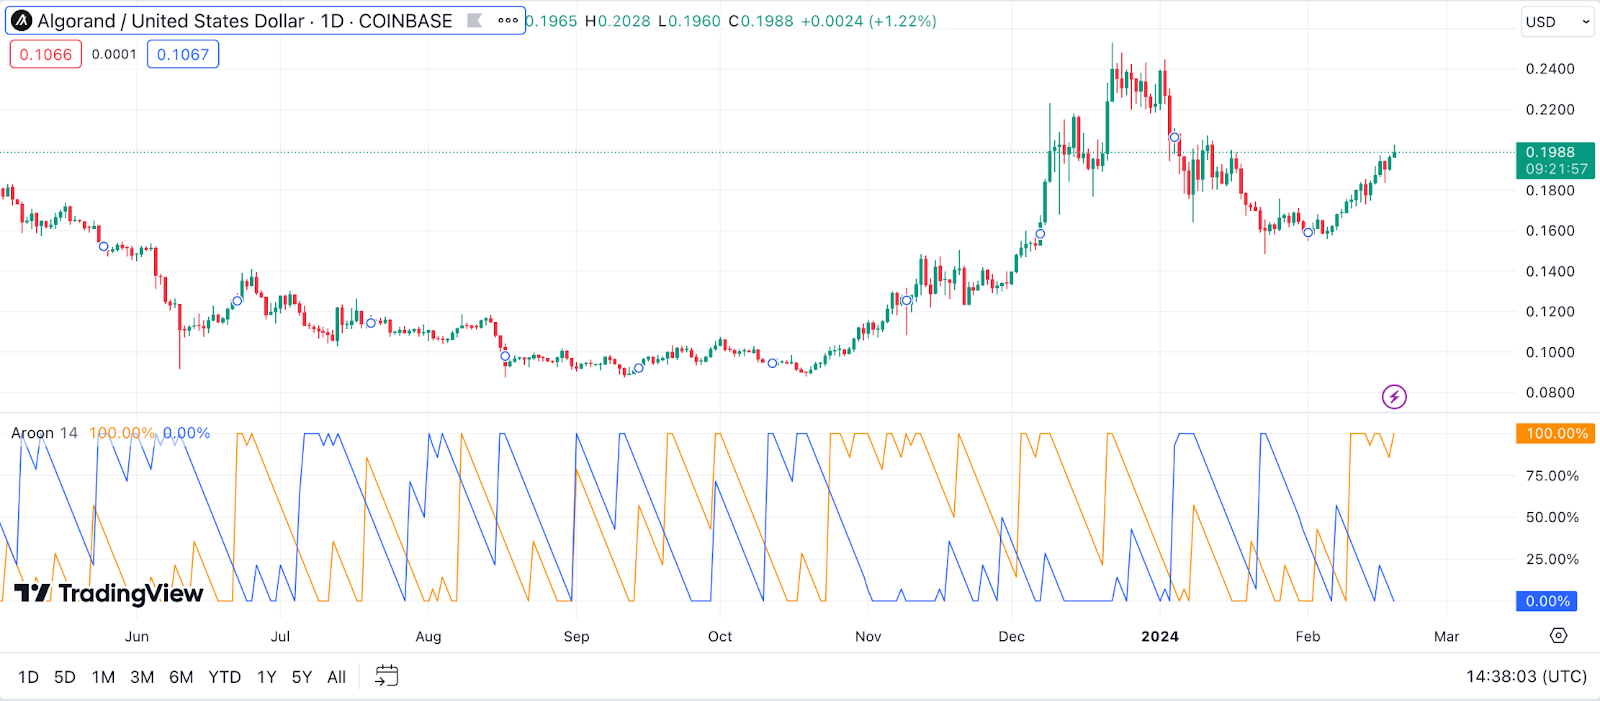
Example: If ALGO’s Aroon Up line crosses above the Aroon Down line and heads towards 100, it’s a bullish signal suggesting that ALGO’s price might be entering an upward trend. This could be a good time to consider buying or holding onto existing positions.
Gann Fan for Algorand Price Prediction
The Gann Fan is a technical analysis tool that uses angles to represent potential support and resistance levels based on time and price movements. For ALGO, the Gann Fan can help identify key turning points or areas where the price might accelerate or decelerate. Each angle of the fan might act as a path that ALGO’s price could follow, depending on market conditions.
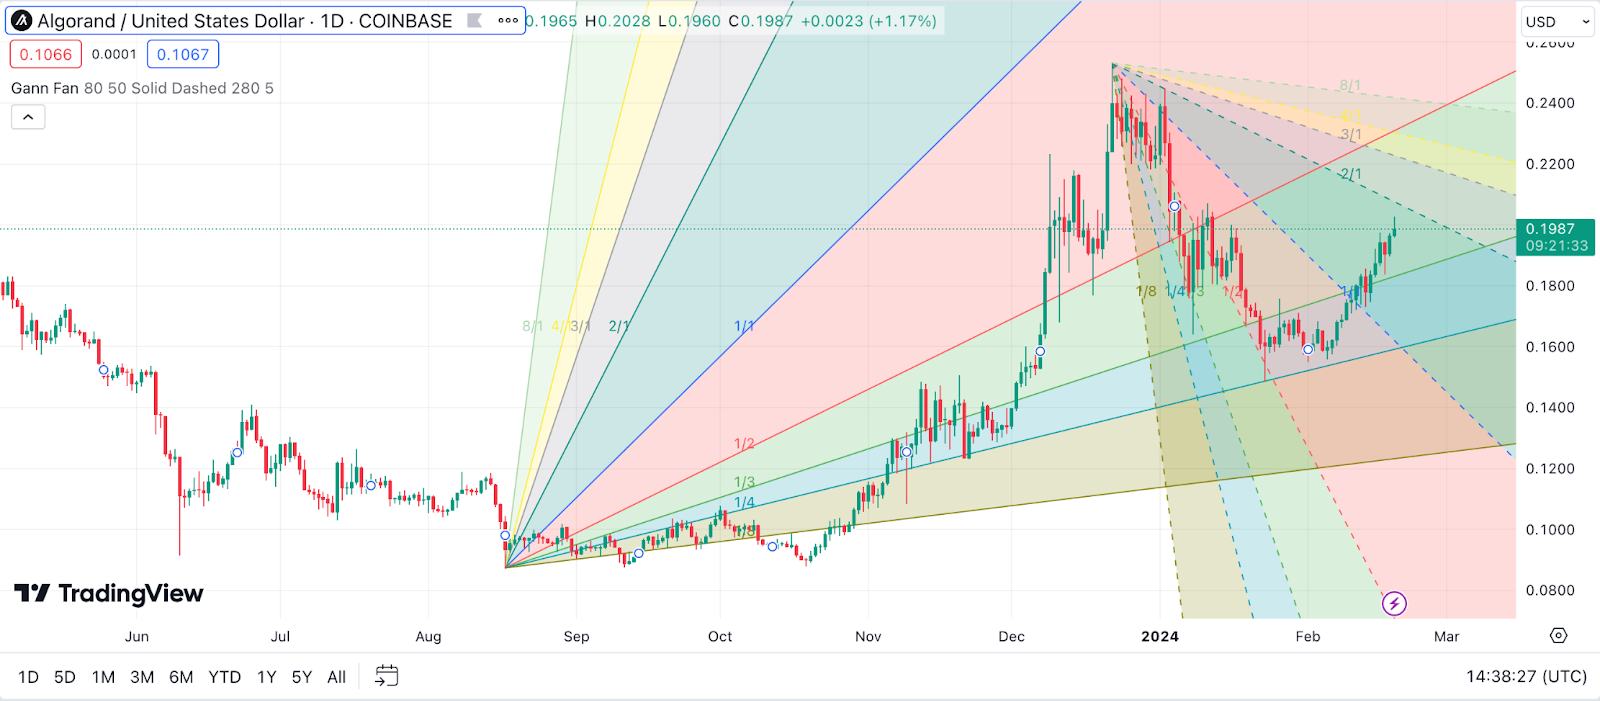
Example: When applying a Gann Fan to ALGO’s chart at a significant low or high, you might observe the price reacting to these angled lines, using them as either support or resistance. A break above a Gann angle could indicate that ALGO is gaining strength and might continue to rise, while a break below could signal weakness.
Keltner Channel for Algorand Price Prediction
Keltner Channels are volatility-based envelopes set above and below an exponential moving average (EMA). They expand and contract with the volatility of ALGO’s price. These channels can help traders identify potential trend reversals and breakouts by looking at how the price interacts with the channel boundaries.
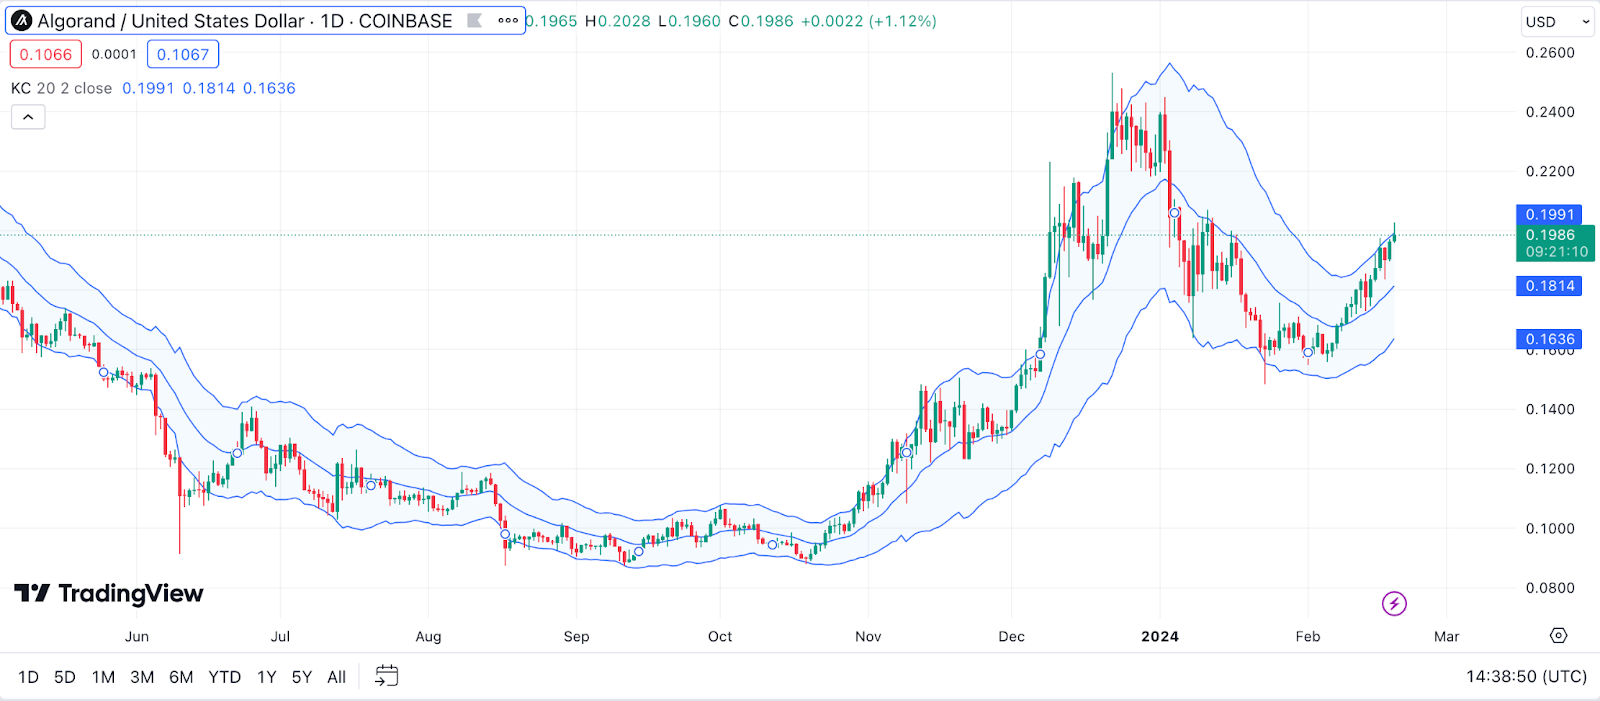
Example: If ALGO’s price starts to consistently close above the upper Keltner Channel, it might be a sign that the asset is overbought and could be due for a correction. Conversely, consistent closes below the lower channel could indicate an oversold condition, potentially leading to a reversal or bounce back to higher prices.
Money Flow Index (MFI) for Algorand Price Prediction
The Money Flow Index (MFI) is an oscillator that combines both price and volume to measure buying and selling pressure. It’s often referred to as the “volume-weighted RSI” and operates on a scale from 0 to 100. For ALGO, an MFI above 80 suggests overbought conditions (potentially overvalued), while below 20 indicates oversold conditions (potentially undervalued).
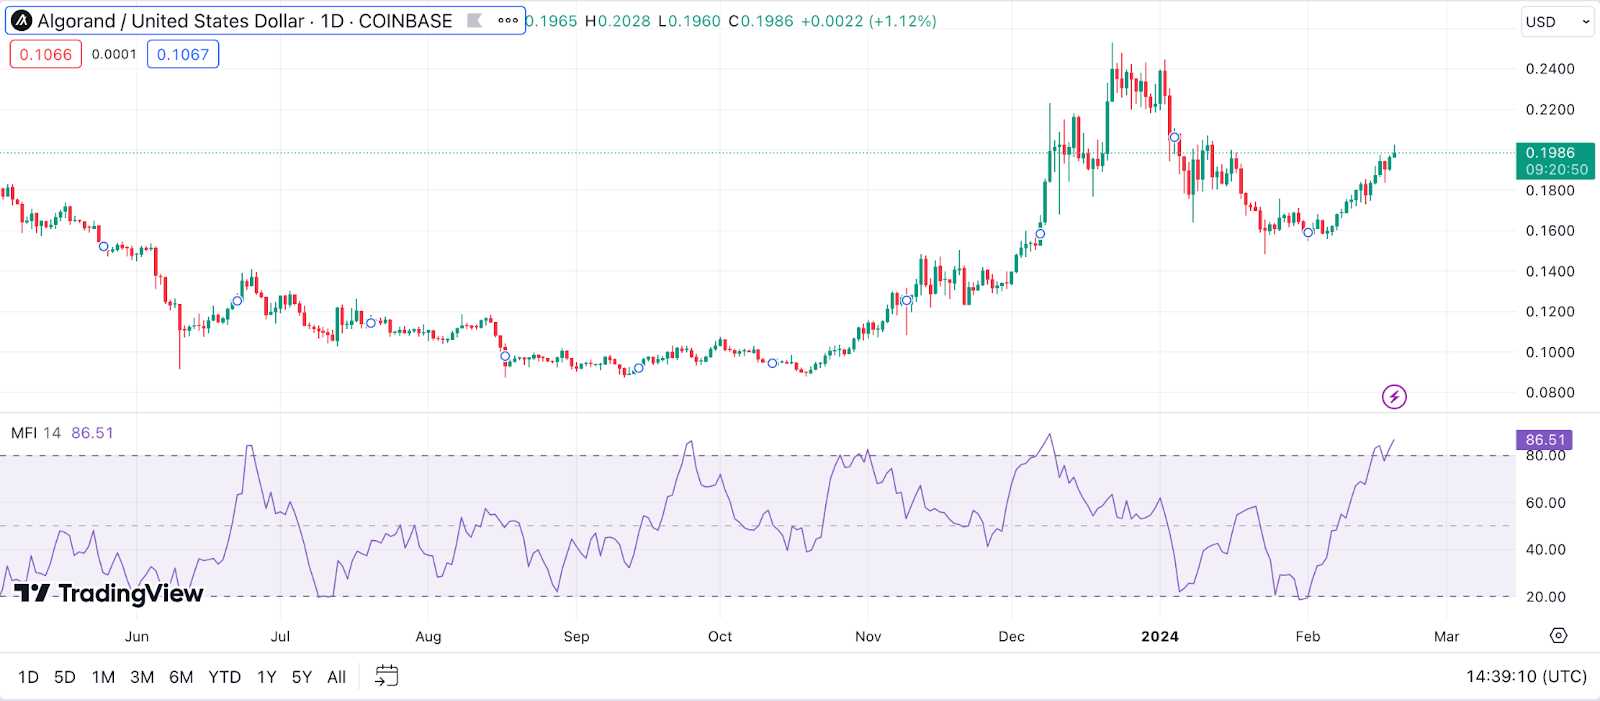
Example: If ALGO’s MFI dips below 20 during a downturn, it might signal that the selling pressure is exhausted and a reversal could be near. On the flip side, an MFI peaking above 80 during a rally might suggest the market is overheated, hinting at a possible pullback or consolidation phase.
TRIX for Algorand Price Prediction
TRIX is a momentum oscillator that shows the rate of change of a triple exponentially smoothed moving average of ALGO’s closing price. It helps to filter out insignificant price movements and highlight significant trends and reversals. A positive TRIX value indicates upward momentum, while a negative value suggests downward momentum.
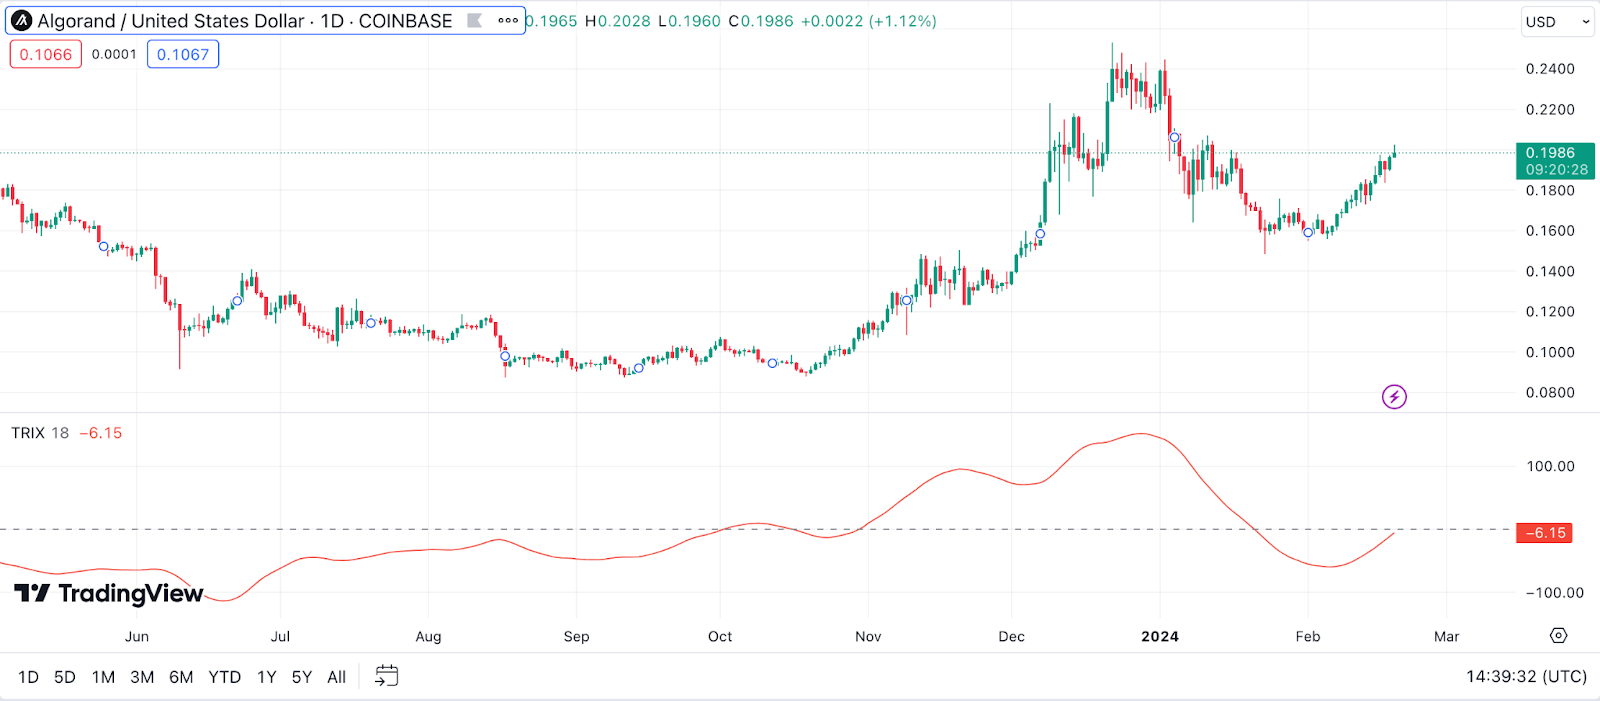
Example: If the TRIX line for ALGO crosses above the signal line, it could be interpreted as a bullish signal, indicating that momentum is building to the upside. Conversely, a cross below the signal line might be seen as a bearish sign, suggesting that downward momentum is gaining strength.
The Zig Zag Indicator for Algorand Price Prediction
The Zig Zag indicator is used to filter out the noise from ALGO’s price chart by only showing significant reversals. It’s not predictive but can help identify past patterns and significant price points that could influence future movements. The Zig Zag lines can highlight swing highs and lows, providing a clearer view of the market’s direction.
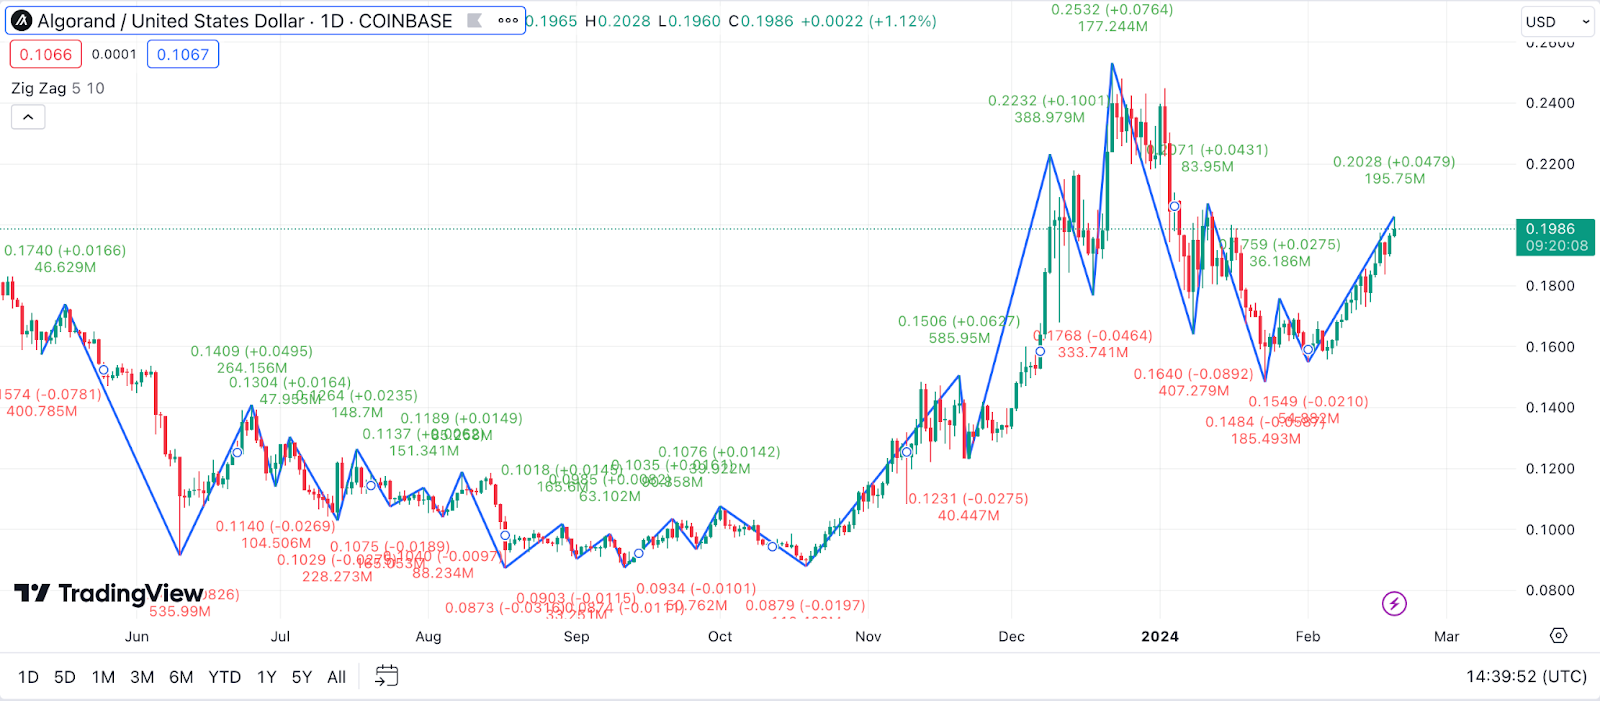
Example: By applying the Zig Zag indicator to ALGO’s chart, you can more easily identify major resistance and support levels where past reversals have occurred. If ALGO’s price approaches a previous Zig Zag high, it might act as resistance; similarly, a previous low could serve as support, offering strategic points for entry or exit.
Detrended Price Oscillator (DPO) for Algorand Price Prediction
The Detrended Price Oscillator (DPO) is a tool designed to remove the long-term trend from ALGO’s price, helping to identify cycles and short-term swings. It shifts the price forward or backward in time to eliminate the trend and focus on price peaks and troughs. This can be particularly useful for spotting overbought or oversold conditions within a cycle.
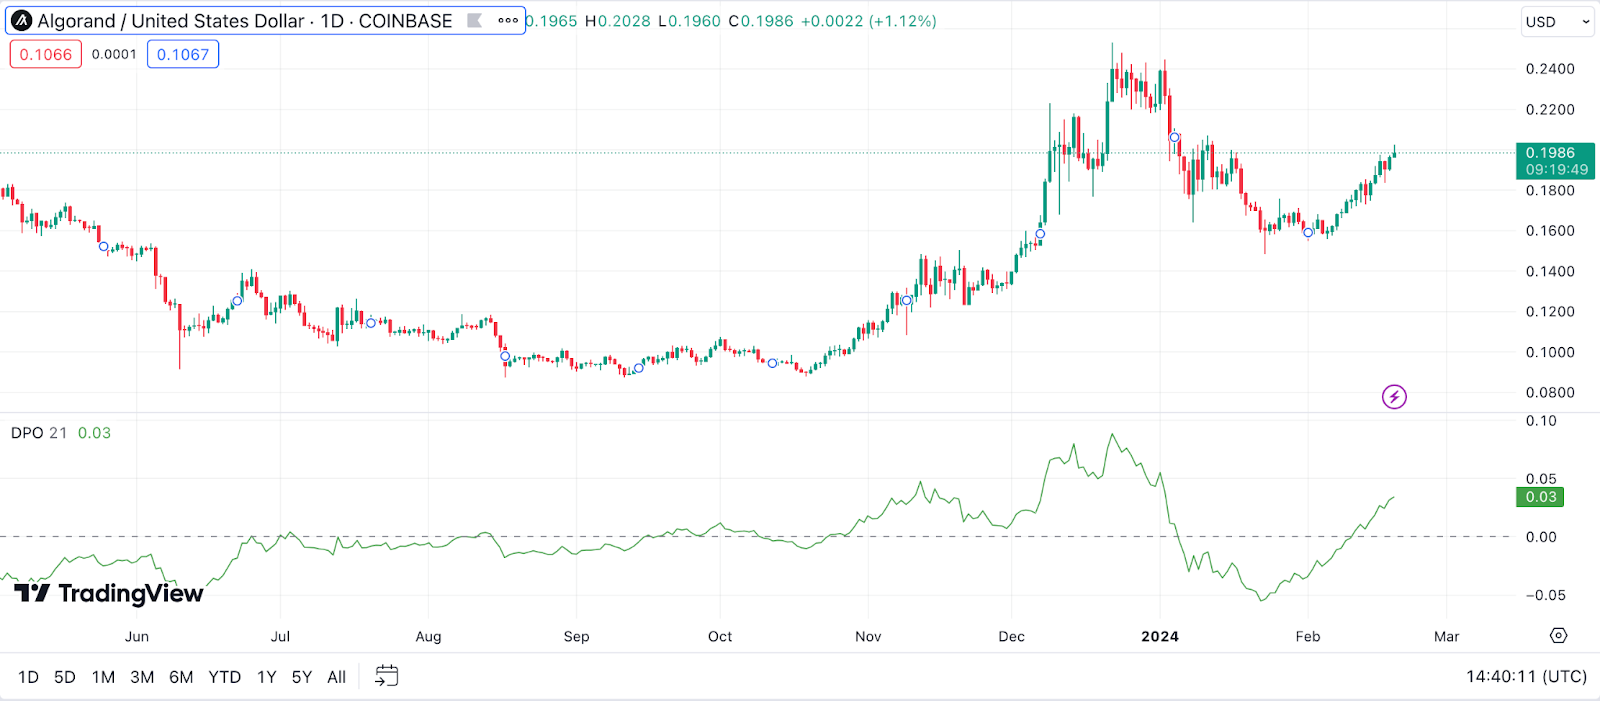
Example: If ALGO’s DPO shows a peak, it might indicate that the price is at a short-term high within its cycle, suggesting a potential pullback. Conversely, a trough in the DPO could signal a short-term low, possibly presenting a buying opportunity before the next upswing.
Vortex Indicator (VI) for Algorand Price Prediction
The Vortex Indicator (VI) is designed to identify the start of a new trend or the continuation of an existing trend within ALGO’s price movements. It consists of two lines: VI+ (positive) indicating upward trend strength and VI- (negative) indicating downward trend strength. A crossover of these lines can signal a change in trend direction.
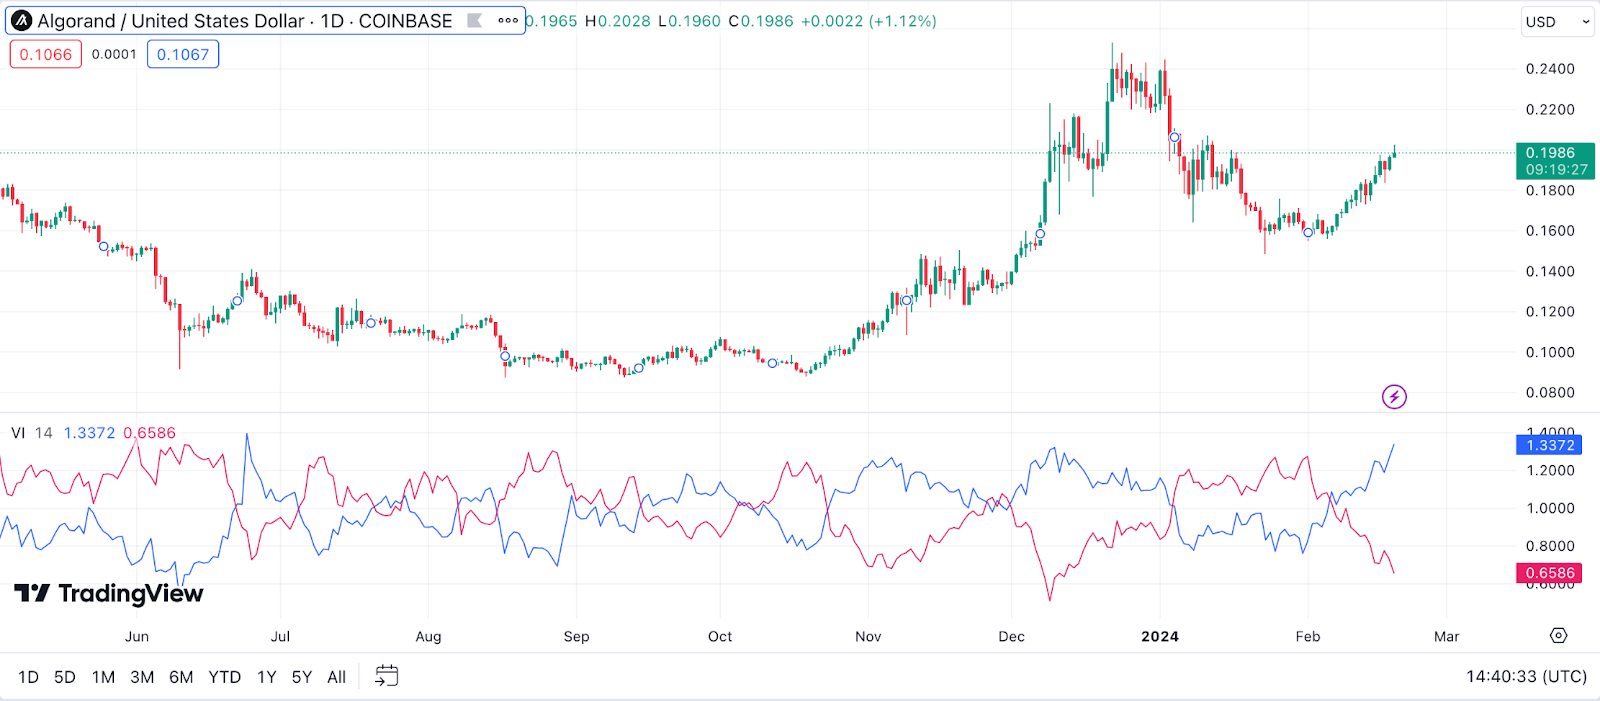
Example: When ALGO’s VI+ crosses above the VI-, it’s often taken as a sign that bullish forces are gaining the upper hand, potentially signaling the start of an upward trend. On the other hand, a cross of the VI- above the VI+ might indicate that bearish pressures are dominant, possibly heralding a downtrend.
Elder’s Force Index (EFI) for Algorand Price Prediction
Elder’s Force Index (EFI) combines price movements, direction, and volume to measure the ‘force’ behind ALGO’s price movements. A positive EFI generally indicates buying pressure, while a negative EFI suggests selling pressure. This indicator can help confirm trend strength and potential reversals when used in conjunction with other analysis tools.
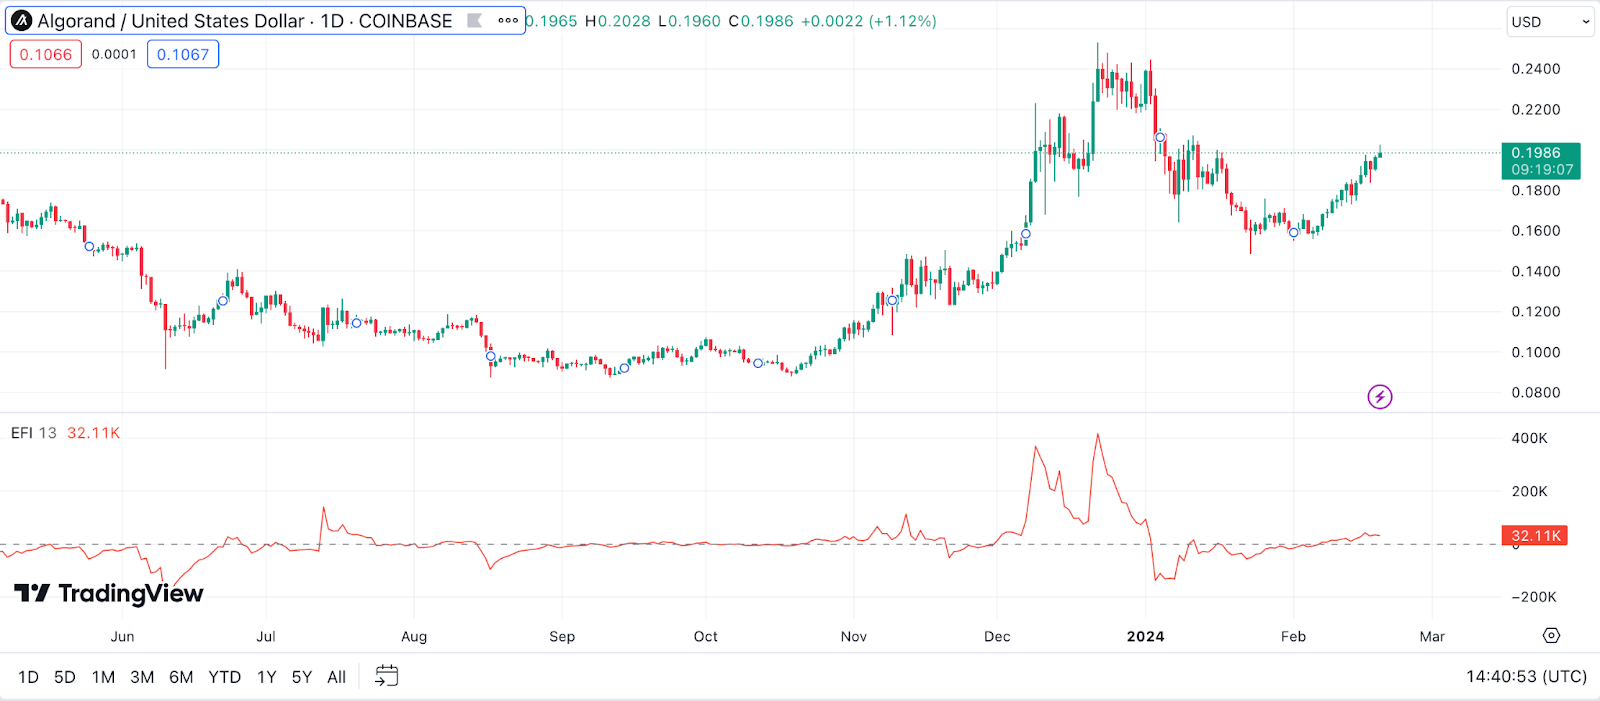
Example: A rising EFI in conjunction with an uptrend in ALGO’s price might reinforce the strength of the bullish trend, suggesting it could have the momentum to continue. Conversely, a falling EFI during a price decline could confirm the bearish trend’s strength, signaling that the downtrend may persist for a while longer.
Williams %R for Algorand Price Prediction
The Williams %R, also known as the Williams Percent Range, is a momentum indicator that measures overbought and oversold levels for ALGO, similar to the Stochastic Oscillator. It moves between 0 and -100, where readings above -20 typically indicate overbought conditions and readings below -80 suggest oversold conditions.
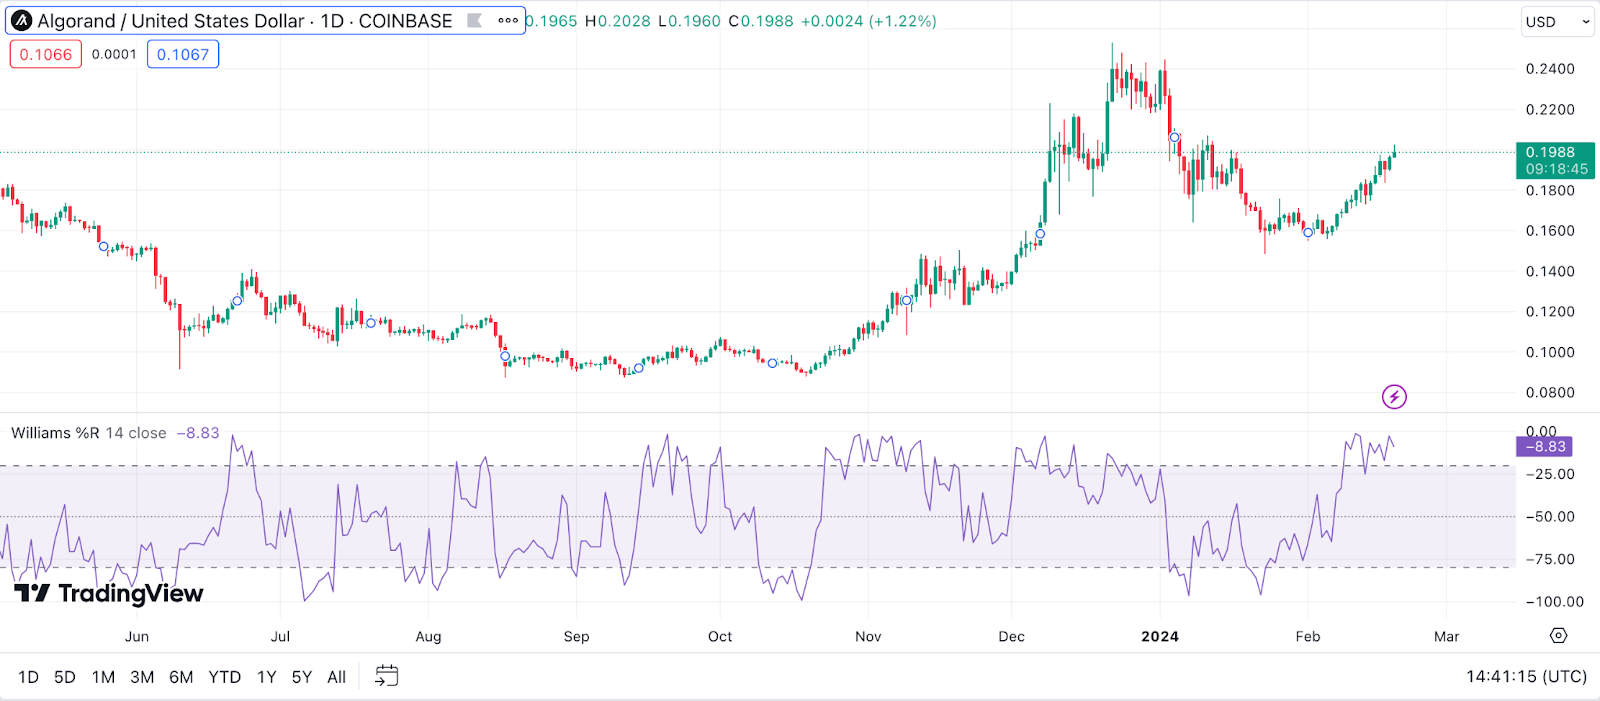
Example: If ALGO’s Williams %R value climbs above -20, it might be hinting that ALGO is currently overbought, suggesting that a price correction or reversal could be imminent. Conversely, a drop below -80 could indicate that ALGO is oversold, potentially setting the stage for a bullish reversal as buyers step in to capitalize on lower prices.
Combining Technical Indicators for Accurate Algorand Price Prediction
Diving into the world of ALGO price forecasting can feel like piecing together a complex puzzle. Each technical indicator shines a light on a different aspect of the market, but relying on just one is like trying to navigate a dark room with a single candle. That’s why I’m a big advocate for using a blend of indicators. It’s like gathering a diverse group of experts, each offering their unique insights to paint a fuller picture of what’s really going on with Algorand’s price movements.
The Importance of Using Multiple Technical Indicators
Imagine you’re at the helm of a ship, navigating through foggy waters. Using multiple technical indicators is akin to employing various navigation tools to ensure you don’t veer off course. Just like a seasoned captain who wouldn’t rely solely on a compass, a smart trader combines different indicators to avoid the pitfalls of misleading signals or anomalies. This approach helps in distinguishing the false alarms from the genuine trends, ensuring you’re not making moves based on partial or skewed information.
How to Combine Various Indicators for a Comprehensive Analysis
When it comes to weaving together different indicators for a well-rounded analysis of ALGO, here are some tips to keep in your toolkit:
- Balance Trend and Momentum Indicators: Pairing trend indicators like Moving Averages with momentum tools like the RSI can help confirm the strength and direction of a trend, giving you more confidence in your reading of the market.
- Use Volume for Confirmation: Volume indicators such as OBV or CMF can serve as a reality check for price movements, ensuring that trends are backed by actual trading activity.
- Diversify Timeframes: Analyzing indicators across different timeframes can offer insights into both short-term fluctuations and long-term trends, helping you make more informed investment decisions.
- Look for Convergences and Divergences: Pay attention to when different indicators point to the same conclusion (convergence) or when they tell conflicting stories (divergence). These signals can be powerful indicators of potential market moves.
- Practice and Patience: Combining indicators effectively comes with experience. Start with a few basic tools, and gradually introduce more complexity as you become comfortable with the analysis process.
Navigating the ALGO market using a combination of technical indicators is an art and a science. It’s about interpreting the signals, understanding the market context, and making informed investing decisions. Remember, no indicator is infallible, and the key to successful trading lies in continuous learning, adaptability, and a healthy dose of skepticism.
The Pillars of Algorand Prediction: Fundamental Factors
Peeling back the layers of Algorand’s future isn’t just about chart patterns and technical jargon. It’s equally about the bedrock factors that give ALGO its real-world clout. Let’s dive into the core elements that can sway Algorand’s trajectory, much like the undercurrents that steer a ship in the vast ocean.
Adoption Rate
When it comes to understanding ALGO’s potential, the rate at which it’s being picked up and used is a telltale sign. It’s like watching a new trend catch fire – the more it spreads, the bigger the impact. Here’s a deeper dive into the metrics and signs that can help you gauge Algorand’s adoption:
- Partnership Announcements: Each new partnership is a vote of confidence in ALGO. Keep an eye out for collaborations with industry giants or innovative startups, as these can significantly enhance its utility and visibility.
- Network Growth: The more the merrier, right? A steady increase in the number of transactions and active wallets on the Algorand network signals a growing user base and, by extension, rising adoption.
- Developer Activity: Developers are the backbone of any blockchain ecosystem. An uptick in the number of projects being built on Algorand, or an increase in developer engagements and contributions, can be a bullish sign.
- Mainstream Integration: When big-name retailers or financial platforms start accepting or integrating ALGO, it’s not just a win; it’s a leap towards mass adoption. This can vastly improve liquidity and public perception of Algorand.
- Community Engagement: The enthusiasm and activity level of the Algorand community can be a mirror reflecting the blockchain’s health and adoption rate. Active forums, social media discussions, and community-driven projects are green flags.
- Educational Initiatives: Efforts by the Algorand Foundation or the community to educate the public and developers about Algorand can fuel adoption. Workshops, webinars, and hackathons are breeding grounds for innovation and user engagement.
Tracking these indicators can give you a clearer picture of Algorand’s adoption curve. It’s like piecing together a puzzle; the more pieces you have, the clearer the image becomes. Keep in mind, adoption doesn’t happen overnight, but by keeping a finger on the pulse, you can better anticipate where ALGO is headed.
Regulatory Developments
The regulatory landscape for cryptocurrencies is as dynamic as the technology itself, and ALGO is no exception. Navigating through regulatory waters can be tricky, but staying informed about changes and developments is crucial for predicting ALGO’s future trajectory. Here’s a deeper look into how regulatory developments can shape ALGO’s journey:
- Global Regulatory Trends: As countries around the world sculpt their crypto regulatory frameworks, any positive or negative shifts can have ripple effects on ALGO. For instance, a major economy embracing crypto-friendly policies could boost ALGO’s adoption and price, while stringent regulations could pose challenges.
- Compliance Milestones: When Algorand meets significant compliance milestones or receives certifications, it not only broadens its appeal to institutional investors but also solidifies its standing in the crypto space. These achievements can act as strong indicators of ALGO’s long-term viability.
- Central Bank Digital Currency (CBDC) Initiatives: Algorand’s involvement in or association with CBDC projects can be a game-changer. As central banks explore blockchain solutions, Algorand’s technology being chosen or endorsed for such initiatives could significantly impact its price and adoption.
- Decentralized Finance (DeFi) Regulations: Given Algorand’s potential in the DeFi space, any regulatory developments affecting DeFi could directly influence ALGO’s ecosystem. Positive regulations can foster growth, while restrictive policies might slow down momentum.
- Intellectual Property and Patents: Keep an eye on any patents or intellectual property filings by the Algorand team. These can not only protect Algorand’s innovations but also potentially restrict competitors, providing a clearer path for ALGO’s growth in a crowded market.
Understanding the nuances of these regulatory developments can provide valuable insights into ALGO’s potential market movements. It’s akin to reading the weather before setting sail; knowing what conditions lie ahead can help you navigate more smoothly through the volatile seas of cryptocurrency.
Utility
Algorand’s real-world applications are a testament to its utility and a significant driver of its value. Beyond just a digital currency, ALGO’s underlying technology offers solutions to real-world problems across various industries. Here’s an expanded view on how Algorand’s utility is making waves:
- Financial Services and DeFi: ALGO is making significant strides in revolutionizing financial services, including DeFi. Its ability to provide fast, secure, and low-cost transactions makes it an attractive backbone for financial applications, from lending platforms to payment processing services.
- Government and Public Sector: Algorand’s blockchain is gaining traction for government use cases, including voting systems, public records, and identity verification, showcasing its ability to offer transparent, secure, and efficient solutions.
- Supply Chain Management: By leveraging Algorand’s blockchain, companies can achieve greater transparency and efficiency in their supply chains. This includes tracking the provenance of goods, ensuring authenticity, and optimizing logistics.
- Healthcare: In healthcare, Algorand can secure patient data, manage supply chains for medical supplies, and even streamline clinical trials, demonstrating the blockchain’s versatility and utility in sensitive and critical sectors.
- Cross-Border Payments: Algorand facilitates swift and cost-effective cross-border transactions, addressing the traditional banking system’s inefficiencies and high fees. This utility opens up new avenues for remittances and global trade.
- Tokenization of Assets: Algorand’s platform enables the tokenization of various assets, including real estate, art, and commodities, making it easier for individuals to invest in and trade these assets in a fractional, transparent, and secure manner.
The breadth of Algorand’s utility underscores its potential for widespread adoption and its role in the broader blockchain ecosystem. As more real-world applications of ALGO come to light, its value proposition becomes even clearer, highlighting the importance of utility in assessing its long-term prospects.
Market Sentiment: How ALGO News Prediction Works
The pulse of the market often beats to the rhythm of news and public sentiment, especially in the fast-paced world of cryptocurrencies like ALGO. Deciphering this pulse can give traders and investors a keen edge. Here’s a deeper exploration into understanding and leveraging market sentiment for ALGO:
- News Aggregation Platforms: Keeping tabs on multiple news sources can be overwhelming. News aggregators that specialize in crypto can provide a curated feed of relevant news, helping you stay informed without the noise. These platforms can highlight emerging trends or concerns specifically related to ALGO, offering insights into potential market movements.
- Social Media Analysis: Platforms like Twitter, Reddit, and crypto-specific forums are hotbeds of discussion and can serve as leading indicators of sentiment shifts. Advanced tools that analyze social media sentiment can quantify the mood, offering a more objective view of how the community feels about ALGO at any given moment.
- Influencer Opinions: Voices with significant followings can sway market sentiment dramatically. Monitoring what key influencers say about ALGO can sometimes precede shifts in market dynamics, offering clues to upcoming trends.
- Sentiment Analysis Tools: Leveraging AI and machine learning, these tools digest vast amounts of data from news articles, social media posts, and other sources to gauge the market’s sentiment towards ALGO. This high-level overview can be invaluable for understanding the general mood and making more informed decisions.
- Trading Volume and Price Action: Sometimes, the market sentiment is best reflected in the trading activity itself. A sudden spike in trading volume, coupled with significant price movements, can indicate a shift in sentiment even before it becomes apparent in news and social media.
By synthesizing information from these various sources, you can get a comprehensive view of the market sentiment surrounding ALGO. It’s like putting together a mosaic where each piece contributes to the overall picture. Understanding market sentiment isn’t just about keeping up with the news; it’s about reading between the lines and sensing the undercurrents that move the ALGO market.
The Bottom Line: Making Your Own Algorand Price Predictions
As we wrap up our journey through the twists and turns of Algorand price prediction, it’s clear that this isn’t a path to tread lightly. We’ve sifted through expert opinions, delved deep into the technical analysis charts, and even unpacked the fundamental factors that underpin ALGO’s value.
This multi-angled approach is akin to assembling a complex puzzle, where each piece – be it an expert’s insight, a trend line on a chart, or a key adoption metric – contributes to the bigger picture. Remember, in the ever-shifting sands of the crypto world, staying informed, adaptable, and critically minded is your compass. Here’s to navigating the ALGO waters with a keen eye and a steady hand.
FAQ
When Will ALGO Go Up?
Predicting the exact moment ALGO will ascend is like trying to guess the next raindrop’s landing spot during a storm. Market dynamics, investor sentiment, and global economic factors all play their part. What’s key is keeping an eye on market trends, news, and those fundamental and technical indicators we chatted about. They won’t hand you a crystal ball, but they’ll certainly help sharpen your instincts.
Should I Buy ALGO?
Deciding to buy ALGO is a personal choice, much like picking out a new adventure novel. Consider your risk appetite, investment horizon, and how ALGO fits into your broader portfolio. It’s not just about the potential for high returns; it’s about understanding the ride you’re signing up for and whether you’re comfortable with the ups and downs.
How High Can ALGO Go?
Envisioning ALGO’s peak is a bit like daydreaming about the ultimate vacation spot – it’s enticing but fraught with ‘what ifs.’ Historical performance, market adoption, and the evolving landscape of blockchain technology can offer clues. However, remember that the crypto world is notorious for its volatility; peaks can be followed by valleys.
Will ALGO Crash Again in 2024?
The question of whether ALGO will face another downturn is akin to wondering if a storm is on the horizon during a sailing expedition. The truth is, the crypto market is known for its turbulence. While we can speculate based on patterns and projections, it’s crucial to prepare for all weather, ensuring your investment strategy can withstand a few squalls.