Hello there, fellow financial adventurers! Welcome to this thrilling ride into the world of cryptocurrency, specifically focusing on Ripple (XRP) price predictions spanning from 2024 to 2030. As we all know, making predictions about crypto prices is a tad bit tricky, like trying to predict the weather a month in advance. However, we’re up to the task and in this article, we’ll be dissecting Ripple’s history, its essence, as well as the various strategies and tools employed by those brave souls who try to forecast the unpredictable price of XRP.
Now, some of you might be wondering, why bother? Why delve into the difficult task of predicting XRP’s price? Well, the answer lies in the potential of cryptocurrencies. Anticipating the value of XRP is like having a crystal ball that provides insight into good investment opportunities. It’s about trying to understand the possible trajectories of this innovative and disruptive technology. If you’re an investor or just crypto-curious, knowing where XRP might head could be the key that unlocks a trove of financial opportunities.
Of course, we can’t forget the elephant in the room – the inherent risk and uncertainty. That’s where expert opinions come in. We’ll dive into a sea of insights and analysis, where finance gurus and crypto pundits give their take on the future of XRP. Because in the world of cryptocurrencies, a well-informed decision is often the difference between a big win and a serious loss.
So are you ready to jump in? We’ve got a lot to cover and plenty of information to digest. There’s a wealth of knowledge waiting to be unveiled, and it’s all just a scroll away. So let’s delve deeper into this exciting journey and unlock Ripple price forecasts. After all, the future waits for no one. Read on, my fellow financial explorers, the adventure begins here!
Ripple (XRP) Overview
| XRP Price | $2.22 |
| XRP Price Change 24h | -1.89% |
| XRP Price Change 7d | 1.78% |
| XRP Market Cap | $130,999,781,706.09 |
| XRP Circulating Supply | 59,068,187,926.00 |
| XRP Trading Volume | $2,060,661,223.64 |
| XRP All-Time High (ATH) | $3.8419 |
| XRP All-Time Low (ATL) | $0.002802 |
A Brief History: Ripple and Its Purpose
Let’s take a moment to pull back the curtains and get a glimpse into Ripple’s vibrant past and the purpose it serves. Ripple, or XRP, was born out of a vision to revolutionize the banking industry. Conceived by Chris Larsen and Jed McCaleb in 2012, this digital asset was designed to act as both a cryptocurrency and a technology protocol for fast, low-cost international money transfers. Picture it as a kind of digital courier, zipping your money across borders faster than you can blink, and for a fraction of the usual cost.
It’s the Ripple protocol, that magic sauce behind the scenes, which allows this to happen. By enabling direct transfers between parties in any currency, it essentially cuts out the middleman, thus slashing the cost and time typically involved in these transactions. The result? A streamlined, efficient, and quick transfer system that banks and financial organisations around the world have come to value.
Now, Ripple’s journey hasn’t been all smooth sailing. No story worth telling ever is. So, let’s have a look at some of Ripple’s key price milestones. Brace yourself, because just like any thrilling rollercoaster ride, there have been some breathtaking highs and heart-stopping lows:
- Late 2013: XRP coin experienced its first significant surge, moving from a mere $0.005 to $0.057.
- May 2017: Ripple underwent an exponential growth, reaching a price of $0.34.
- January 2018: In a stunning peak, XRP coin hit an all-time high of $3.84.
- Throughout 2020: Ripple faced a tough year with a lawsuit from the SEC causing its price to plummet.
With such a history, it’s no wonder why we are all fascinated with the Ripple price prediction. It’s like watching a blockbuster movie, you’re always on the edge of your seat, never really knowing what’s going to happen next. So, let’s delve deeper, together, and see what the future might hold for Ripple. Remember, knowledge is power and in this case, it just might also be profit.
Ripple – XRP Price Prediction For Today, Tomorrow, This Week, and Next 30 Days
| Date | Price | Change |
|---|---|---|
| July 06, 2025 | 2.22 | -0.08% |
| July 07, 2025 | 2.23 | 0.60% |
| July 08, 2025 | 2.22 | -0.39% |
| July 09, 2025 | 2.24 | 0.74% |
| July 10, 2025 | 2.24 | 0.25% |
| July 11, 2025 | 2.25 | 0.10% |
| July 12, 2025 | 2.23 | -0.80% |
| July 13, 2025 | 2.22 | -0.39% |
| July 14, 2025 | 2.24 | 0.94% |
| July 15, 2025 | 2.25 | 0.22% |
| July 16, 2025 | 2.27 | 0.89% |
| July 17, 2025 | 2.28 | 0.58% |
| July 18, 2025 | 2.29 | 0.51% |
| July 19, 2025 | 2.28 | -0.64% |
| July 20, 2025 | 2.30 | 0.88% |
| July 21, 2025 | 2.27 | -0.97% |
| July 22, 2025 | 2.29 | 0.78% |
| July 23, 2025 | 2.30 | 0.36% |
| July 24, 2025 | 2.28 | -0.80% |
| July 25, 2025 | 2.27 | -0.64% |
| July 26, 2025 | 2.27 | 0.12% |
| July 27, 2025 | 2.26 | -0.61% |
| July 28, 2025 | 2.26 | 0.15% |
| July 29, 2025 | 2.25 | -0.31% |
| July 30, 2025 | 2.24 | -0.47% |
| July 31, 2025 | 2.24 | -0.10% |
| August 01, 2025 | 2.22 | -0.92% |
| August 02, 2025 | 2.22 | -0.05% |
| August 03, 2025 | 2.20 | -0.98% |
| August 04, 2025 | 2.21 | 0.49% |
Ripple (XRP) Price Prediction 2024
After analyzing Ripple (XRP) price prediction 2024, we found that the projected minimum price is $2.00, while the average and maximum prices are $2.33 and $2.66, respectively.
Our assessment of future returns based on this data suggests that Ripple’s outlook for 2024 is relatively stable, with moderate growth expected.
The narrow price range implies that the market may not anticipate significant fluctuations in value, but there is still potential for substantial returns for those willing to take on high risks associated with investing in Ripple.
Nonetheless, cryptocurrency investors must be cautious and carry out thorough research before making any investment decisions in this space due to the historical volatility of cryptocurrencies and the continuously evolving market landscape.
| Month | Minimum Price | Average Price | Maximum Price |
|---|---|---|---|
| February 2024 | 0.5632 | 0.5849 | 0.6089 |
| March 2024 | 0.5784 | 0.6007 | 0.6253 |
| April 2024 | 0.5941 | 0.6169 | 0.6422 |
| May 2024 | 0.6101 | 0.6335 | 0.6595 |
| June 2024 | 0.6266 | 0.6506 | 0.6773 |
| July 2024 | 0.6435 | 0.6682 | 0.6956 |
| August 2024 | 0.6609 | 0.6863 | 0.7144 |
| September 2024 | 0.6787 | 0.7048 | 0.7337 |
| October 2024 | 0.6970 | 0.7238 | 0.7535 |
| November 2024 | 0.7159 | 0.7434 | 0.7738 |
| December 2024 | 0.7352 | 0.7634 | 0.7947 |
| January 2025 | 0.7550 | 0.7840 | 0.8162 |
January 2024: Ripple Price Forecast
Crypto analysts have checked the price fluctuations of Ripple in 2024, and the outlook for January shows significant promise. The minimum price is expected to be $0.5362, reflecting a stable base. On average, the Ripple price could hover around $0.5643, suggesting a moderate bullish trend. The maximum price might reach up to $0.5889, indicating potential spikes in investor interest and market activity.
XRP Price Forecast for February 2024
According to the technical analysis of Ripple prices expected in February, there’s an anticipated upward trajectory. We predict a minimum price of $0.5632, indicating a steady rise from January. The average price is projected to be around $0.5849, showcasing consistent growth. The maximum price could soar to approximately $0.6089, suggesting an optimistic market outlook and heightened trading activity.
March 2024: Ripple Price Forecast
In the world of cryptocurrency, March 2024 appears to be a promising month for Ripple. Our experts anticipate a minimum price of $0.5784, signifying a continued upward trend. The average price is likely to be about $0.6007, reflecting steady growth. Furthermore, the maximum price could reach an impressive $0.6253, possibly driven by increased adoption and investor confidence.
XRP Price Forecast for April 2024
Delving into April’s Ripple price prediction, we foresee a continuation of the growth trend. The minimum price is expected to be $0.5941, showcasing a resilient market. On average, Ripple might trade at $0.6169, hinting at sustained investor interest. The maximum price could potentially climb to $0.6422, indicating a bullish sentiment among traders.
May 2024: Ripple Price Forecast
As summer approaches, May 2024 holds positive prospects for Ripple. We project a minimum price of $0.6101, maintaining the growth trajectory. The average price could be around $0.6335, suggesting a robust market. We might see the maximum price reaching up to $0.6595, driven by optimistic market conditions and increased trading volumes.
XRP Price Forecast for June 2024
Halfway through 2024, Ripple’s price trend remains strong. For June, the minimum price is foreseen at $0.6266, reflecting steady growth. The average price might settle at $0.6506, indicating a bullish market. A maximum price of $0.6773 could be reached, possibly due to heightened investor interest and positive market dynamics.
July 2024: Ripple Price Forecast
In July 2024, Ripple’s market outlook appears optimistic. We predict a minimum price of $0.6435, signifying sustained growth. The average price is expected to be around $0.6682, showing a healthy market trend. The maximum price could hit $0.6956, potentially influenced by favorable market conditions and investor optimism.
XRP Price Forecast for August 2024
Heading into the latter part of 2024, August presents a bullish scenario for Ripple. Our analysis suggests a minimum price of $0.6609, indicating continuous growth. The average price is likely to be about $0.6863, reflecting a strong market. We anticipate the maximum price reaching around $0.7144, driven by positive trading sentiment and market factors.
September 2024: Ripple Price Forecast
As we enter autumn, September 2024 shows no sign of slowing for Ripple. The minimum price is expected at $0.6787, continuing the upward trend. The average price could be approximately $0.7048, suggesting a stable and growing market. A maximum price of $0.7337 might be reached, possibly due to increased institutional interest and market momentum.
XRP Price Forecast for October 2024
In October 2024, Ripple’s market dynamics look promising. We forecast a minimum price of $0.6970, indicating consistent growth. The average price is projected to be around $0.7238, showcasing a healthy market condition. The maximum price could surge to $0.7535, potentially influenced by strategic partnerships and broader market trends.
November 2024: Ripple Price Forecast
November 2024 brings continued optimism for Ripple. The minimum price is expected to be $0.7159, showing a steady upward movement. The average price might hover at $0.7434, indicating a robust market. We anticipate the maximum price reaching $0.7738, possibly driven by increasing global adoption and investor confidence.
XRP Price Forecast for December 2024
Concluding the year, December 2024 looks bright for Ripple. The minimum price is predicted at $0.7352, reflecting a year of consistent growth. The average price is likely to be around $0.7634, suggesting a strong close to the year. The maximum price could peak at $0.7947, potentially due to year-end investment surges and positive market sentiment.
Ripple Price Prediction 2025
In the wake of 2025, our team’s XRP price prediction holds a subtle but noteworthy uptick. Based on their analysis, the minimum price is expected to hover around $0.79, while the average price of XRP could hit $0.94. On the brighter side, we might see a high touching $1.12. Looks like Ripple could be gathering momentum!
| Month | Minimum Price | Average Price | Maximum Price |
|---|---|---|---|
| February 2025 | 0.7912 | 0.8216 | 0.8553 |
| March 2025 | 0.8126 | 0.8438 | 0.8784 |
| April 2025 | 0.8345 | 0.8666 | 0.9021 |
| May 2025 | 0.8570 | 0.8900 | 0.9265 |
| June 2025 | 0.8802 | 0.9140 | 0.9515 |
| July 2025 | 0.9039 | 0.9387 | 0.9772 |
| August 2025 | 0.9283 | 0.9640 | 1.0035 |
| September 2025 | 0.9534 | 0.9900 | 1.0306 |
| October 2025 | 0.9792 | 1.0168 | 1.0585 |
| November 2025 | 1.0056 | 1.0442 | 1.0870 |
| December 2025 | 1.0327 | 1.0724 | 1.1164 |
| January 2026 | 1.0606 | 1.1014 | 1.1465 |
Ripple Price Prediction 2026
As we journey into 2026, Ripple seems to be keeping up its steady climb. Our crystal ball of XRP price prediction predicts a floor of $1.05, an average price of XRP comfortably at $1.24, and an exciting maximum price at $1.48. Ripple’s stability continues to be its cornerstone.
| Month | Minimum Price | Average Price | Maximum Price |
|---|---|---|---|
| February 2026 | 1.0483 | 1.0886 | 1.1333 |
| March 2026 | 1.0766 | 1.1180 | 1.1639 |
| April 2026 | 1.1057 | 1.1482 | 1.1953 |
| May 2026 | 1.1356 | 1.1792 | 1.2275 |
| June 2026 | 1.1662 | 1.2110 | 1.2607 |
| July 2026 | 1.1977 | 1.2437 | 1.2947 |
| August 2026 | 1.2301 | 1.2773 | 1.3297 |
| September 2026 | 1.2633 | 1.3118 | 1.3656 |
| October 2026 | 1.2974 | 1.3472 | 1.4025 |
| November 2026 | 1.3324 | 1.3836 | 1.4403 |
| December 2026 | 1.3684 | 1.4210 | 1.4792 |
| January 2027 | 1.4053 | 1.4593 | 1.5192 |
Ripple Price Prediction 2027
Moving into 2027, the tale of Ripple appears to be one of consistent growth. Our experts foresee a minimum price of $1.39, an average price of XRP around $1.65, and a potential maximum level of $1.97. The Ripple wave continues its predictable surge.
| Month | Minimum Price | Average Price | Maximum Price |
|---|---|---|---|
| February 2027 | 1.3945 | 1.4481 | 1.5074 |
| March 2027 | 1.4321 | 1.4872 | 1.5481 |
| April 2027 | 1.4708 | 1.5273 | 1.5899 |
| May 2027 | 1.5105 | 1.5686 | 1.6329 |
| June 2027 | 1.5513 | 1.6109 | 1.6770 |
| July 2027 | 1.5932 | 1.6544 | 1.7222 |
| August 2027 | 1.6362 | 1.6991 | 1.7687 |
| September 2027 | 1.6804 | 1.7449 | 1.8165 |
| October 2027 | 1.7258 | 1.7921 | 1.8655 |
| November 2027 | 1.7724 | 1.8404 | 1.9159 |
| December 2027 | 1.8202 | 1.8901 | 1.9676 |
| January 2028 | 1.8694 | 1.9412 | 2.0208 |
Ripple Price Prediction 2028
Cruising into 2028, the numbers are still in Ripple’s favor. We predict a base price of $1.85, a typical average price of $2.19, and a high possibly reaching $2.61. The Ripple effect is still very much in play.
| Month | Minimum Price | Average Price | Maximum Price |
|---|---|---|---|
| February 2028 | 1.8494 | 1.9205 | 1.9992 |
| March 2028 | 1.8994 | 1.9723 | 2.0532 |
| April 2028 | 1.9506 | 2.0256 | 2.1086 |
| May 2028 | 2.0033 | 2.0803 | 2.1656 |
| June 2028 | 2.0574 | 2.1365 | 2.2241 |
| July 2028 | 2.1130 | 2.1941 | 2.2841 |
| August 2028 | 2.1700 | 2.2534 | 2.3458 |
| September 2028 | 2.2286 | 2.3142 | 2.4091 |
| October 2028 | 2.2888 | 2.3767 | 2.4742 |
| November 2028 | 2.3506 | 2.4409 | 2.5410 |
| December 2028 | 2.4140 | 2.5068 | 2.6096 |
| January 2029 | 2.4792 | 2.5745 | 2.6800 |
Ripple Price Prediction 2029
As 2029 rolls in, XRP price prediction seems to be on an unwavering upward journey. Our seasoned analysts point to a similar trend: a minimum of $2.45, an average price of $2.91, and the chance of peaking at $3.46. Ripple’s journey towards the future looks exciting.
| Month | Minimum Price | Average Price | Maximum Price |
|---|---|---|---|
| February 2029 | 2.4527 | 2.5470 | 2.6514 |
| March 2029 | 2.5189 | 2.6157 | 2.7230 |
| April 2029 | 2.5870 | 2.6864 | 2.7965 |
| May 2029 | 2.6568 | 2.7589 | 2.8720 |
| June 2029 | 2.7285 | 2.8334 | 2.9495 |
| July 2029 | 2.8022 | 2.9099 | 3.0292 |
| August 2029 | 2.8779 | 2.9884 | 3.1110 |
| September 2029 | 2.9556 | 3.0691 | 3.1950 |
| October 2029 | 3.0354 | 3.1520 | 3.2812 |
| November 2029 | 3.1173 | 3.2371 | 3.3698 |
| December 2029 | 3.2015 | 3.3245 | 3.4608 |
| January 2030 | 3.2879 | 3.4143 | 3.5542 |
Ripple Price Prediction 2030
Stepping into the new decade, 2030 holds promise for XRP price prediction. Our predictions indicate a low of $3.25, a steadfast average price of $3.86, and a maximum price soaring to $4.59. The decade starts on a high note for Ripple!
| Month | Minimum Price | Average Price | Maximum Price |
|---|---|---|---|
| February 2030 | 3.2538 | 3.3788 | 3.5174 |
| March 2030 | 3.3417 | 3.4701 | 3.6123 |
| April 2030 | 3.4319 | 3.5637 | 3.7099 |
| May 2030 | 3.5246 | 3.6600 | 3.8100 |
| June 2030 | 3.6197 | 3.7588 | 3.9129 |
| July 2030 | 3.7174 | 3.8603 | 4.0185 |
| August 2030 | 3.8178 | 3.9645 | 4.1271 |
| September 2030 | 3.9209 | 4.0715 | 4.2385 |
| October 2030 | 4.0268 | 4.1815 | 4.3529 |
| November 2030 | 4.1355 | 4.2944 | 4.4704 |
| December 2030 | 4.2471 | 4.4103 | 4.5912 |
| January 2031 | 4.3618 | 4.5294 | 4.7151 |
Ripple (XRP) Price Prediction 2031
Moving on to 2031, Ripple’s performance stays consistent. We forecast a minimum of $4.31, a steady average price of $5.12, and a possible high reaching $6.08. Ripple appears to be maintaining its steady ascent.
| Month | Minimum Price | Average Price | Maximum Price |
|---|---|---|---|
| February 2031 | 4.3120 | 4.4777 | 4.6613 |
| March 2031 | 4.4285 | 4.5986 | 4.7872 |
| April 2031 | 4.5480 | 4.7228 | 4.9164 |
| May 2031 | 4.6708 | 4.8503 | 5.0492 |
| June 2031 | 4.7969 | 4.9813 | 5.1855 |
| July 2031 | 4.9265 | 5.1157 | 5.3255 |
| August 2031 | 5.0595 | 5.2539 | 5.4693 |
| September 2031 | 5.1961 | 5.3957 | 5.6170 |
| October 2031 | 5.3364 | 5.5414 | 5.7686 |
| November 2031 | 5.4805 | 5.6910 | 5.9244 |
| December 2031 | 5.6284 | 5.8447 | 6.0843 |
| January 2032 | 5.7804 | 6.0025 | 6.2486 |
Ripple Price Prediction 2032
Finally, we arrive at 2032. The consistency of Ripple remains unbroken, with predictions pointing to a minimum of $5.72, an average price of XRP around $6.78, and a potential high of $8.07. Ripple seems to be ending the year on a powerful note!
| Month | Minimum Price | Average Price | Maximum Price |
|---|---|---|---|
| February 2032 | 5.7164 | 5.9361 | 6.1794 |
| March 2032 | 5.8708 | 6.0963 | 6.3463 |
| April 2032 | 6.0293 | 6.2609 | 6.5176 |
| May 2032 | 6.1921 | 6.4300 | 6.6936 |
| June 2032 | 6.3593 | 6.6036 | 6.8743 |
| July 2032 | 6.5310 | 6.7819 | 7.0599 |
| August 2032 | 6.7073 | 6.9650 | 7.2506 |
| September 2032 | 6.8884 | 7.1531 | 7.4463 |
| October 2032 | 7.0744 | 7.3462 | 7.6474 |
| November 2032 | 7.2654 | 7.5445 | 7.8539 |
| December 2032 | 7.4615 | 7.7482 | 8.0659 |
| January 2033 | 7.6630 | 7.9574 | 8.2837 |
The Main Questions Of Critical Thinking When We Talk About Ripple Price Forecast
Below are three critical thinking questions to deepen your own research and understanding of the price of XRP and the other factors influencing it:
- How might Ripple’s underlying technology and partnerships influence its future price?
This question prompts you to think deeply about Ripple’s unique strengths and how they might contribute to its market value. Consider what Ripple’s technology offers that other cryptocurrencies do not, and how its partnerships might broaden its usability or acceptance, thus potentially driving up demand and price.
- How might changes in the global regulatory environment affect the price of Ripple?
This question encourages you to explore the wider context in which Ripple operates. Regulations can greatly impact a cryptocurrency’s success and value. Consider different scenarios, such as a crackdown or an embrace of cryptocurrencies by different countries, and how each might influence Ripple’s price.
- In what ways could investor sentiment and market trends shift Ripple’s price trajectory?
This question urges you to think about the psychological aspects of investing and market behavior. Even if Ripple’s fundamentals are strong, negative sentiment or a bearish market trend can drive its price down, while positive sentiment or a bullish trend can drive it up. How might these dynamics play out in the future?
Reflecting on these critical thinking questions can help you develop a deeper understanding of the complexities surrounding the future price of Ripple and the importance of considering various perspectives and factors in making smart investment decisions.
Ripple (XRP) Future Price Predictions by Experts
Great, let’s delve into the opinions and Ripple price forecasts of some industry experts and analysts regarding Ripple’s (XRP) future price and prospects. Remember, these are expert opinions and should not be taken as investment advice.
- WalletInvestor is one of the popular digital currency prediction websites that uses technical analysis for future price predictions. As per their Ripple price prediction, they believe that Ripple might not increase as much in 2024 as in 2021, but it’s going to be a steady growth nonetheless.
- CoinSwitch, a renowned cryptocurrency exchange, predicts that XRP might touch the $2 mark in 2024, considering the technological advancements and partnerships that Ripple may acquire. According to its XRP price prediction 2024, Ripple continues to develop at a rapid pace and has independent trading platforms and investment routes like Bitcoin and Ethereum, the coin will be able to touch the $2 mark by the end of 2024.
- Crypto Rating echoes the sentiments expressed by WalletInvestor, indicating a positive growth trend for Ripple in the coming years. They predict that Ripple price might reach $1.20 by the end of 2024, which is almost double its current price.
- Previsioni Bitcoin is also optimistic about Ripple’s future, stating that XRP tokens could reach $2.50 by the end of 2024.
- Cryptocurrency analysts at Investing Haven expect XRP to have a bullish future. They believe that as long as Ripple continues to develop its technology and expand its partnerships with financial organisations, XRP could reach the $10 mark in the coming years.
- FXStreet’s analysts have given a less bullish prediction but still see some potential growth. They believe that, provided the market condition remains stable, Ripple coin’s price might reach around $3 – $5 in the next few years.
- Brad Garlinghouse, the CEO of Ripple, has always been optimistic about Ripple’s future. He believes that the functionality of Ripple and its ability to assist in real-time, inexpensive money transfers gives it an edge over its competitors.

Brad Garlinghouse
- Mike Novogratz, a well-known name in the crypto sphere, stated that XRP’s price would underperform immensely in the bull market of 2020, which indeed happened. However, he hasn’t given any new predictions recently.

Mike Novogratz
- David Schwartz, Ripple’s CTO, suggested that banks could adopt blockchains, but he has also noted the obstacle of dealing with regulations could affect the price of XRP.
- Crypto Rand, a popular crypto analyst, has also predicted a bright future for Ripple. He suggests that if the current market conditions persist, we could see XRP’s price hitting new heights in the coming years.
- Mati Greenspan, the founder of Quantum Economics, believes Ripple’s numerous partnerships with banks could lead to significant price growth. However, he also highlights that Ripple’s decision to periodically sell significant amounts of XRP can suppress its price.
- Michael Arrington, the founder of Arrington XRP Capital, is a significant proponent of Ripple. He’s stated multiple times that XRP’s fast settlement times and low exchange commission fees make it an ideal cryptocurrency for bridging between other digital assets.
- Peter Brandt, a veteran trader, has made headlines with his digital coin price predictions on Ripple’s XRP before. While he was pessimistic about XRP’s price in 2020, his latest views on the cryptocurrency are currently unknown.
Decoding the Charts: XRP Technical Price Analysis
If you’ve ever been curious about the dizzying world of cryptocurrency charts, you’ve landed in the right place. In this section, we’ll be specifically diving into the technical analysis of XRP’s price, a popular digital asset that’s been making waves (pun intended) in the crypto space. But first, let’s familiarize ourselves with some key concepts and tools that we’ll be using in our analysis.
- Price charts: Technical analysts use various types of price charts, such as line charts, bar charts, and candlestick charts, to visualize historical price data and identify patterns or trends.
- Trend analysis: Identifying the overall trend is a critical aspect of technical analysis. Traders look for uptrends (a series of higher highs and higher lows) or downtrends (a series of lower highs and lower lows) to determine the market’s direction.
- Support and resistance levels: Support levels are price points where an asset’s price has historically had difficulty falling below, while resistance levels are points where the price has had difficulty rising above. These levels can help traders identify potential entry and exit points for trades.
- Technical indicators: Technical analysts use various matheADAal indicators to gain insights into market trends and momentum. Some common indicators include moving averages, (RSI), moving average convergence divergence (MACD), and Bollinger Bands.
- Chart patterns: Technical analysts look for specific chart patterns that may suggest XRP price movements. Examples of chart patterns include head and shoulders, double tops and bottoms, triangles, and flags.
- Volume analysis: Analyzing trade volume can provide insights into the strength or weakness of XRP price movements. High volume during a price increase can signal strong buying interest, while low volume during a price decline may indicate weak selling pressure.
- Timeframes: Technical analysts can apply their methods to various timeframes, from intraday charts to weekly or monthly charts, depending on their trading style and objectives.
Technical Indicators: Origin and Purpose
To fully appreciate the role of technical indicators, we need to delve a little into their origins. These markers can trace their lineage back to 18th century Japan, where the earliest form of technical analysis was used in rice trading. The Dojima Rice Exchange, founded in 1697, witnessed the birth of candlestick charts, which are still widely used today. Fast-forward a few centuries, and these rudimentary techniques have evolved into a sophisticated analytical system of patterns and indicators. Technical indicators are, in essence, statistical metrics used by traders to forecast future price fluctuations of an asset, such as Ripple’s (XRP) token.
The Role of Technical Indicators in Financial Markets
In contemporary financial markets, technical indicators are as vital to a trader as navigational tools are to a sailor. They serve as guideposts, shedding light on the seemingly unpredictable nature of market behavior. They help traders analyze market trends, identify good investment opportunities, and manage risks. The indicators are often used in conjunction with other analysis methods to support trading decisions.
For instance, a trader might use a simple moving average (SMA) to identify a developing uptrend or downtrend. Relative Strength Index (RSI) might be used to ascertain overbought or oversold conditions. Bollinger Bands can provide insights about the volatility of the market, while MACD (Moving Average Convergence Divergence) is commonly used to spot possible trend reversals. These tools, while appearing daunting initially, become a trader’s best friends with practice and understanding.
How Technical Indicators Can Help Predict Ripple’s Price
Now, bringing it back to our primary focus – Ripple’s (XRP) token. How do these indicators factor into predicting its price? Each technical indicator, with its unique formula, provides different insights about XRP’s price behavior. Let’s consider moving averages – they can indicate the overall trend of XRP’s price. Is it moving up, down, or sideways over a specific period?
Then there’s RSI, which can tell us if XRP is being overbought or oversold – useful information when trying to predict if a price correction is imminent. Fibonacci retracement levels can suggest potential support and resistance levels, thereby providing hints about the possible price targets. In essence, each indicator, when correctly applied, can lend a piece to the puzzle of where XRP’s price might be headed.
Just like a doctor uses various medical tests to diagnose a patient’s condition, a savvy trader uses these technical indicators to decode market trends and predict future price movements. It’s a fine blend of science and art, and once mastered, can be an invaluable toolset for trading not just Ripple’s XRP, but any financial asset.
Moving Averages (MAs) for XRP Price Prediction
Moving Averages (MAs) are utilized to identify trends by smoothing out price movements. In essence, an MA is the average price of an asset over a specific period. For instance, a 30-day MA is the average of the closing prices over the last 30 days. As Ripple’s (XRP) price changes, its moving average price either increases or decreases.

Example: If XRP token price crosses above its MA, it’s often seen as a bullish signal, suggesting upward price momentum. Conversely, if the price crosses below the MA, it could signal a downward price trend. For example, if XRP’s price is consistently above its 200-day MA, it may be in a long-term uptrend.
Relative Strength Index (RSI) – RSI XRP Prediction
The Relative Strength Index (RSI) is a momentum oscillator that gauges the speed and direction of price movements. It operates within a range of 0 to 100 and is typically used to identify overbought or oversold conditions in a market.

Example: If XRP’s price has had a series of rising closes, the RSI will approach 100, indicating overbought conditions, and potentially a price pullback. Conversely, a series of declining closes will send the RSI towards 0, indicating oversold conditions, and possibly a price bounce.
Moving Average Convergence Divergence (MACD) – MACD XRP Prediction
The Moving Average Convergence Divergence (MACD) measures the relationship between two moving averages (usually the 12-day and 26-day) of Ripple’s price. The MACD is calculated by subtracting the 26-day exponential moving average (EMA) from the 12-day EMA. A nine-day EMA of the MACD, called the ‘signal line,’ is plotted on top of the MACD line, which can function as a trigger for buy and sell signals.

Example: When the MACD line crosses above the signal line, it sends a bullish signal, suggesting it might be an opportune time to buy XRP. If the MACD line crosses below the signal line, it’s a bearish signal and might be an optimal time to sell.
Bollinger Bands for Ripple Price Prediction
Bollinger Bands incorporate a moving average with two standard deviation lines plotted at a specific distance from it. It creates a range of movement in which the price of an asset, such as XRP, typically moves. The upper and lower bands show the volatility of the price.
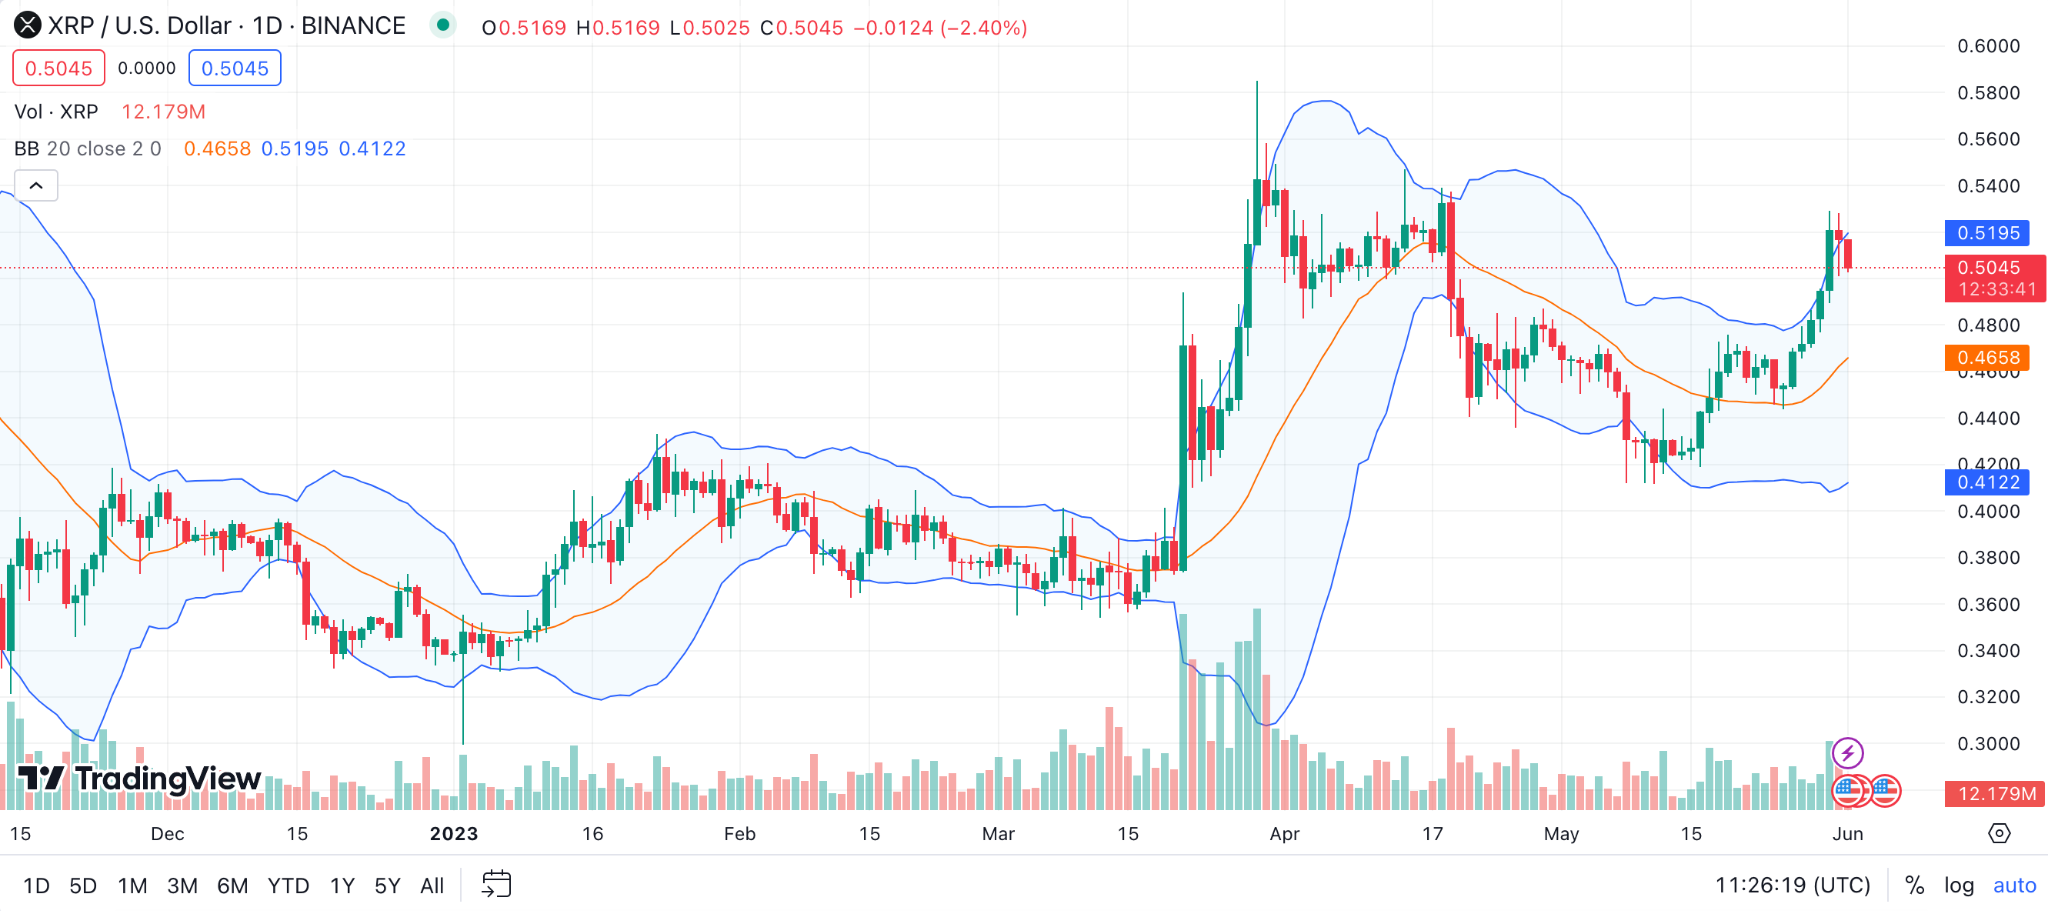
Example: When XRP cost touches the upper band, it could indicate that the asset is overbought and might revert. If the price reaches the lower band, XRP could be oversold and might bounce back.
Stochastic Oscillator for Ripple Price Prediction
The Stochastic Oscillator is a momentum indicator that demonstrates the location of XRP’s current price relative to its range over a selected period. It generates a value between 0 and 100.
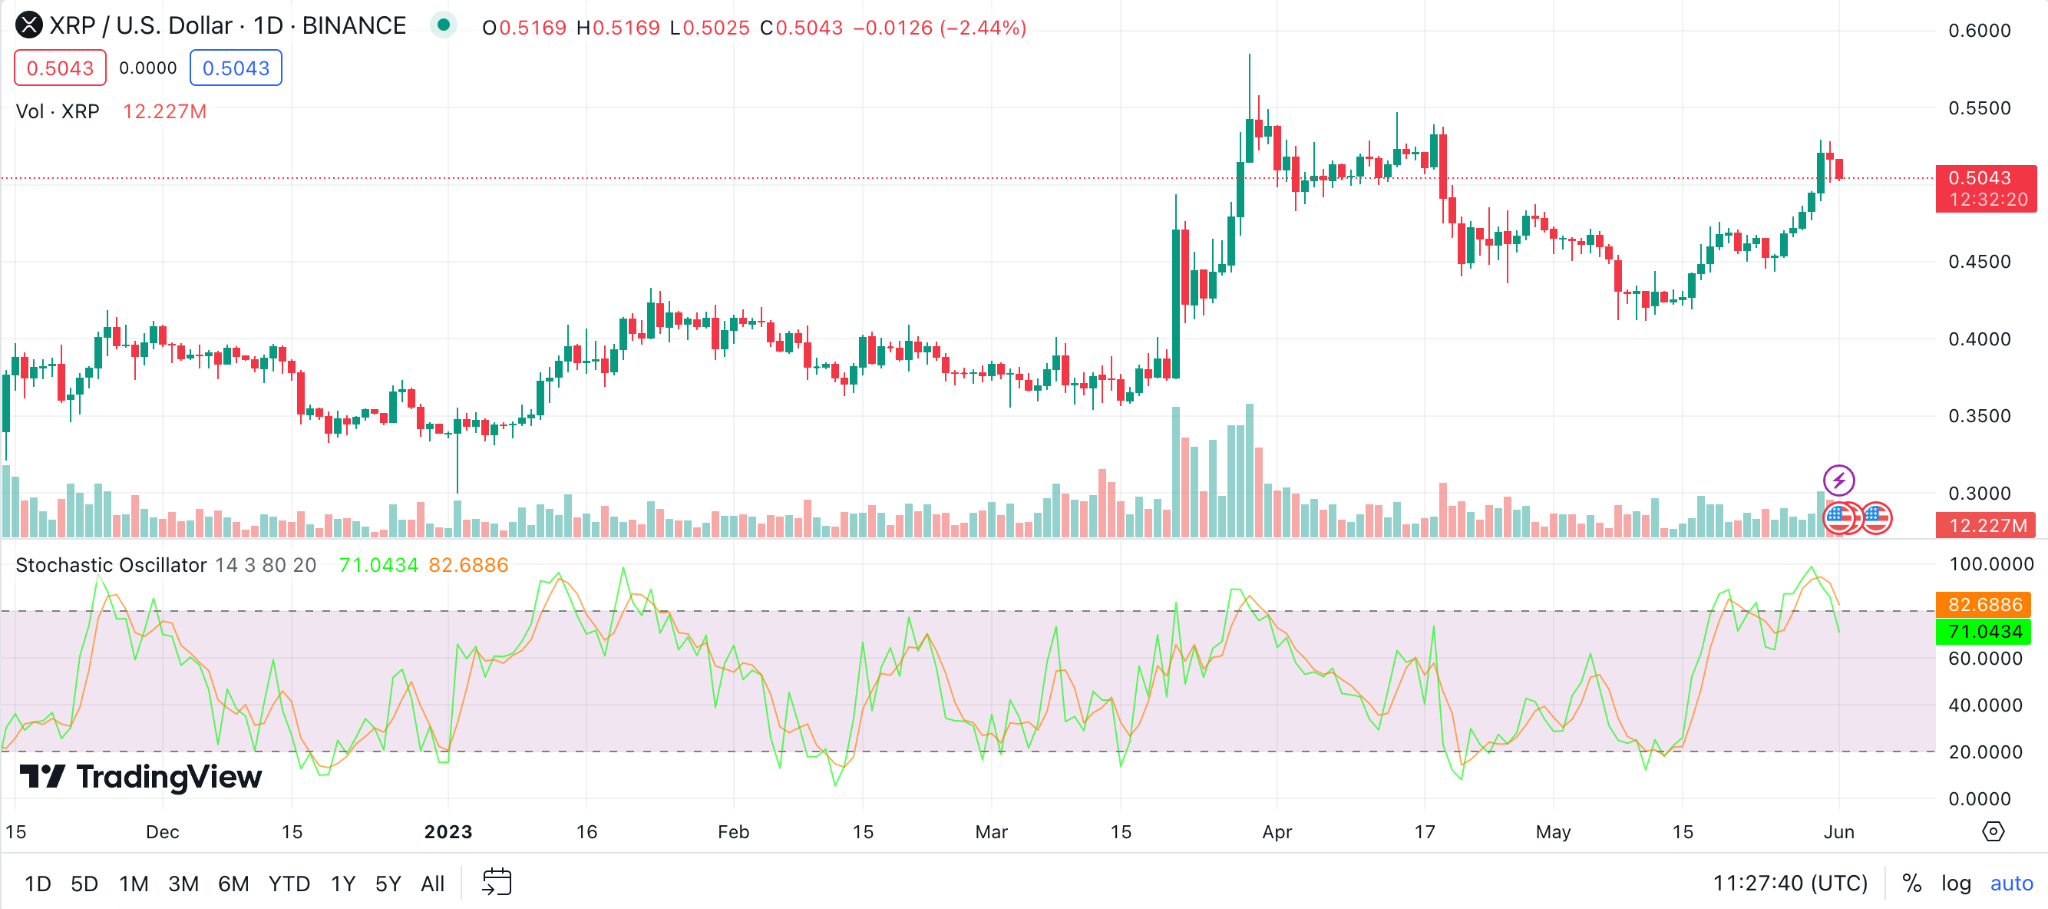
Example: A reading above 80 typically suggests that XRP is trading near the top of its high-low range and might be overbought. Conversely, a reading below 20 indicates that the crypto asset might be near the bottom of its range and could be oversold. These conditions could prompt traders to take profit or enter a contrarian trade, expecting a price reversal.
Parabolic SAR (Stop and Reverse) for Ripple Price Prediction
The Parabolic SAR (Stop and Reverse) system was developed for the purpose of catching trends and determining possible reversal points in the market. It appears as a series of dots placed either above or below the price.
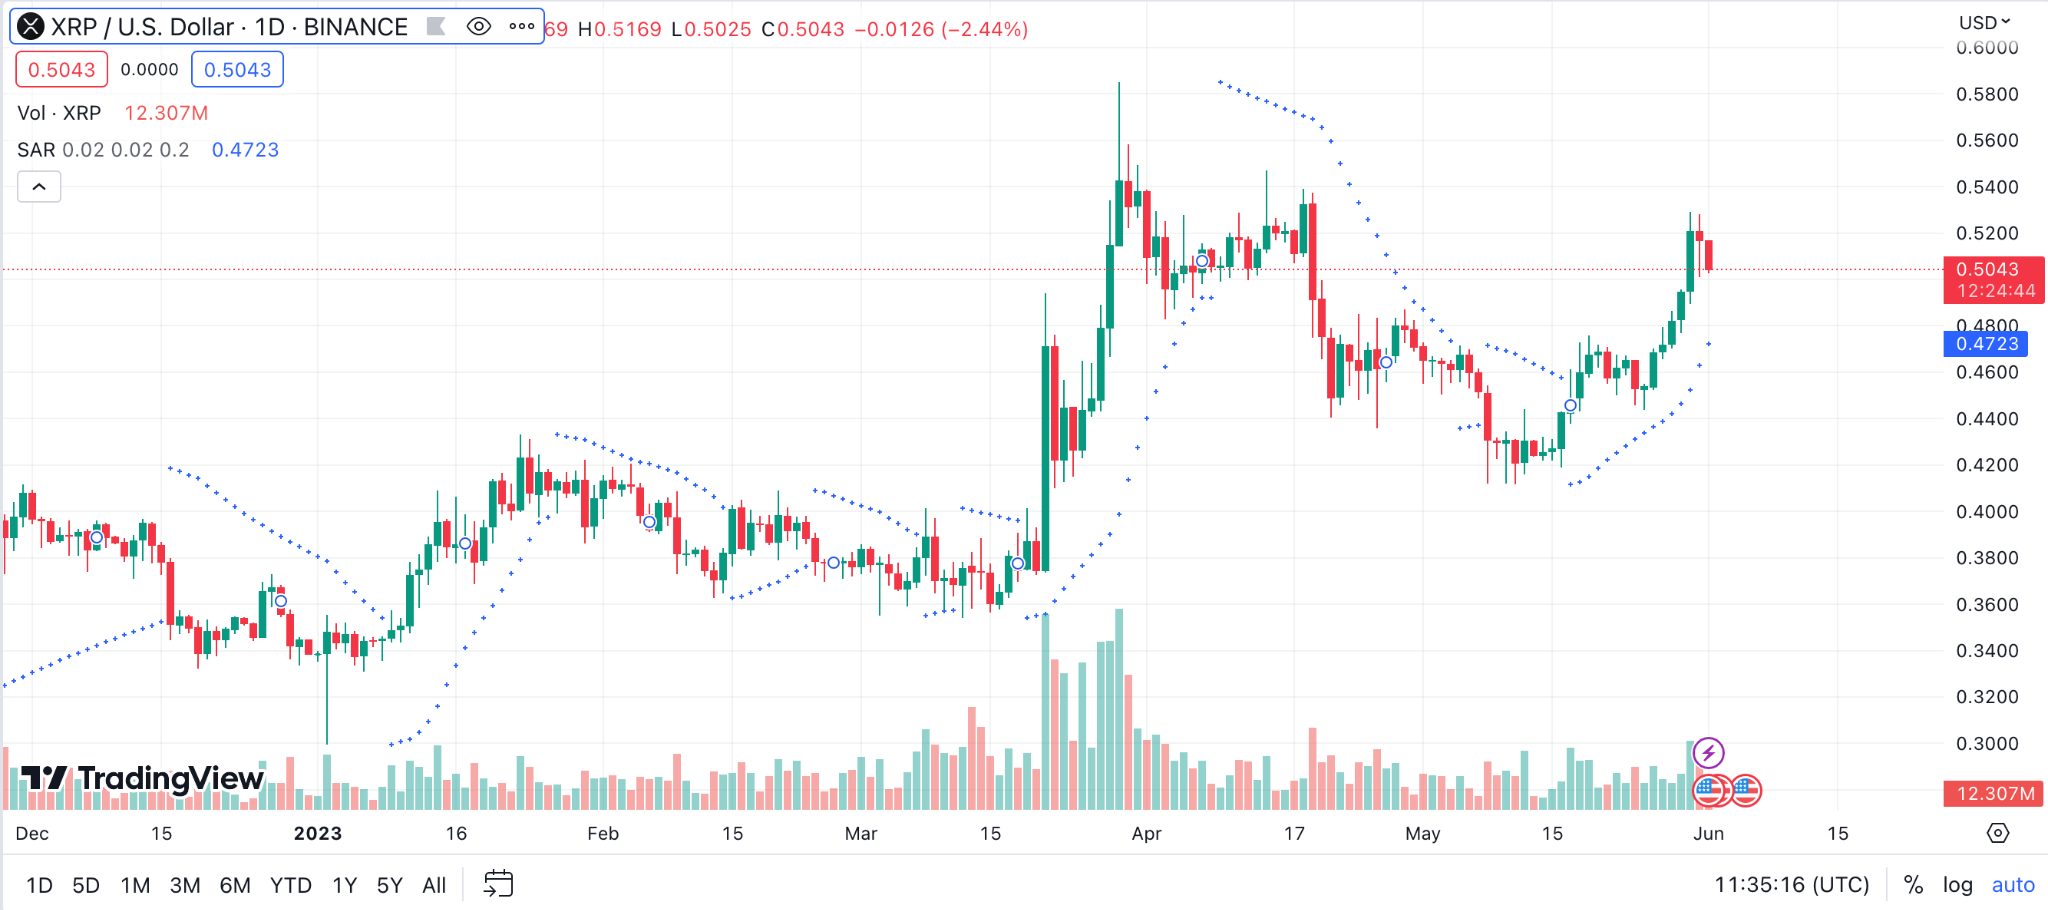
Example: A dot above the price is bearish and suggests that the price of XRP may decrease, while a dot below is bullish, indicating the price may increase. When the dots flip, this can signal a potential change in the market direction. For instance, if we observe the Parabolic SAR flipping from above to below XRP’s price, it may suggest the start of an uptrend.
Ichimoku Cloud for XRP Price Prediction
The Ichimoku Cloud, also known as Ichimoku Kinko Hyo, is a versatile indicator that defines support and resistance, identifies trend direction, measures momentum, and provides trading signals. It consists of five lines: Tenkan-Sen, Kijun-Sen, Senkou Span A, Senkou Span B, and Chikou Span.
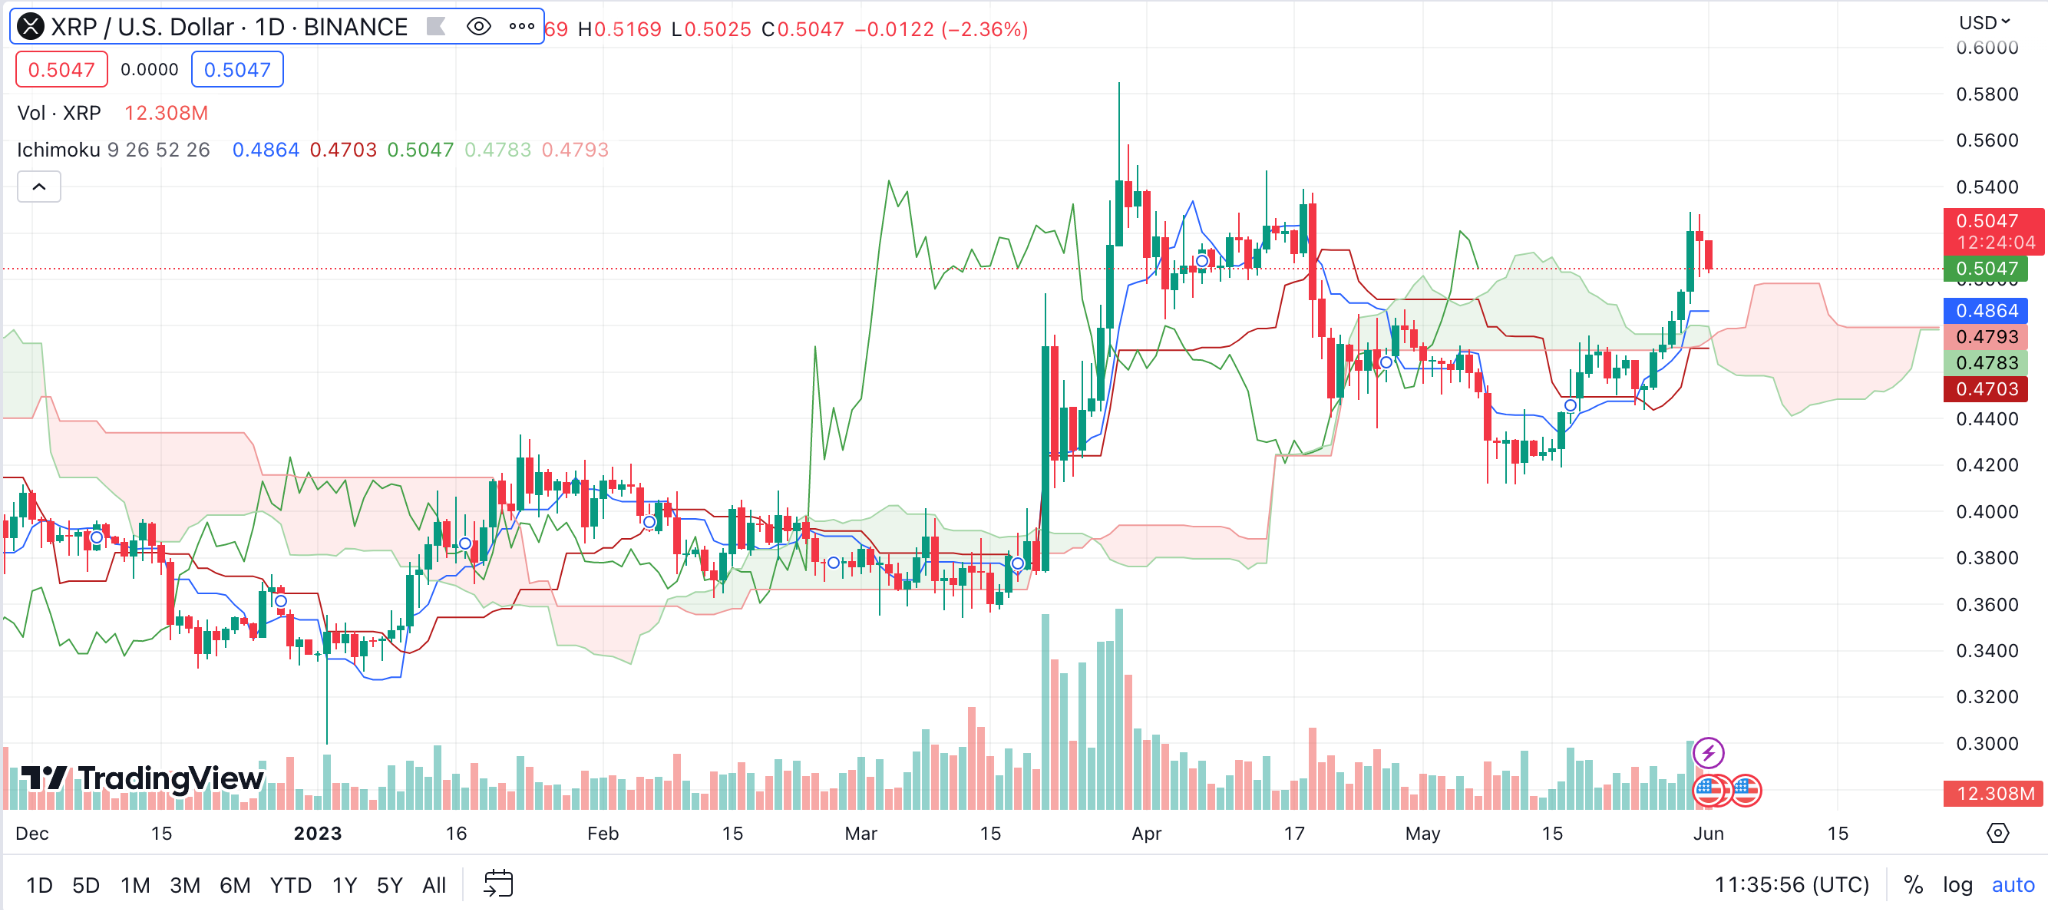
Example: When the Ripple price is above the cloud, it’s generally a bullish signal, and when it’s below the cloud, it’s generally bearish. A crossing of the Tenkan-Sen and Kijun-Sen can also provide buying or selling signals.
Fibonacci Retracement for XRP Price Prediction
Fibonacci Retracement levels are horizontal lines that indicate where potential support and resistance levels are. They are based on Fibonacci numbers and each level is associated with a percentage. Traders often use them to identify potential reversal levels in the market.

Example: For example, if Ripple’s price rises from $0.50 to $1, and then starts to decrease, traders might look at the 61.8% retracement level (around $0.67) for potential support and a reversal point for the price to move back up.
Average Directional Index (ADX) for XRP Price Prediction
The Average Directional Index (ADX) measures the strength of a trend but does not indicate the direction. It’s usually plotted with two other indicators, the Positive Directional Indicator (+DI) and the Negative Directional Indicator (-DI), which can signal the trend direction.
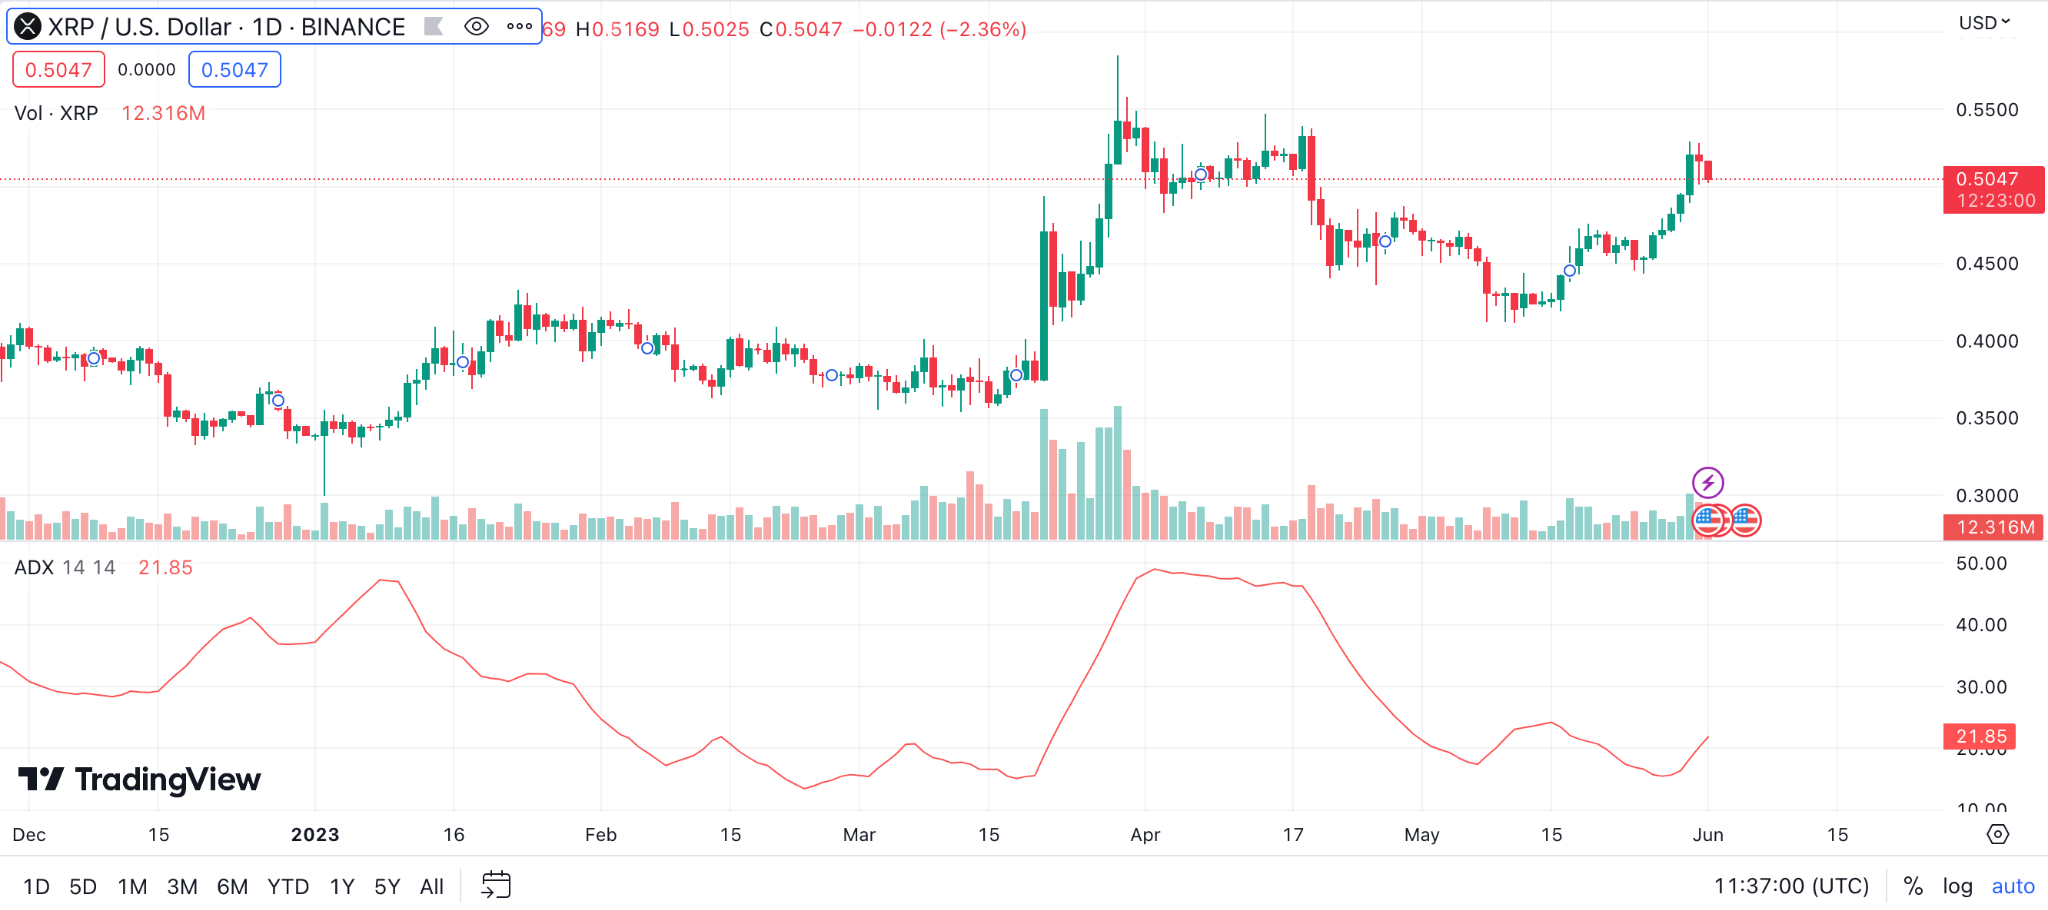
Example: For Ripple, if the ADX is above 25, it suggests a strong trend, while a reading below 20 might indicate a weak trend or range-bound market. If the +DI is above the -DI, it may suggest an uptrend, whereas if the -DI is above the +DI, it might suggest a downtrend.
On Balance Volume (OBV) for XRP Price Prediction
The On Balance Volume (OBV) indicator uses volume flow to predict changes in stock price. Joe Granville developed the OBV metric in the 1960s. He believed that when volume increases sharply without a significant change in the stock’s price, the price will eventually jump upward, and vice versa.
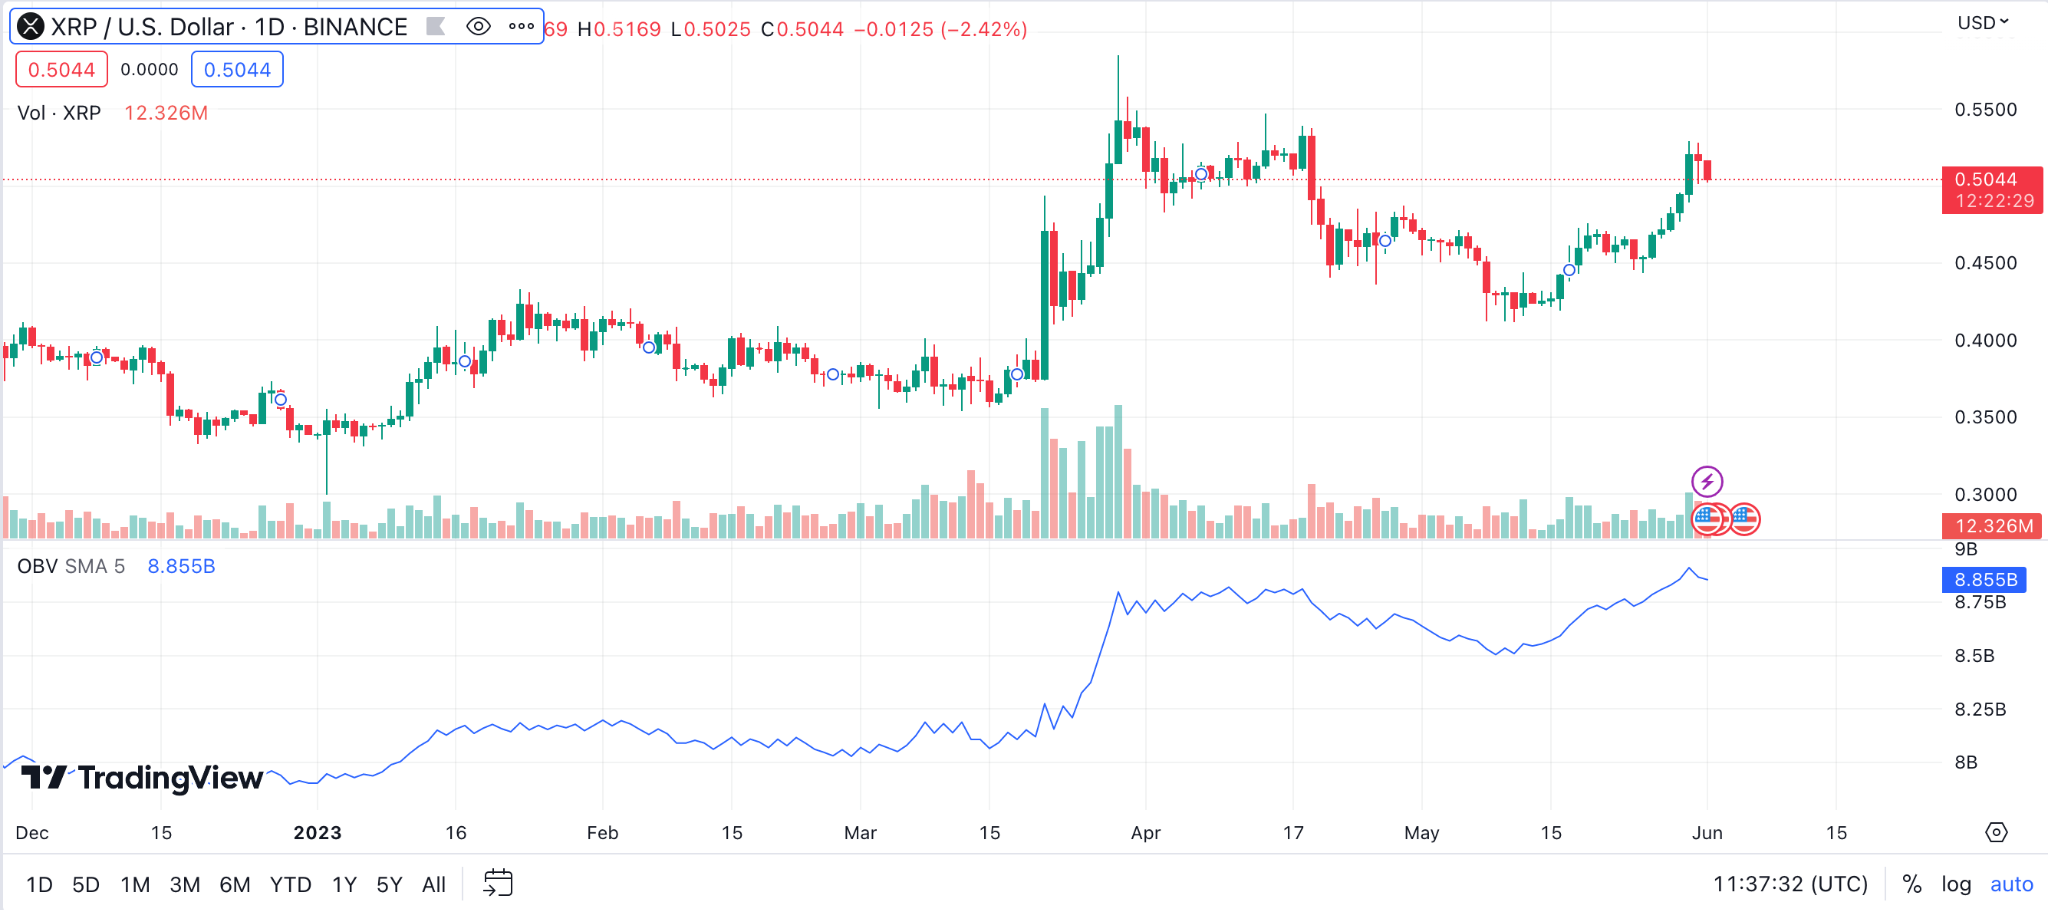
Example: In the context of Ripple, if we see a consistent rise in OBV, it may signal a positive price trend. For instance, if the price of XRP remains stagnant while OBV rises, it could potentially indicate an upcoming price surge.
Rate of Change (ROC) for XRP Price Prediction
The Rate of Change (ROC) is a momentum-based technical trading indicator that shows the speed at which a variable changes in a specific period as a ratio of an earlier period. Essentially, ROC measures how much the current price has changed from a previous price.
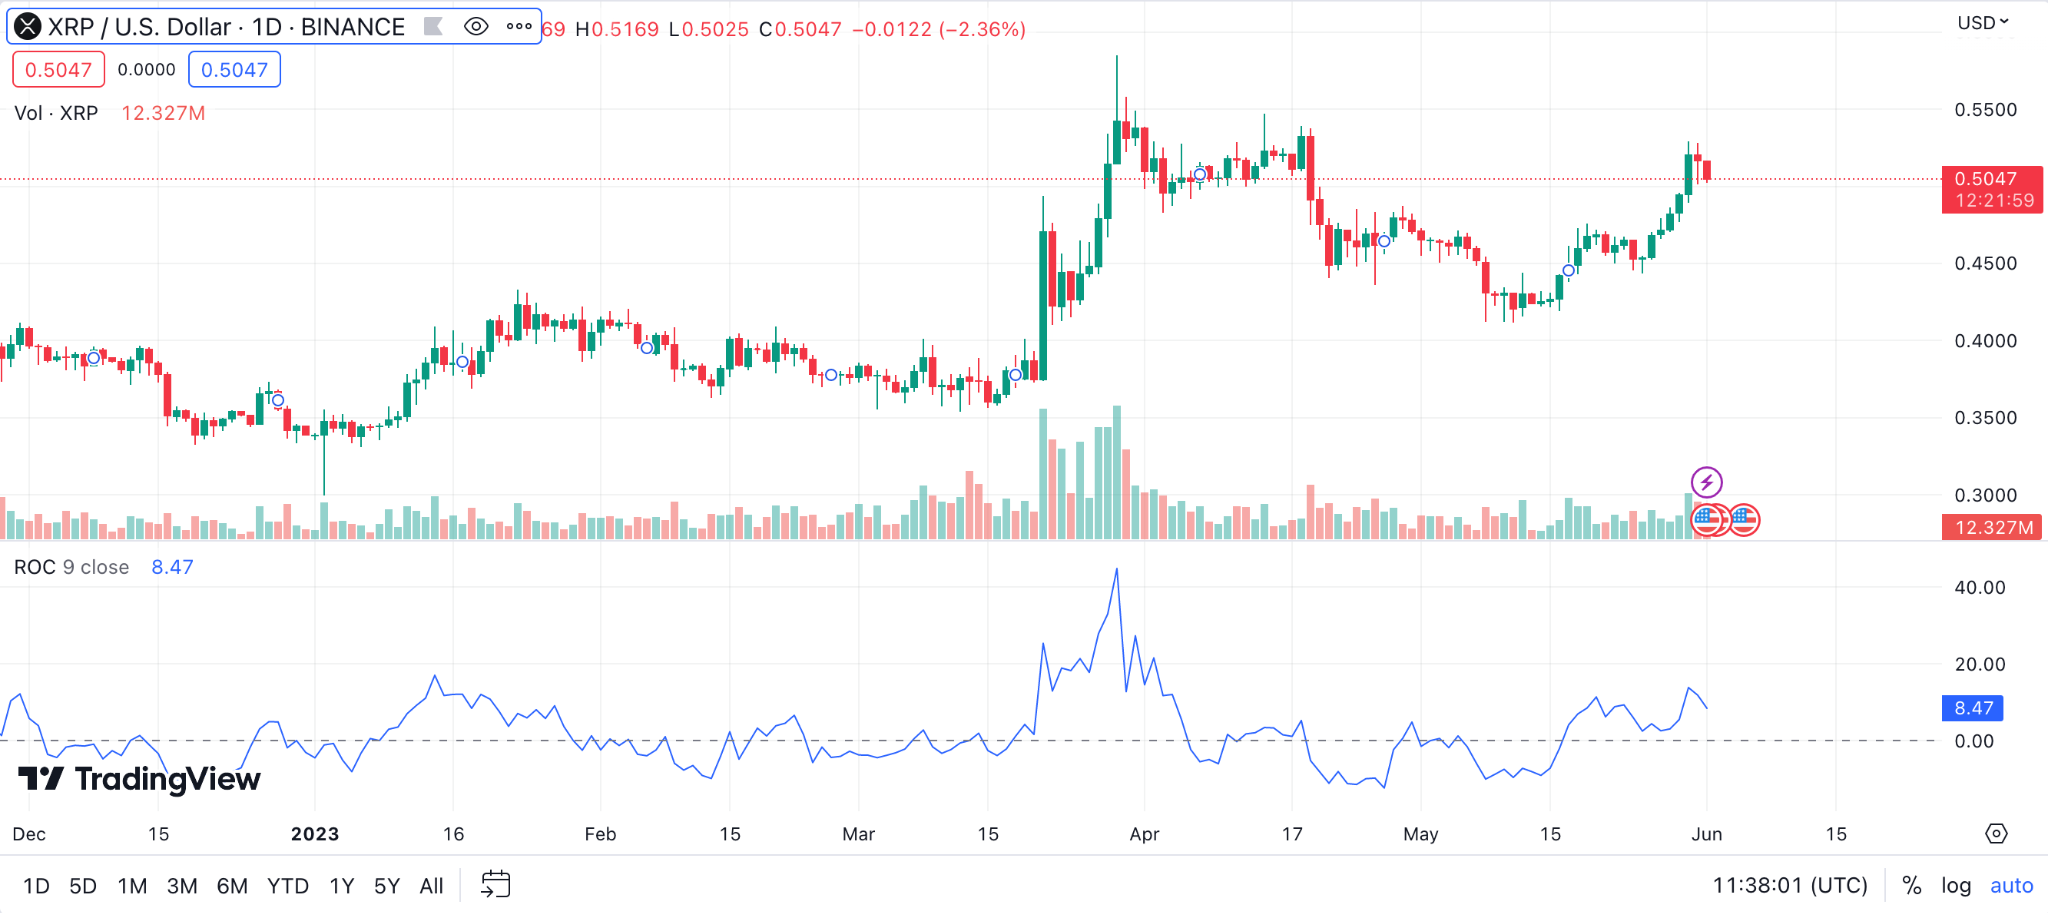
Example: When applied to XRP’s price, if the ROC is above the zero line, it indicates bullish momentum, and when it’s below the zero line, it signals bearish momentum. For instance, a sudden drop below zero in the ROC of XRP could be an early indication of a coming bear market (crypto winter).
Commodity Channel Index (CCI) for XRP Price Prediction
The Commodity Channel Index (CCI) is a versatile indicator that can be used to identify a new trend or warn of extreme conditions. Donald Lambert originally developed CCI to identify cyclical turns in commodities, but the indicator can be successfully applied to indices, ETFs, stocks, and other securities. In simple terms, CCI measures the current price level relative to an average price level over a given period of time.
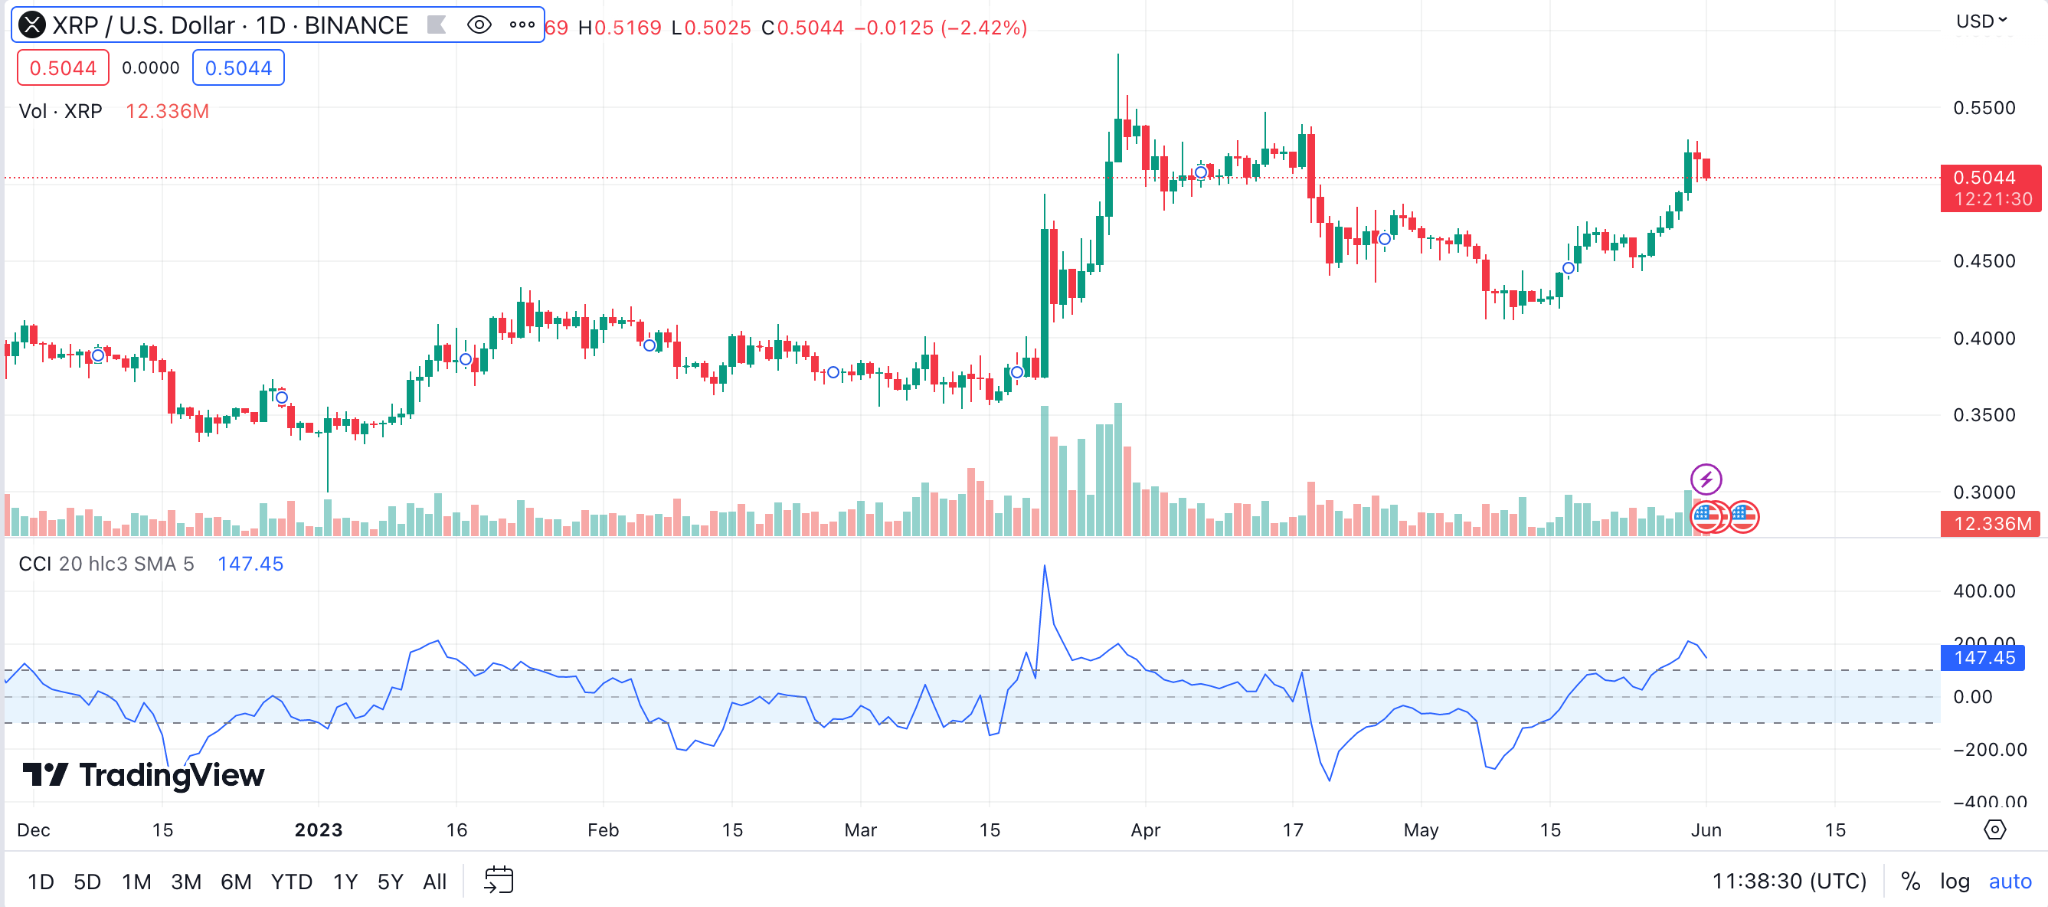
Example: For XRP’s price, a CCI value above +100 could indicate an overbought condition, suggesting a possible price reversal, while a value below -100 may signal an oversold condition.
Accumulation/Distribution Line (A/D Line) for XRP Price Prediction
The Accumulation/Distribution Line (A/D Line) is a volume-based indicator designed to measure the cumulative flow of money into and out of a security. Marc Chaikin developed the A/D Line and it is often used to confirm price trends or warn of weak movements that could result in a price reversal.
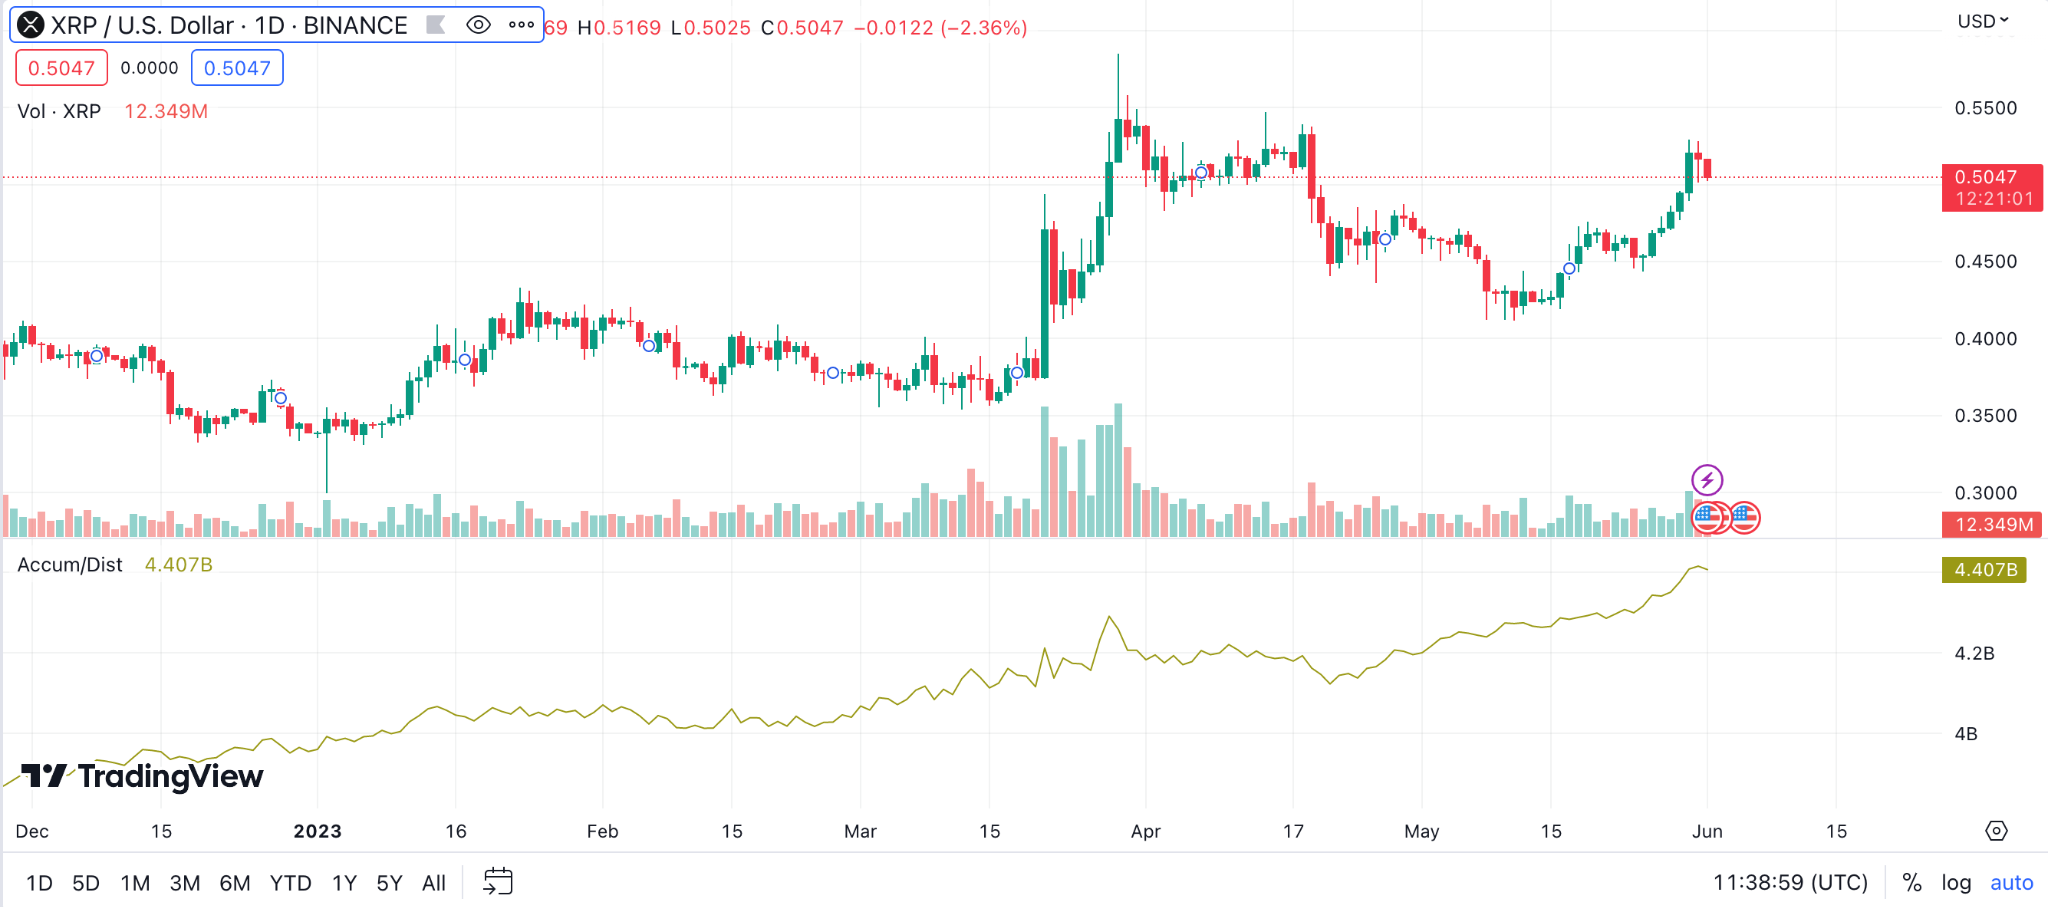
Example: In terms of XRP’s price, a rising A/D Line could confirm an uptrend in the XRP price, while a falling A/D Line might suggest a bearish price trend. If the A/D Line is rising while the price of XRP is falling, it could indicate potential bullish price pressure in the near future.
Pivot Points for XRP Price Prediction
Pivot points are a type of technical analysis tool, used to determine the overall trend of the market during different periods. They are calculated using the high, low, and closing prices of the previous trading day.
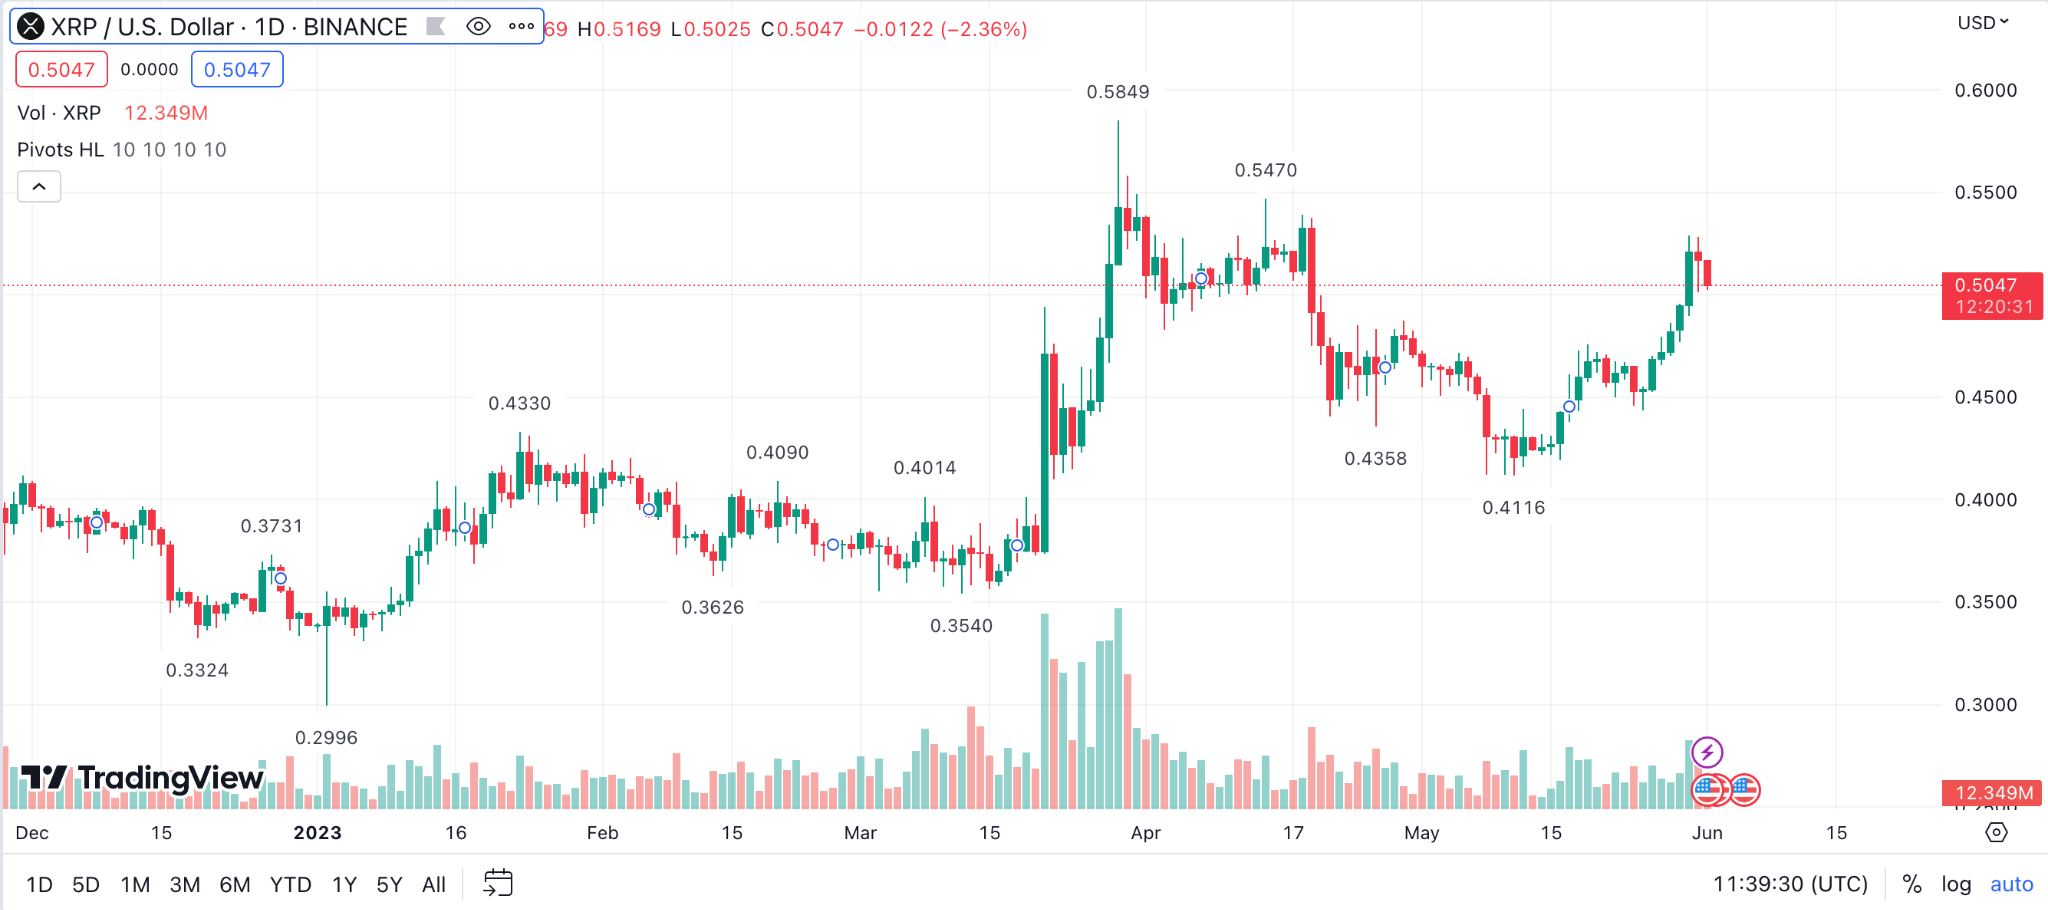
Example: If XRP’s price is above the pivot point, the market is considered bullish, if it’s below, it’s viewed as bearish. For example, if the closing price of XRP was $1.20, the high was $1.25, and the low was $1.15, the pivot point for the next trading day would provide key support and resistance levels to inform trading decisions.
Chaikin Money Flow (CMF) for XRP Price Prediction
The Chaikin Money Flow (CMF) is a technical analysis indicator used to measure Money Flow Volume over a set period of time. Money Flow Volume forms the basis for the Accumulation Distribution Line. Essentially, CMF is an indicator of buying and selling pressure.
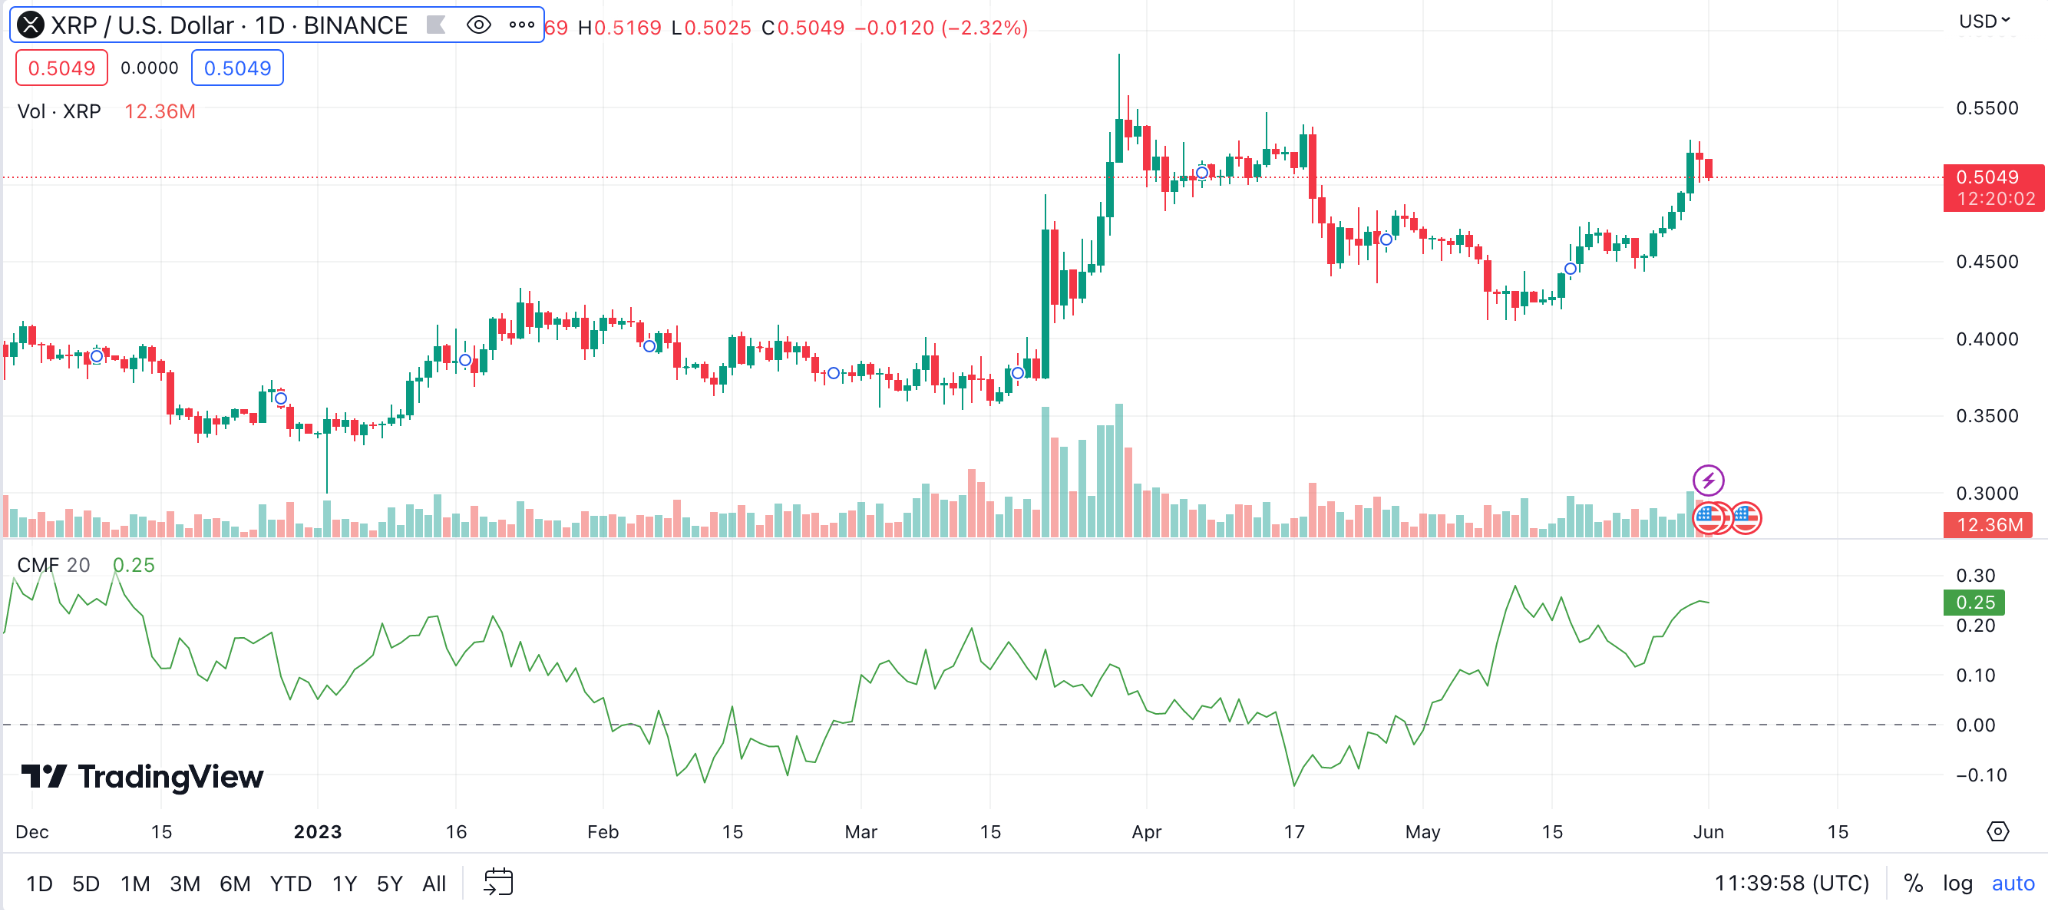
Example: For XRP’s price, a positive CMF would indicate buying pressure and a negative CMF would indicate selling pressure. If, for instance, XRP had a CMF of 0.20, it would indicate a strong buying XRP pressure.
Aroon Indicator for XRP Price Prediction
The Aroon indicator is a technical indicator that is used to identify when trends are likely to change. In essence, the indicator measures the time between highs and the time between lows over a time period. The two resulting numbers plotted against each other can indicate trend reversals.
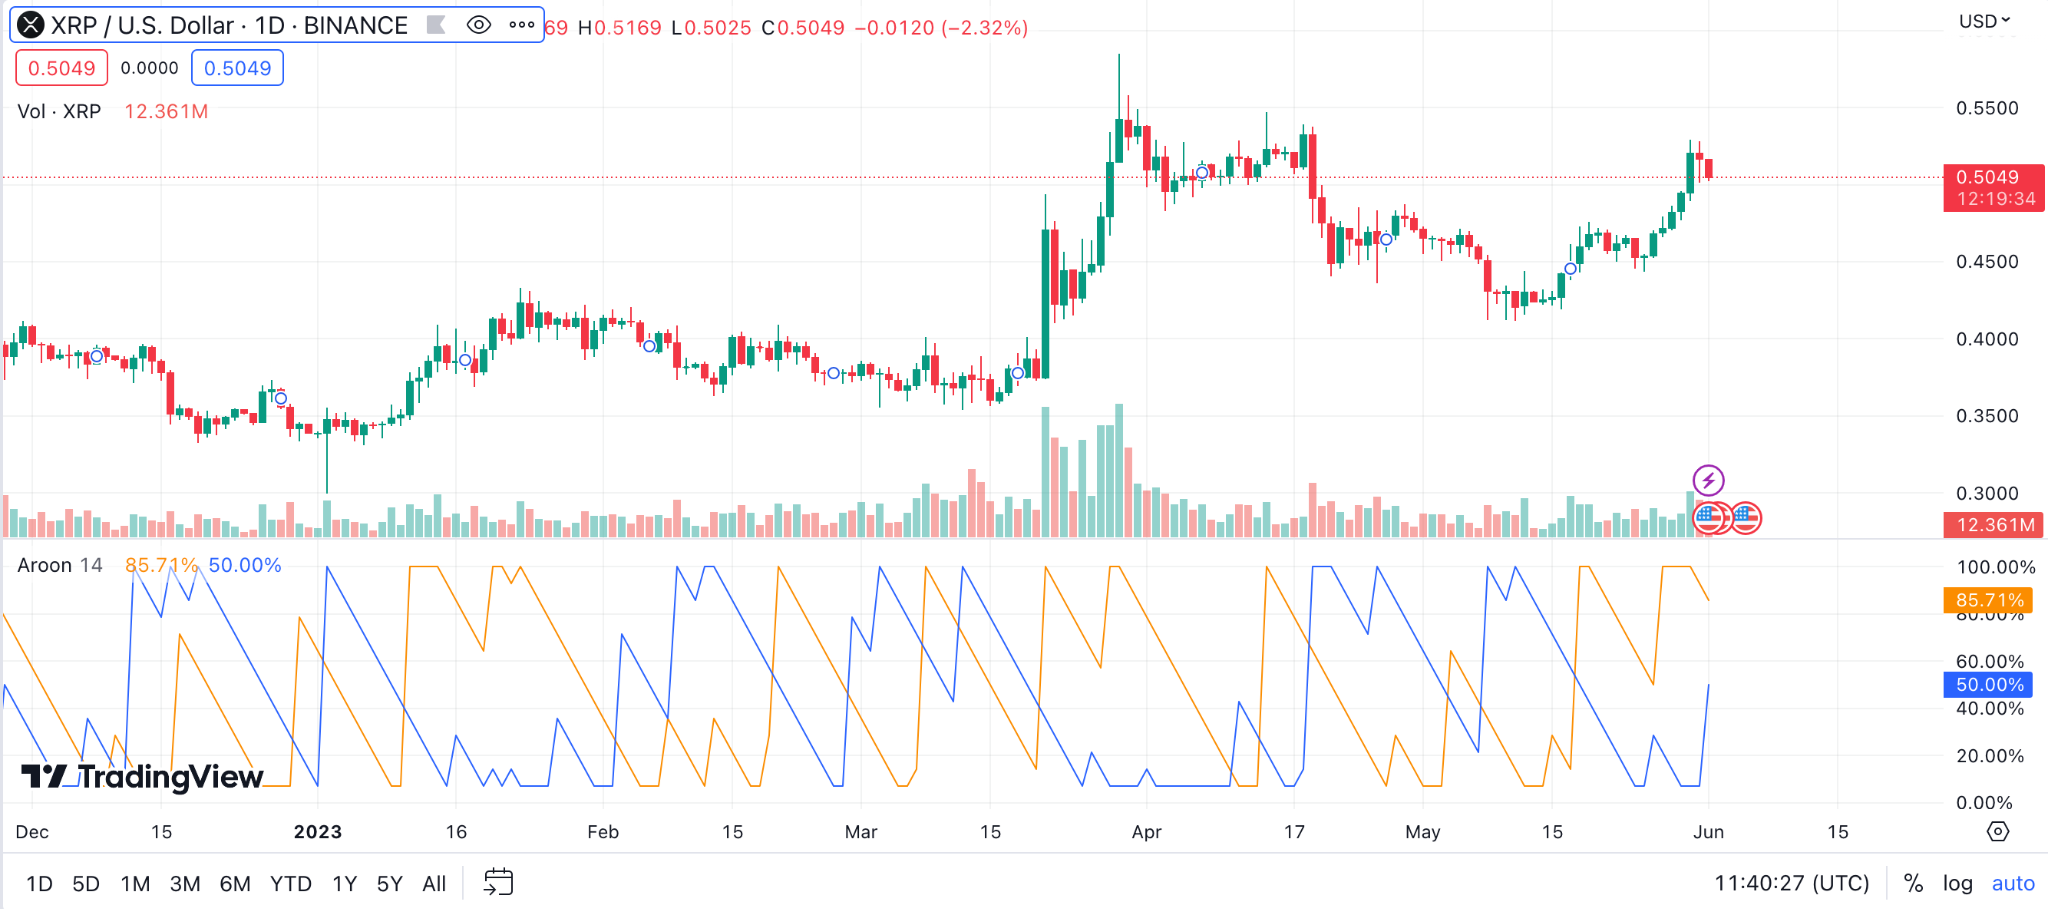
Example: If the Aroon Up crosses above the Aroon Down, it might be a sign of a bullish trend for Ripple. Conversely, if the Aroon Down crosses above the Aroon Up, it could signify a potential bearish trend for XRP’s price.
Gann Fan for XRP Price Prediction
The Gann Fan is a technical tool developed by W.D. Gann, a renowned trader. These fans are used to identify critical points of support and resistance and predict changes in price trends. The fan lines are drawn at different angles from a critical price and time point.

Example: If XRP’s price was trending upwards at a steady pace, a Gann Fan could be drawn from the start of the trend. If the price breaks one of the fan lines downwards, it might indicate a possible trend reversal.
Keltner Channel for XRP Price Prediction
The Keltner Channel is a volatility-based technical indicator composed of three separate lines. The middle line is an exponential moving average (EMA), and the other two are positive and negative bands away from the EMA. The bands widen when volatility increases and contract when volatility decreases.

Example: If XRP’s price were trading close to the upper Keltner Channel, this might indicate a strong bullish trend, especially if the channels are expanding, showing increased volatility.
Money Flow Index (MFI) for XRP Price Prediction
Money Flow Index (MFI) is a technical oscillator that uses both price and volume data to measure buying and selling pressure. It oscillates between 0 and 100, with a reading over 80 typically considered overbought and a reading under 20 oversold.
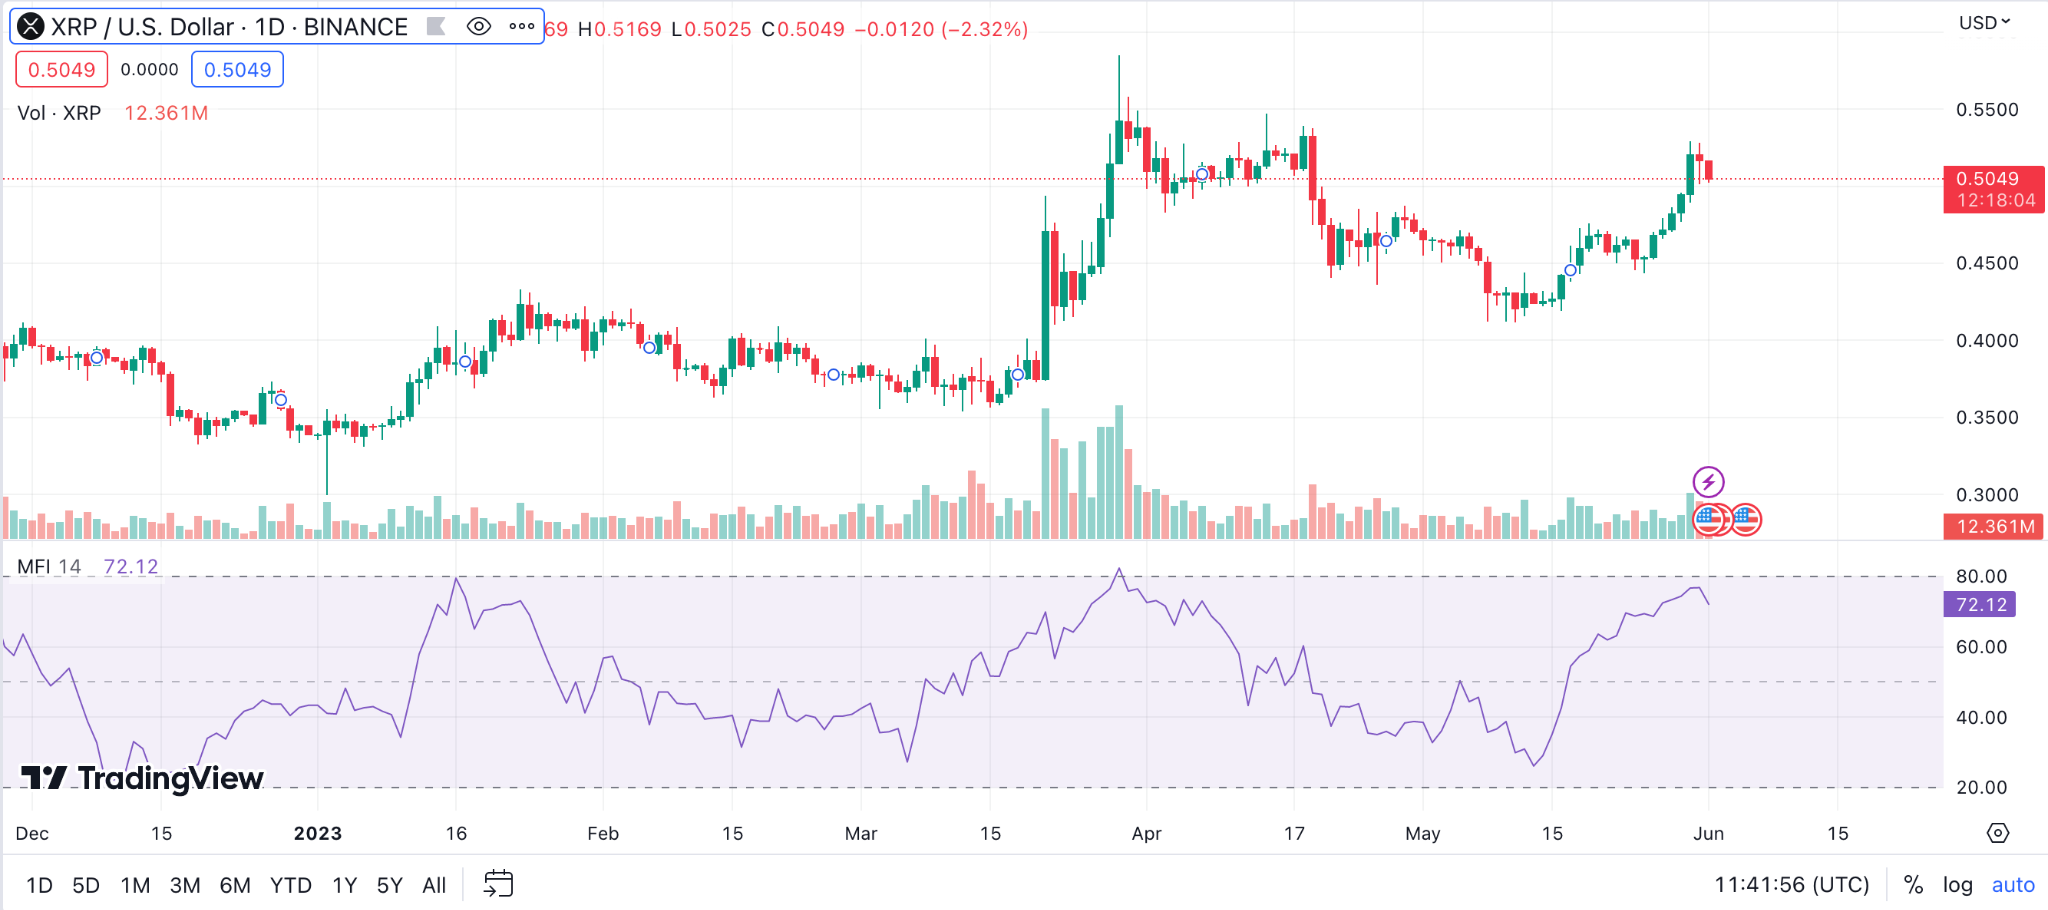
Example: If MFI for XRP’s price moves above 80, it might suggest that Ripple is overbought, and a price correction may be imminent. Conversely, if MFI dips below 20, it might imply that Ripple is oversold, potentially signaling a buying opportunity for traders.
TRIX for XRP Price Prediction
TRIX is a momentum-based oscillator used to filter out price movements that are deemed insignificant or minor. It displays the percent rate of change of a triple exponentially smoothed moving average of the asset’s closing price.
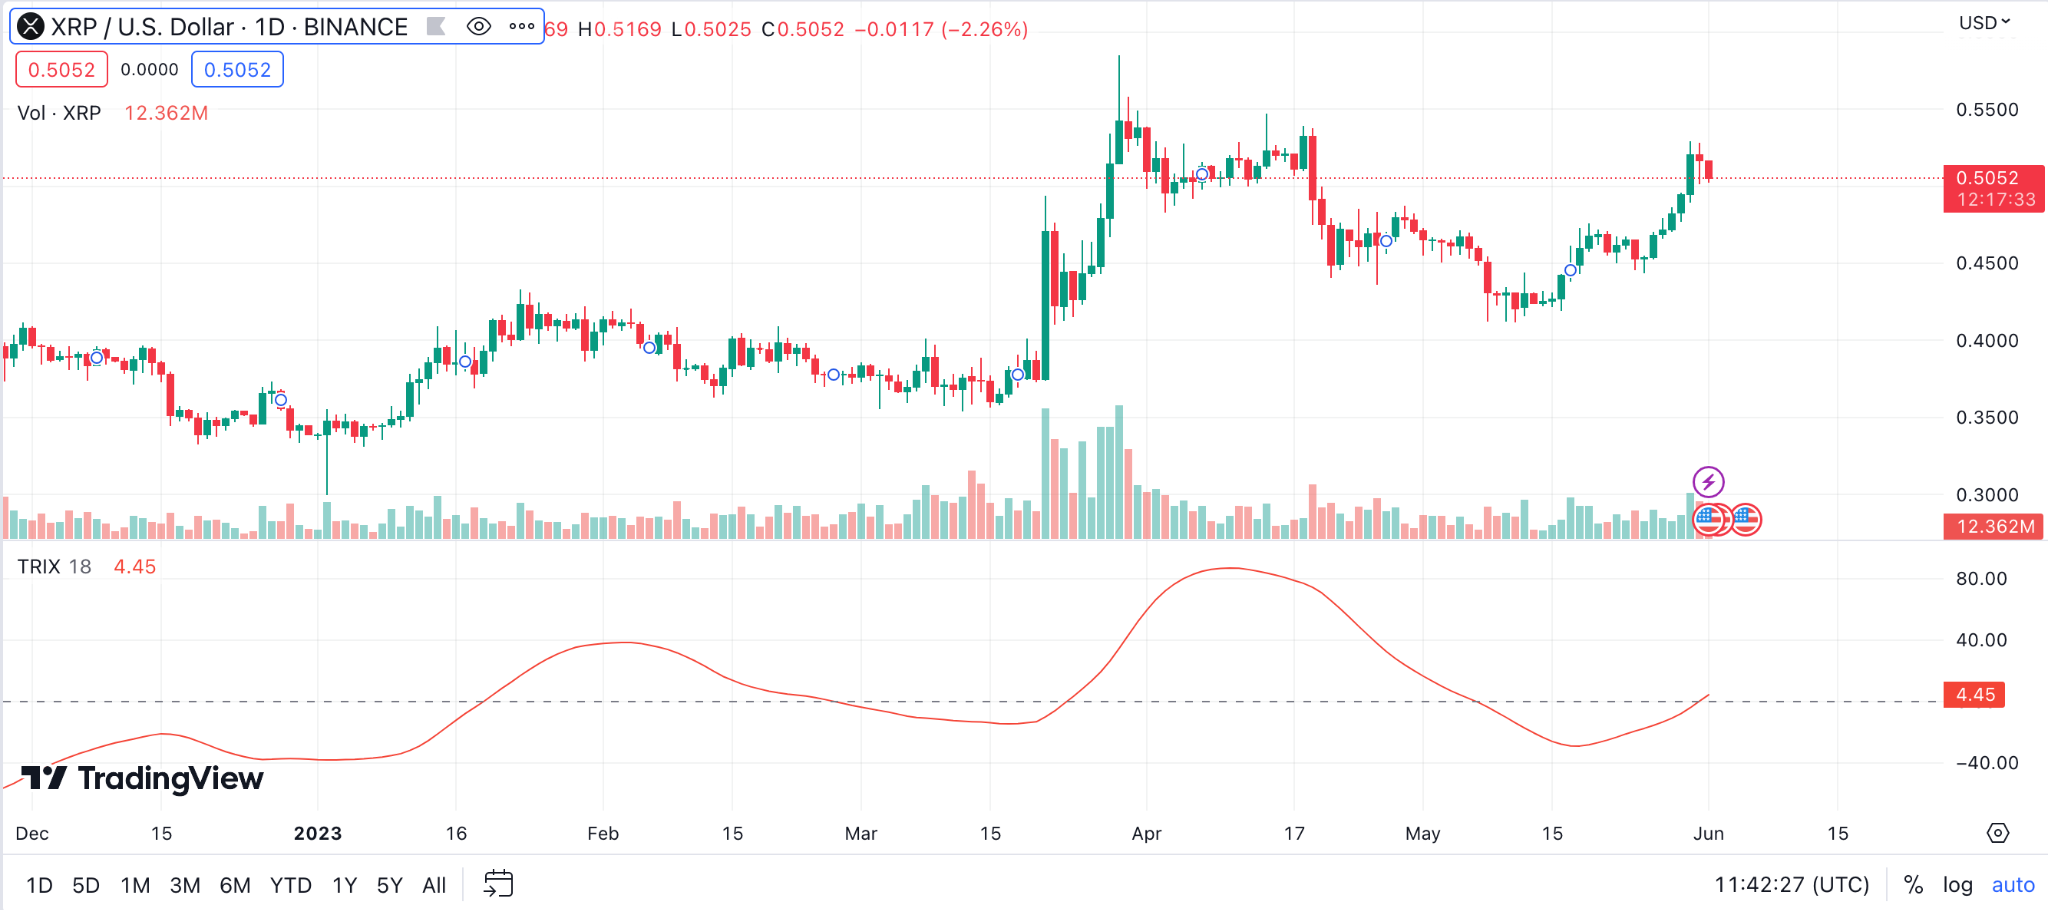
Example: If XRP’s price TRIX line were to cross above the signal line, it could suggest a bullish signal, and vice versa for a bearish signal.
The Zig Zag Indicator for XRP Price Prediction
The Zig Zag Indicator is a powerful tool to understand the underlying trends of Ripple’s price and spot reversals. This indicator eliminates smaller price fluctuations and focuses on significant changes, making the general direction of prices more evident.
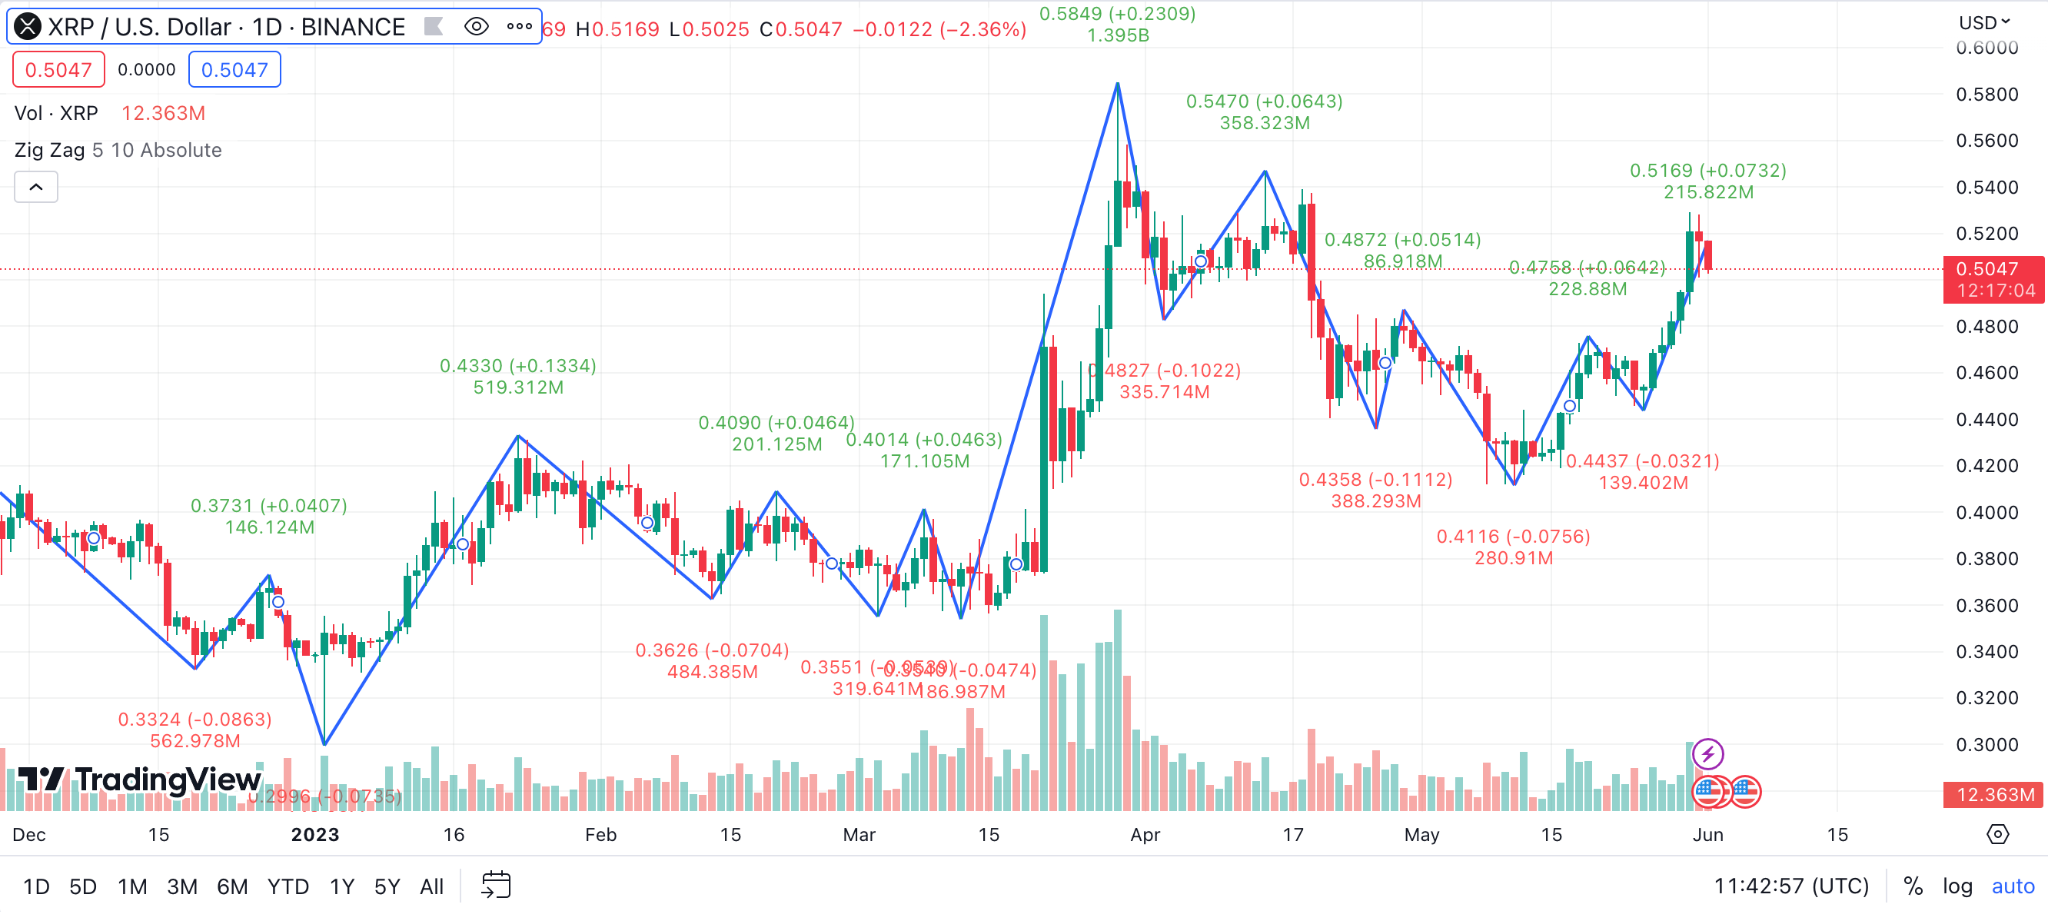
Example: If XRP’s price trend is upward but shows a downward move of less than a pre-defined percentage, the Zig Zag would disregard this move and maintain the upward line.
Detrended Price Oscillator (DPO) for XRP Price Prediction
The DPO is a tool that removes the trend from the price of an asset to make it easier to identify cycles. It is particularly useful to see the peak-trough cycle or the length of seasonal patterns.
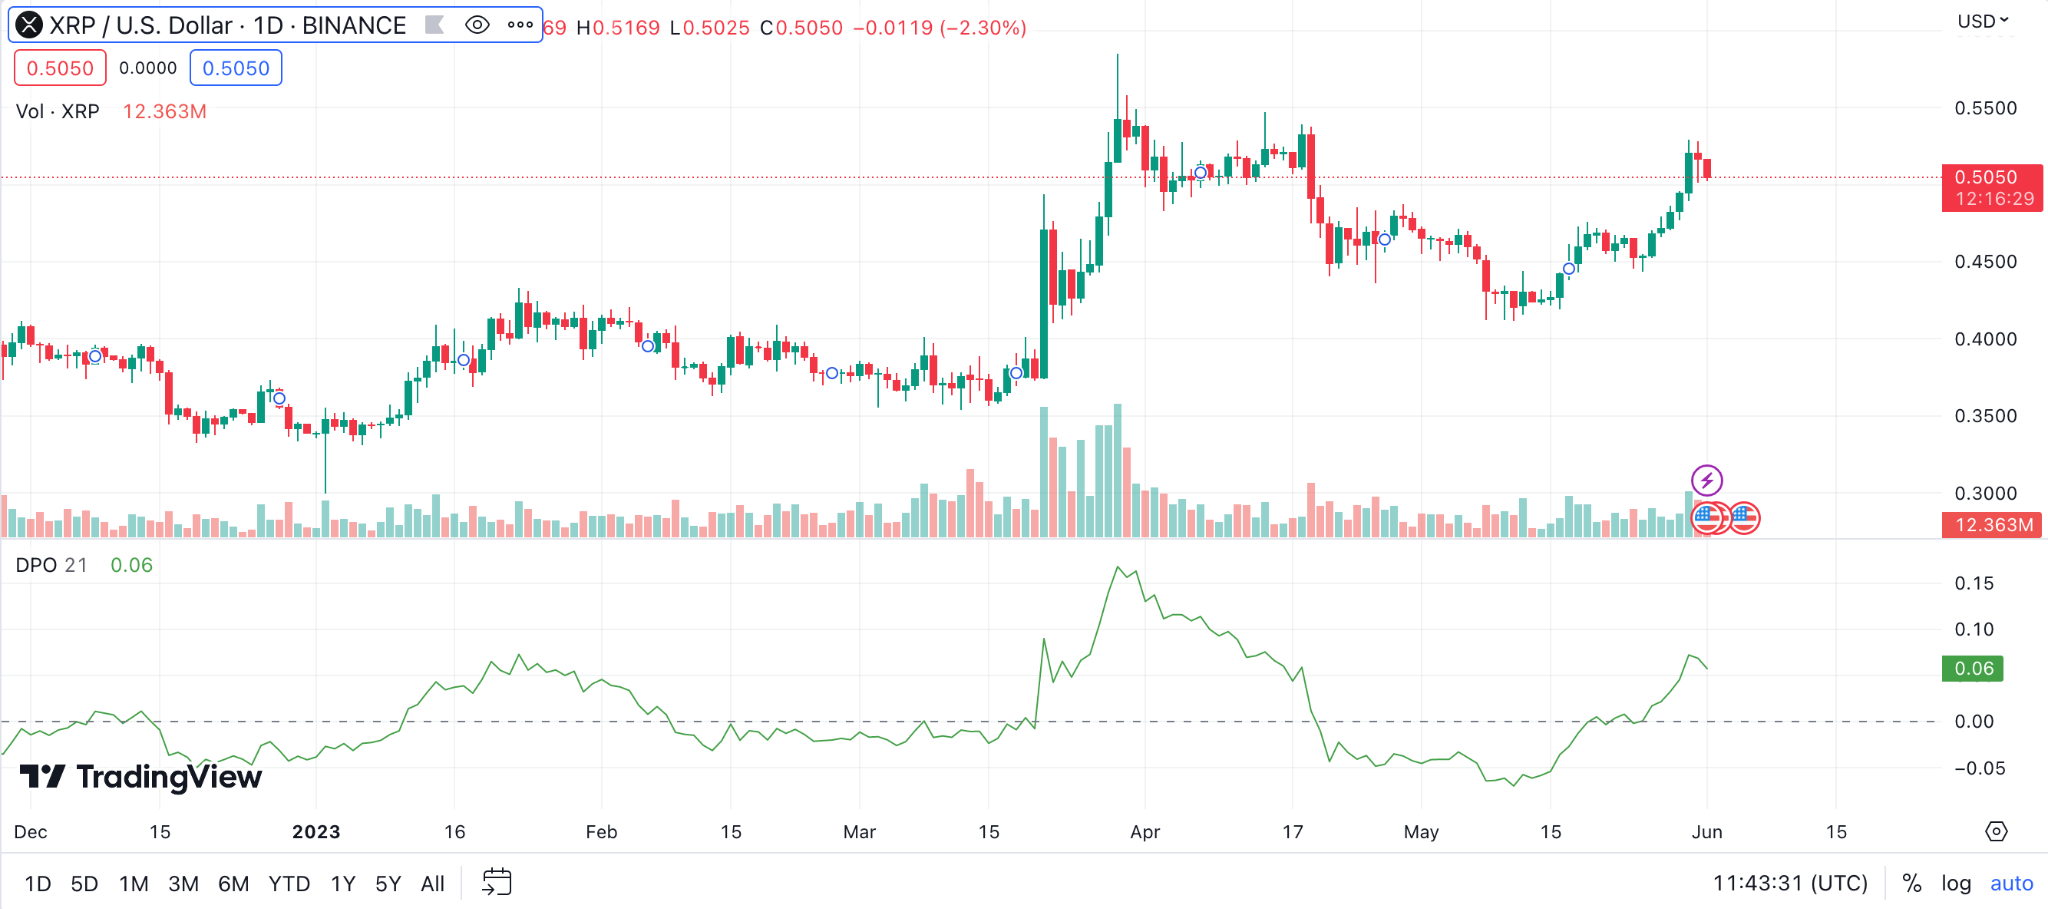
Example: For XRP’s price, if the DPO shows repeated patterns over a specific period, traders could use this information to predict when the next peak or trough might occur, which can guide their trading decisions.
Vortex Indicator (VI) for XRP Price Prediction
The Vortex Indicator is a unique tool used to identify the start of a new trend or the continuation of an existing trend within Ripple’s price action. The VI uses the high, low, and close to create two oscillators that move in unison.
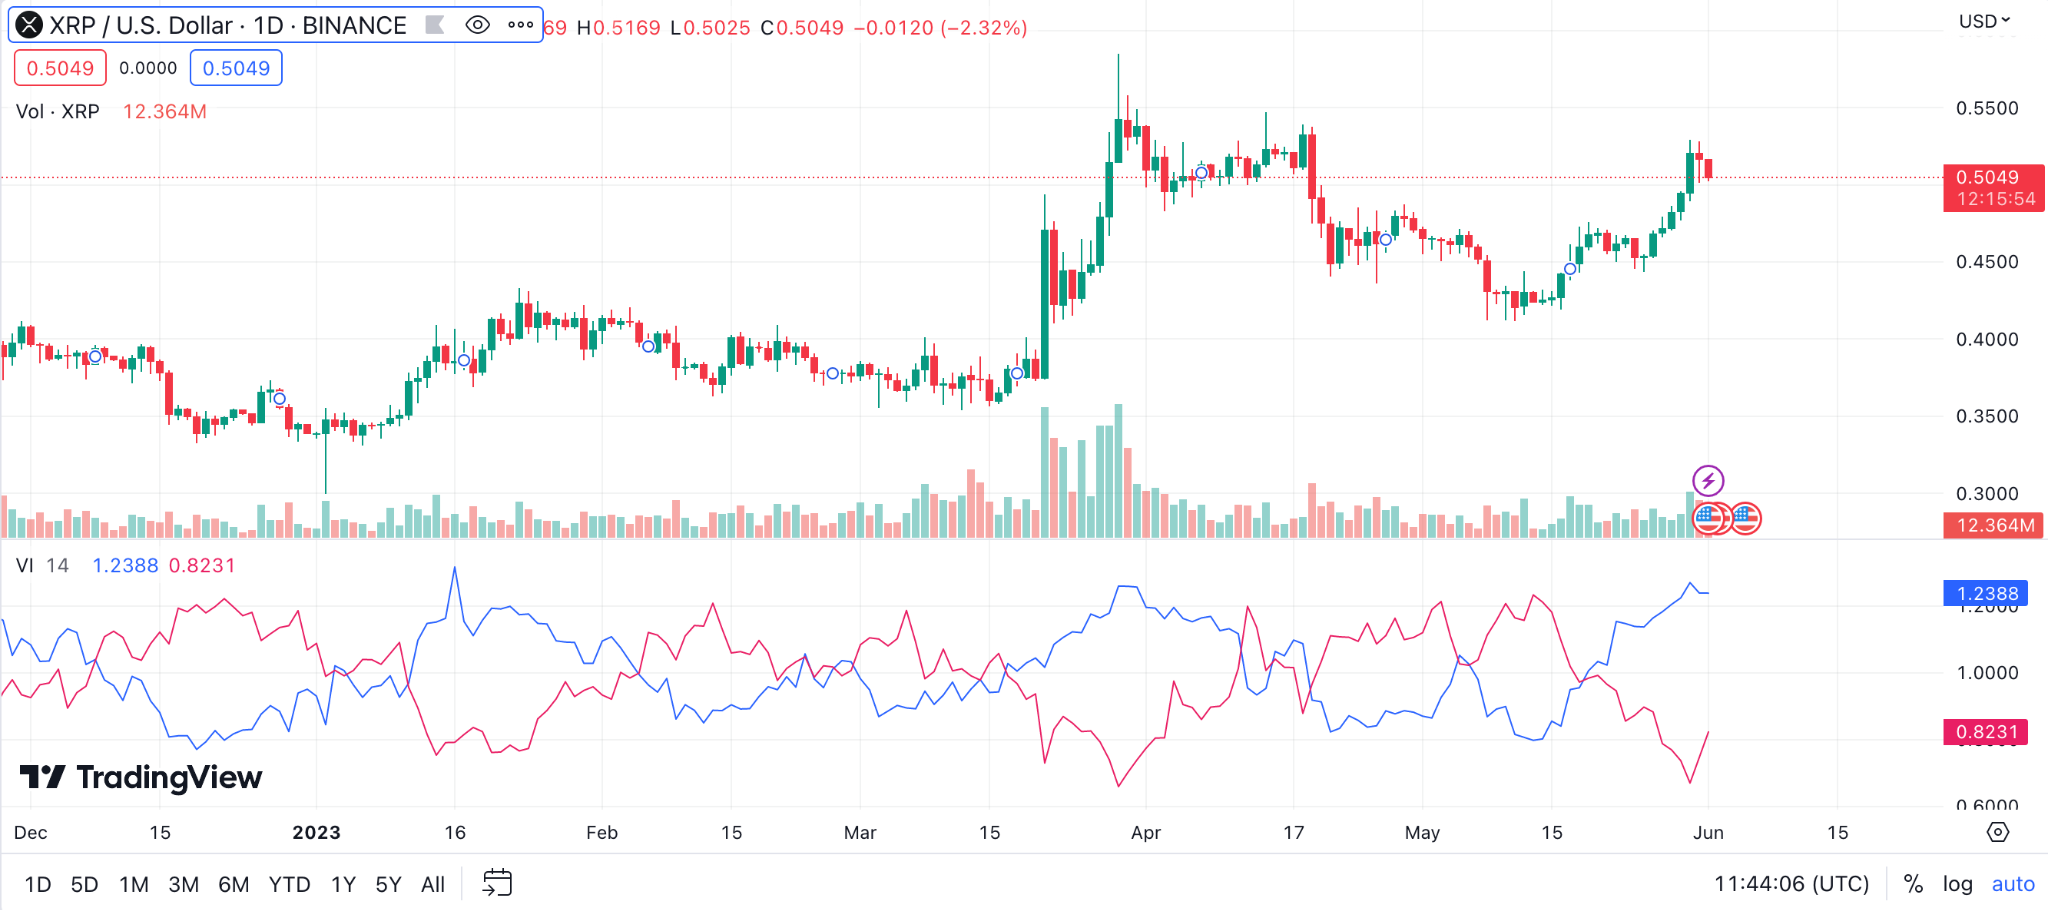
Example: When the positive VI (green line) is above the negative VI (red line), Ripple is considered to be in an uptrend, and when the negative VI is above the positive VI, Ripple is in a downtrend.
Elder’s Force Index (EFI) for XRP Price Prediction
Elder’s Force Index is an oscillator that uses price and volume to assess the power behind a move or to reinforce a trend. It can also identify potential reversals and price corrections.
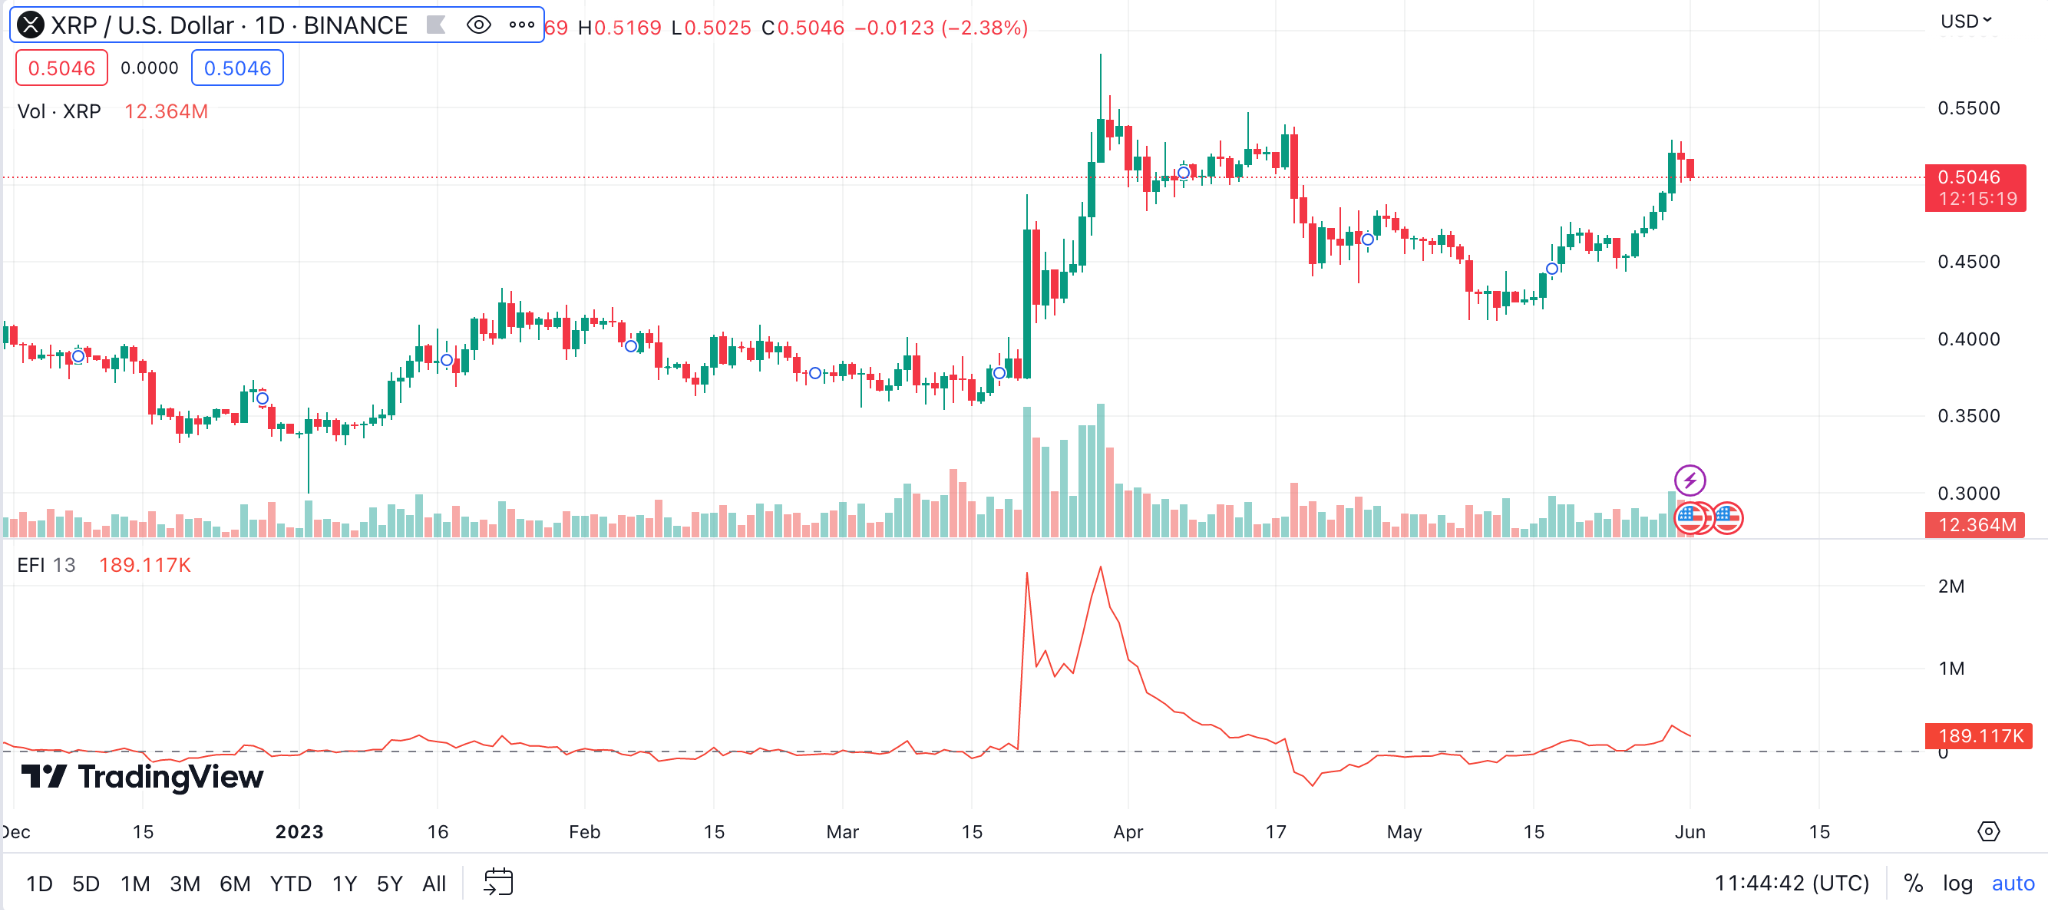
Example: For XRP price, a large force index often coincides with a powerful move in price, reflecting strong investor interest. If the EFI shows a deep dip followed by a sharp recovery, this could signal a bullish reversal, suggesting a potential entry point for traders.
Williams %R for XRP Price Prediction
The Williams %R, or just %R, is a technical analysis oscillator showing the current closing price in relation to the high and low of the past N days (typically 14).
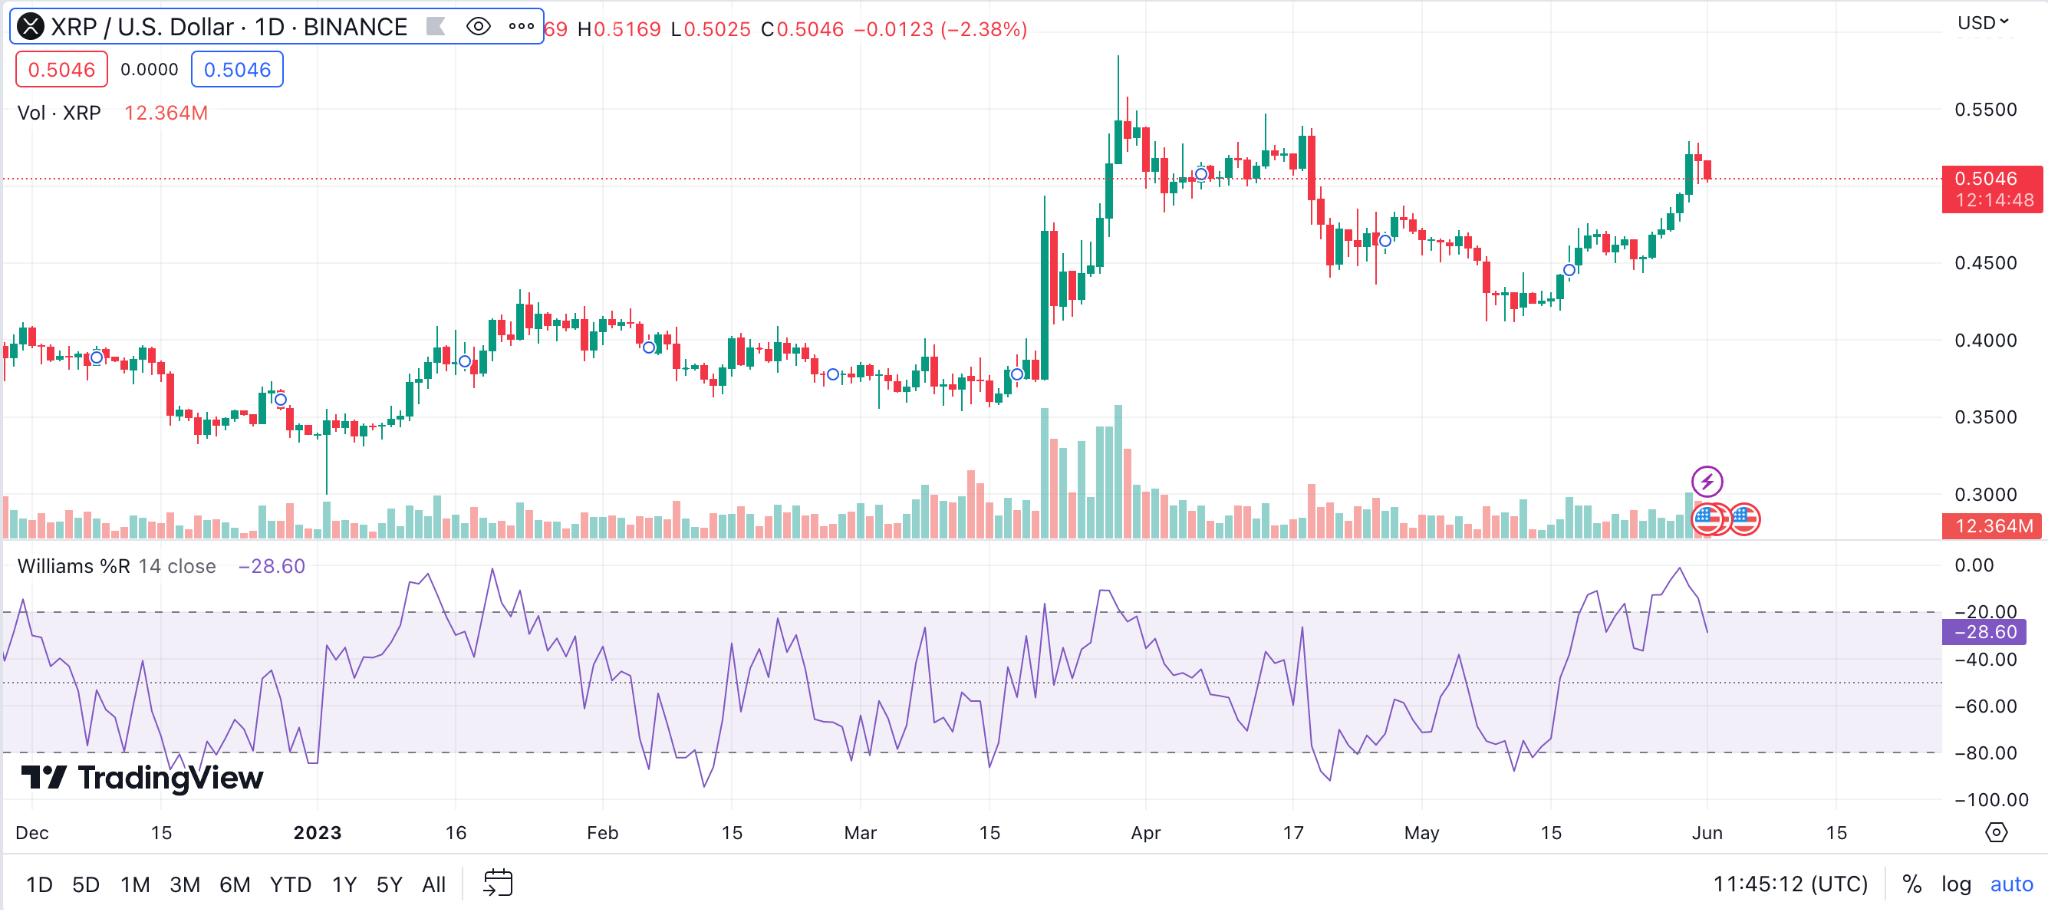
Example: In the context of XRP’s price, values range from 0 to -100. A value of -20 or less often suggests that the market is overbought, while a value of -80 or more suggests that it may be oversold, providing potential entry and exit points for traders.
Combining Technical Indicators for Accurate XRP Price Prediction
As I immerse myself in the fascinating world of cryptocurrency trading, I cannot emphasize enough the critical role that technical indicators play in making informed trading decisions, particularly for crypto assets like Ripple. These tools are like the weather vanes of the crypto market. They help us see where the wind is blowing and gauge how strongly. However, like any experienced trader will tell you, one indicator alone doesn’t paint the full picture. It’s the clever combination of various indicators that can provide a comprehensive view of the market.
The Importance of Using Multiple Technical Indicators for XRP Price Prediction
It’s easy to get captivated by one specific technical indicator, especially when it appears to give a correct XRP price prediction. However, if there’s one piece of advice that my two decades in this field have taught me, it’s that relying on a single indicator can be a dangerous game. You see, each indicator uses different data and methods to generate their signals. The beauty of using multiple indicators is that it allows us to cross-verify these signals, giving us a more accurate prediction.
Take Ripple’s price prediction, for example. If you were to use only the Moving Average (MA), you might find it lagging during a sudden market shift. But what if you combined it with a Relative Strength Index (RSI)? You’d be able to validate the strength of the trend shown by the MA and get insights on overbought or oversold conditions, potentially avoiding premature decisions. This combination of indicators, my friends, is what provides the much-needed depth and dimension to your analysis.
How to Combine Various Indicators for XRP Price Prediction
Now that we’ve established why using multiple indicators is crucial let’s look at how to use them effectively. Here are a few tips on combining technical indicators for a comprehensive analysis of XRP price:
- Complementarity is Key: Choose indicators that complement each other and provide different perspectives. An oscillator like RSI paired with a trend-following indicator like MA can give you a well-rounded view of the market.
- Avoid Redundancy: Using multiple indicators of the same type can lead to redundancy. For instance, using MACD and Stochastic Oscillator, both of which are momentum indicators, may not provide additional useful information.
- Understand the Indicators: Take the time to understand what each indicator measures and the signals it provides. This understanding is key to interpreting their combined messages accurately.
- Find Your Unique Blend: Different combinations work for different traders. Experiment with various pairings and see what provides the best results for your trading style and strategy.
- Validate the Signals: Always cross-check the signals generated by different indicators. A signal confirmed by multiple indicators is more likely to be reliable.
- Maintain a Balanced View: Indicators are tools, not prophets. Always consider the bigger economic and market picture alongside your technical analysis.
Remember, the aim here is not to chase after every signal that an indicator throws at us. Rather, it’s about using these tools judiciously to make educated decisions, to cut through the noise and chaos of the market, and find that sweet spot which tells us, ‘Yes, this is a good move.’
The Pillars of XRP Prediction: Fundamental Factors
As a seasoned crypto enthusiast, I’ve learned that understanding the core principles driving the value of an asset like Ripple is pivotal to making accurate predictions. Beyond technical indicators, it’s crucial to have your finger on the pulse of the fundamental factors. After all, an asset’s future is tied to its present fundamentals. Let’s dive into some of these fundamental aspects that can influence XRP price.
Adoption Rate
The adoption rate of a cryptocurrency is a measure of its acceptance and usage across various strata of society. It includes individual users, businesses, institutions, and even governments. For Ripple (XRP), the adoption rate can be a key determinant of its value. Here are some metrics that can help assess Ripple’s adoption rate:
- Number of Wallets: A high number of active Ripple wallets suggests a large and engaged user base. When more people hold and transact with XRP, it fosters a sense of community and encourages more usage, which could ultimately drive up the price.
- Transaction Volume: The overall volume of XRP transactions is a strong signal of its usage. Higher transaction volumes can be interpreted as increased adoption, as it means more people are using XRP for their transactions.
- Integration with Financial Institutions: Ripple’s primary mission is to streamline international money transfers by making them instant and cost-effective. To this end, partnerships with banks and payment providers are crucial. When a significant financial institution adopts Ripple, it boosts its credibility and could potentially lead to an increase in its price.
- Retail Adoption: When more businesses start accepting XRP as a valid form of payment, it indicates a growing adoption rate. This not only increases the utility of XRP but also introduces more people to the currency, potentially boosting its price.
- Geographic Spread: The wider the geographic reach of XRP, the more diversified its user base. This can reduce volatility and contribute to price stability, which could make it more attractive to potential investors and users.
- Online Sentiment: Social media and online forums are a goldmine of information about public sentiment towards a particular cryptocurrency. When there’s a positive buzz around XRP, it can attract new users and institutional investors, which may contribute to a rise in price.
Regulatory Developments
The regulatory environment for cryptocurrencies is still very much in flux. Changes in regulations can have profound implications for the price of Ripple. Here are some examples of regulatory developments that could impact Ripple’s price:
- Legal Status: The legal status of XRP in major markets around the world is a big factor. If a large market like the US or EU were to outlaw XRP, it could lead to a significant drop in price. Conversely, if a previously closed market opens up to XRP, it could result in a price surge.
- Regulations on Financial Institutions: Banks and financial organisations are subject to strict regulations. These regulations often dictate how these institutions can interact with cryptocurrencies like XRP. If new regulations make it easier for these institutions to adopt XRP, it could lead to an increase in price.
- Tax Laws: Tax laws affect the profitability of investing in cryptocurrencies. If new tax laws make it less profitable to hold or trade XRP, it could drive down demand and cause a decrease in price.
- Security Regulations: The classification of XRP as a security or a commodity can have serious regulatory implications. If it is classified as a security, it will be subject to a different set of regulations, which could affect its price.
Utility
In the world of cryptocurrencies, utility refers to the real-world uses of a given cryptocurrency. For Ripple, this primarily revolves around its use as a medium for fast, inexpensive international money transfers. The more useful XRP is, the more demand there is for it, which can drive up its price. Here are a few examples:
- Use in Remittances: Ripple has found a niche in the remittance market, with some companies using it to facilitate quick, low-cost international money transfers. If more remittance companies start using XRP, it could drive up its demand and price.
- Cross-Border Payments: Banks and financial organisations can use XRP to streamline cross-border payments. The more these institutions adopt Ripple, the higher the demand for XRP, which can lead to an increase in price.
- Use in eCommerce: Some online stores have started accepting XRP as payment. As more businesses follow suit, it could increase the utility and demand for XRP, potentially driving up its price.
- Smart Contracts: While Ripple isn’t primarily known for smart contracts, it does support them. If smart contract usage on the Ripple network grows, it could increase the demand for XRP and drive up its price.
- Interledger Protocol: Ripple’s Interledger Protocol allows for interoperability between different blockchain networks. If more networks start using this protocol, it could boost the demand for XRP, leading to an increase in price.
Market Sentiment in XRP Forecast: How Ripple Price Predictions Work
Market sentiment, also known as investor sentiment, refers to the general attitude of investors towards a particular digital asset or market. In the case of Ripple, positive news can lead to bullish sentiment, which can drive up the price, while negative news can lead to bearish sentiment, causing the price to fall. Here are a few factors to consider when assessing market sentiment for Ripple:
- News about Ripple: News items related to Ripple, whether positive or negative, can have a significant impact on its price. This includes news about partnerships, regulatory developments, technological advancements, and more.
- Market Trends: The general trend in the crypto market can influence the price of Ripple. If the market is bullish, it can drive up the price of XRP, while a bearish market (crypto winter) can lead to a drop in price.
- Investor Sentiment Tools: Various online tools can help gauge the sentiment of investors towards Ripple. These include social media sentiment analysis tools, fear and greed indexes, and more.
- Public Perception: The perception of the public towards Ripple and cryptocurrencies in general can influence its price. A positive perception can lead to increased adoption, driving up the price.
Understanding these fundamental factors can provide valuable insights into the potential future price of Ripple. By considering both technical indicators and fundamental analysis, you can make more informed predictions about the price of XRP. Remember, though, that while these factors can provide guidance, they don’t guarantee the future price of Ripple. Cryptocurrency prices are highly volatile and influenced by a wide range of factors, so always do your own research and consider seeking advice from a financial advisor.
The Bottom Line: Making Your Own XRP Future Price Predictions
Well, we’ve covered a lot of ground here. By now, you should have a better understanding of the factors that influence Ripple’s digital coin price and how to use that knowledge to make your own predictions.
Remember, though, that predicting the price of XRP (or any asset, for that matter) is never a surefire thing. There’s always a degree of uncertainty and risk involved.
FAQ
When Will XRP Price Go Up?
Well, as someone who has been in this field for a while, I’ll tell you straight – anyone who claims to know precisely when Ripple digital coin price, or any other cryptocurrency for that matter, will go up is probably just guessing. Cryptocurrency market is influenced by an array of factors, from macroeconomic trends to regulatory developments. Ripple has a unique role in the financial industry and has partnerships with many institutions, which does provide some potential for growth. Keep a close eye on the news about Ripple, especially developments around its partnerships and adoption.
Should I Buy XRP?
Ah, the million-dollar question! Or should I say, the million-XRP question? Well, here’s my take on it: whether or not you should buy XRP really depends on your personal financial situation, your risk tolerance, and your belief in the technology and team behind Ripple. If you see value in the real-world problems that Ripple is trying to solve and can afford to potentially lose your investment, then it might be worth considering. However, please remember, this is just my perspective, and you should always do your own research, go through technical and fundamental analysis, or consult with a financial advisor before making any investment decisions.
How High Can XRP Price Go?
If I had a Ripple for every time I was asked this question… Jokes aside, predicting the exact future price of Ripple is an impossibility. Ripple’s price potential is closely tied to its adoption rate and its acceptance by banks and financial institutions. If Ripple can become a standard for international transfers, the price could rise significantly. But again, remember, predicting prices in the crypto world is as tricky as trying to predict the weather a year from now!
Will XRP Price Crash Again in 2024?
As a long-term observer of the crypto markets, I’d be lying if I said crashes weren’t part of the journey. Crypto markets are notoriously volatile, and Ripple is no exception. However, whether there will be a crash in 2024 is impossible to predict accurately. A lot depends on the overall crypto market sentiment, regulatory developments, technological advancements, and many other factors. Just remember to stay informed, think long term, and don’t invest money that you can’t afford to lose.