Hello, fellow cryptocurrency enthusiasts! Today, I’ll be your guide on an enthralling adventure, exploring the world of predicting Litecoin (LTC) prices from 2024 to 2030.
Still, it’s no secret that forecasting Litecoin (LTC) price can be a complex task. Therefore, we will delve into Litecoin’s history, including its origin and purpose to comprehend how it has developed into the prominent digital currency it is today. Moreover, we will uncover the methods and instruments used by traders to forecast LTC’s value, taking into account the expert viewpoints in the field.
The high volatility and unpredictability of the digital asset market can pose significant challenges, even for experienced traders. That’s why mastering the art of tech analysis and understanding the various indicators available is crucial for making good investment decisions.
Are you up for an exciting journey into the fascinating world of Litecoin’s price predictions? Keep reading this article to unearth valuable insights into the trends and factors shaping Litecoin’s (LTC) future!
Litecoin (LTC) Overview
| LTC Price | $86.23 |
| LTC Price Change 24h | -0.55% |
| LTC Price Change 7d | 4.37% |
| LTC Market Cap | $6,555,222,304.89 |
| LTC Circulating Supply | 76,023,564.48 |
| LTC Trading Volume 24h | $361,816,563.55 |
| LTC All-Time High (ATH) | $412.96 |
| LTC All-Time Low (ATL) | $1.1137 |
A Brief History: Litecoin and Its Purpose
Litecoin, often referred to as the ‘silver to Bitcoin’s gold,’ emerged in 2011 as a response to some of Bitcoin’s limitations. Created by Charlie Lee, a former Google engineer, Litecoin aimed to improve upon Bitcoin’s technology by offering faster transaction times and lower fees. As a result, Litecoin became an attractive option for everyday transactions and a more accessible entry point for those new to the world of cryptocurrencies. Its design, which incorporates the Scrypt algorithm, also ensures a more decentralized mining process, promoting a fairer distribution of mining rewards and reducing the risk of centralization.
The primary purpose of Litecoin Foundation is to serve as a peer-to-peer digital currency that enables instant, near-zero cost transactions across the globe. It seeks to offer an efficient, secure, and user-friendly alternative to traditional payment methods such as credit cards and bank transfers. By focusing on speed, affordability, and accessibility, Litecoin has carved out its niche within the cryptocurrency landscape, catering to individuals and businesses that require a fast, reliable, and cost-effective means of transferring value.
As a result, Litecoin continues to play a vital role in the ever-evolving entire crypto ecosystem, serving as both a practical transactional currency and a valuable investment asset.
The price of Litecoin has gone through numerous ups and downs in its price history, with some of the most notable rate changes being:
- April 2013: Litecoin experienced its first significant price surge, with its value rising from around $0.03 to $4.40 within a month, marking a remarkable 14,000% increase.
- November 2013: Litecoin’s value soared again during the crypto bull run of 2013, peaking at around $50 per LTC before entering a prolonged bear market.
- May 2017: The cryptocurrency market experienced a massive bull run, and LTC price skyrocketed from around $4 in March to over $30 by the end of May.
- December 2017: In sync with the overall crypto market boom, Litecoin reached an all-time high of approximately $375 during the last quarter of 2017 before facing a significant correction.
- December 2018: Litecoin’s value dipped to its lowest point in years, hitting a bottom of around $23 during the crypto winter.
- June 2019: As the crypto market rebounded, Litecoin’s price experienced a resurgence, reaching a high of about $140 before facing another pullback.
- May 2021: Litecoin reached a new all-time high of around $412 during the market rally in the first half of 2021 before witnessing a notable correction in the following months.
Ltecoin – LTC Price Prediction For Today, Tomorrow, This Week, and Next 30 Days
| Date | Price | Change |
|---|---|---|
| July 01, 2025 | 86.13 | -0.12% |
| July 02, 2025 | 86.24 | 0.13% |
| July 03, 2025 | 85.54 | -0.81% |
| July 04, 2025 | 86.28 | 0.87% |
| July 05, 2025 | 86.59 | 0.36% |
| July 06, 2025 | 86.93 | 0.39% |
| July 07, 2025 | 87.45 | 0.60% |
| July 08, 2025 | 87.82 | 0.42% |
| July 09, 2025 | 87.22 | -0.68% |
| July 10, 2025 | 87.54 | 0.36% |
| July 11, 2025 | 87.19 | -0.40% |
| July 12, 2025 | 86.94 | -0.29% |
| July 13, 2025 | 86.40 | -0.62% |
| July 14, 2025 | 87.08 | 0.79% |
| July 15, 2025 | 86.40 | -0.78% |
| July 16, 2025 | 87.13 | 0.85% |
| July 17, 2025 | 87.74 | 0.70% |
| July 18, 2025 | 88.02 | 0.32% |
| July 19, 2025 | 87.90 | -0.14% |
| July 20, 2025 | 88.75 | 0.97% |
| July 21, 2025 | 88.09 | -0.75% |
| July 22, 2025 | 88.46 | 0.42% |
| July 23, 2025 | 89.23 | 0.87% |
| July 24, 2025 | 88.39 | -0.94% |
| July 25, 2025 | 89.10 | 0.80% |
| July 26, 2025 | 88.53 | -0.64% |
| July 27, 2025 | 88.80 | 0.31% |
| July 28, 2025 | 88.13 | -0.76% |
| July 29, 2025 | 87.32 | -0.91% |
| July 30, 2025 | 88.03 | 0.81% |
Litecoin Price Prediction 2024
After analyzing Litecoin’s future price data for 2024, we found that the projected minimum price is $77.60, while the average and maximum prices are $90.54 and $103.47, respectively.
Our assessment of future returns based on the latest data gathered suggests that Litecoin’s forecast for 2024 is relatively stable, with moderate growth expected.
The narrow price range implies that the market may not anticipate significant fluctuations in value, but there is still potential for substantial returns for those willing to take on high risks associated with investing in Litecoin.
Nonetheless, cryptocurrency investors must be cautious and carry out their own research before making any investment decisions in this space due to the historical volatility of cryptocurrencies and the continuously evolving market landscape.
| Month | Minimum Price | Average Price | Maximum Price |
|---|---|---|---|
| February 2024 | 65.06 | 67.56 | 70.33 |
| March 2024 | 66.81 | 69.38 | 72.22 |
| April 2024 | 68.62 | 71.25 | 74.17 |
| May 2024 | 70.47 | 73.18 | 76.18 |
| June 2024 | 72.37 | 75.15 | 78.23 |
| July 2024 | 74.33 | 77.18 | 80.35 |
| August 2024 | 76.33 | 79.27 | 82.52 |
| September 2024 | 78.39 | 81.41 | 84.74 |
| October 2024 | 80.51 | 83.60 | 87.03 |
| November 2024 | 82.68 | 85.86 | 89.38 |
| December 2024 | 84.92 | 88.18 | 91.80 |
| January 2025 | 87.21 | 90.56 | 94.27 |
January 2024: Litecoin Price Forecast
As we embark on a new year, the forecasting models suggest a sturdy beginning for Litecoin with a minimal price of $63.65, an average hovering around $65.32, and a potential spike to a maximum price of $68.13. This indicates a bullish outset for investors, suggesting that LTC’s fundamentals are gaining solid ground within the crypto community.
LTC Price Forecast for February 2024
February’s forecast for Litecoin shows promising stability in the crypto market. We’re looking at a minimum price of $65.06, which suggests a solid floor for investors to rely on. The average price hitting $67.56 could indicate that market confidence is holding steady, while the maximum price of $70.33 reflects optimism about Litecoin’s growth potential as the year progresses.
March 2024: Litecoin Price Forecast
As spring approaches, Litecoin’s growth seems to be blossoming as well, with our analysis pointing to a slight increase across the board. A minimum price of $66.81 could be indicative of sustained support levels, while the average price reaching $69.38 suggests that consistent demand is driving prices up. A maximum price of $72.22 might signal that Litecoin is gearing up for a bullish quarter.
LTC Price Forecast for April 2024
April’s forecast for Litecoin prices continues to build on the positive momentum observed in the previous months. With the minimum price expected to be around $68.62, it reflects a growing trust in Litecoin’s stability. The average price moves up to $71.25, hinting at a bullish sentiment among traders, and the maximum price of $74.17 could be the result of speculative optimism in the market.
May 2024: Litecoin Price Forecast
Heading into May, the expected minimum price of Litecoin is $70.47, representing a robust baseline that could attract more conservative investors. An average price of $73.18 reflects a healthy market trend, and the maximum price projection of $76.18 points towards the potential for significant gains for the more risk-tolerant traders.
LTC Price Forecast for June 2024
June brings in a whiff of positivity with the Litecoin market anticipated to climb further. The minimum price level holds strong at $72.37, suggesting that any dips are seen as buying opportunities. The average price soaring to $75.15 indicates a steady climb in investor interest, and the maximum price reaching $78.23 could be a hint at an impending bullish run.
July 2024: Litecoin Price Forecast
Midyear analysis predicts a sunny outlook for Litecoin with the minimum price forecasted at $74.33. This upward trend is echoed by an average price estimate of $77.18, showcasing continued market approval. The potential for a maximum price of $80.35 could be signaling that Litecoin is becoming a hot summer pick for crypto enthusiasts.
LTC Price Forecast for August 2024
As we drift into August, Litecoin’s price is expected to float upwards, setting a minimum price forecast at $76.33. The average price nudging up to $79.27 could indicate that the market is riding a wave of steady growth. A maximum price reaching $82.52 may suggest that investors are increasingly optimistic about Litecoin’s performance.
September 2024: Litecoin Price Forecast
September’s forecast for Litecoin looks particularly strong, with the minimum price pushing up to $78.39. This could be due to a persistent demand for the cryptocurrency. The average price at $81.41 hints at a robust market sentiment, and a maximum price of $84.74 could suggest that some traders are expecting a significant upside.
LTC Price Forecast for October 2024
As autumn sets in, Litecoin’s prices are not falling; they’re expected to stand firm with a minimum price of $80.51. The average price is forecasted at $83.60, perhaps reflecting a market that’s cautiously optimistic. A maximum price of $87.03 could indicate that some investors are predicting a strong pre-winter rally.
November 2024: Litecoin Price Forecast
November’s forecast sees Litecoin holding its ground with a minimum price of $82.68. The average price of $85.86 is a strong indicator that the market sentiment remains positive. The maximum price stretching to $89.38 suggests that there might be some speculative peaks as investors aim to capitalize on end-of-year rallies.
LTC Price Forecast for December 2024
Concluding the year, December’s forecast for Litecoin looks merry with a minimum price of $84.92, showing remarkable year-end support. The average price climbing to $88.18 suggests that there is sustained confidence among investors, and the maximum price of $91.80 paints a picture of a potentially prosperous finish to the year for Litecoin holders.
Litecoin (LTC) Price Prediction 2025
As we look ahead to 2025, expert opinions suggest that LTC price might reach a peak of $209. However, the price could also experience a downturn to approximately $148.12. With these factors in mind, the anticipated average trading price is estimated to be $178.56.
| Month | Minimum Price | Average Price | Maximum Price |
|---|---|---|---|
| February 2025 | 148.12 | 153.81 | 160.12 |
| March 2025 | 152.12 | 157.97 | 164.44 |
| April 2025 | 156.23 | 162.23 | 168.88 |
| May 2025 | 160.45 | 166.61 | 173.44 |
| June 2025 | 164.78 | 171.11 | 178.13 |
| July 2025 | 169.23 | 175.73 | 182.94 |
| August 2025 | 173.80 | 180.48 | 187.87 |
| September 2025 | 178.49 | 185.35 | 192.95 |
| October 2025 | 183.31 | 190.35 | 198.16 |
| November 2025 | 188.26 | 195.49 | 203.51 |
| December 2025 | 193.34 | 200.77 | 209.00 |
| January 2026 | 198.56 | 206.19 | 214.65 |
Litecoin (LTC) Price Prediction 2026
For 2026, market analysts predict that Litecoin cryptocurrency could attain a maximum price of $277.09, but it might also face a decline to roughly $196.38. Taking these Litecoin predictions into account, the estimated average trading price is calculated to be $236.73.
| Month | Minimum Price | Average Price | Maximum Price |
|---|---|---|---|
| February 2026 | 196.38 | 203.92 | 212.28 |
| March 2026 | 201.68 | 209.43 | 218.01 |
| April 2026 | 207.12 | 215.08 | 223.90 |
| May 2026 | 212.72 | 220.89 | 229.95 |
| June 2026 | 218.46 | 226.85 | 236.15 |
| July 2026 | 224.36 | 232.98 | 242.53 |
| August 2026 | 230.42 | 239.27 | 249.08 |
| September 2026 | 236.64 | 245.73 | 255.80 |
| October 2026 | 243.03 | 252.36 | 262.71 |
| November 2026 | 249.59 | 259.18 | 269.80 |
| December 2026 | 256.33 | 266.17 | 277.09 |
| January 2027 | 263.25 | 273.36 | 284.57 |
Litecoin (LTC) Price Prediction 2027
Predictions for 2027 indicate that Litecoin’s price may achieve a high of $367.36. On the other hand, the price could potentially fall to around $260.35. As a result, the projected average trading price for 2027 is set at $313.85.
| Month | Minimum Price | Average Price | Maximum Price |
|---|---|---|---|
| February 2027 | 260.35 | 270.36 | 281.44 |
| March 2027 | 267.38 | 277.66 | 289.04 |
| April 2027 | 274.60 | 285.15 | 296.85 |
| May 2027 | 282.02 | 292.85 | 304.86 |
| June 2027 | 289.63 | 300.76 | 313.09 |
| July 2027 | 297.45 | 308.88 | 321.55 |
| August 2027 | 305.48 | 317.22 | 330.23 |
| September 2027 | 313.73 | 325.79 | 339.14 |
| October 2027 | 322.20 | 334.58 | 348.30 |
| November 2027 | 330.90 | 343.62 | 357.70 |
| December 2027 | 339.84 | 352.89 | 367.36 |
| January 2028 | 349.01 | 362.42 | 377.28 |
LTC Price Prediction 2028
In 2028, expert forecasts suggest that Litecoin’s price could climb to a peak of $487.04, while the minimum price could dip to approximately $345.17. Consequently, the anticipated average trading price for 2028 is estimated to be $416.105.
| Month | Minimum Price | Average Price | Maximum Price |
|---|---|---|---|
| February 2028 | 345.17 | 358.43 | 373.13 |
| March 2028 | 354.49 | 368.11 | 383.20 |
| April 2028 | 364.06 | 378.05 | 393.55 |
| May 2028 | 373.89 | 388.26 | 404.18 |
| June 2028 | 383.99 | 398.74 | 415.09 |
| July 2028 | 394.35 | 409.51 | 426.30 |
| August 2028 | 405.00 | 420.56 | 437.81 |
| September 2028 | 415.94 | 431.92 | 449.63 |
| October 2028 | 427.17 | 443.58 | 461.77 |
| November 2028 | 438.70 | 455.56 | 474.23 |
| December 2028 | 450.55 | 467.86 | 487.04 |
| January 2029 | 462.71 | 480.49 | 500.19 |
Litecoin (LTC) Price Prediction 2029
As we approach 2029, market experts predict that Litecoin might reach a maximum price of $645.71 but could also experience a decrease to around $457.62. With these factors in mind, the projected average trading price for 2029 is calculated to be $551.66.
| Month | Minimum Price | Average Price | Maximum Price |
|---|---|---|---|
| February 2029 | 457.62 | 475.20 | 494.69 |
| March 2029 | 469.98 | 488.03 | 508.04 |
| April 2029 | 482.67 | 501.21 | 521.76 |
| May 2029 | 495.70 | 514.74 | 535.85 |
| June 2029 | 509.08 | 528.64 | 550.32 |
| July 2029 | 522.83 | 542.91 | 565.17 |
| August 2029 | 536.94 | 557.57 | 580.43 |
| September 2029 | 551.44 | 572.63 | 596.11 |
| October 2029 | 566.33 | 588.09 | 612.20 |
| November 2029 | 581.62 | 603.97 | 628.73 |
| December 2029 | 597.32 | 620.27 | 645.71 |
| January 2030 | 613.45 | 637.02 | 663.14 |
LTC Price Prediction 2030
For 2030, industry specialists anticipate Litecoin’s price to hit a high of $856.06, with the possibility of a decline to roughly $606.7. Considering these predictions, the estimated average trading price for 2030 is set at $731.38.
| Month | Minimum Price | Average Price | Maximum Price |
|---|---|---|---|
| February 2030 | 606.70 | 630.01 | 655.84 |
| March 2030 | 623.08 | 647.02 | 673.55 |
| April 2030 | 639.91 | 664.49 | 691.74 |
| May 2030 | 657.18 | 682.43 | 710.41 |
| June 2030 | 674.93 | 700.86 | 729.60 |
| July 2030 | 693.15 | 719.78 | 749.29 |
| August 2030 | 711.87 | 739.22 | 769.53 |
| September 2030 | 731.09 | 759.18 | 790.30 |
| October 2030 | 750.83 | 779.67 | 811.64 |
| November 2030 | 771.10 | 800.73 | 833.56 |
| December 2030 | 791.92 | 822.34 | 856.06 |
| January 2031 | 813.30 | 844.55 | 879.17 |
Litecoin (LTC) Price USD Prediction (2031)
In 2031, expert opinions suggest that Litecoin’s price might reach a peak of $1134.95, while the minimum price could potentially fall to approximately $804.35. As a result, the anticipated average trading price for 2031 is estimated to be $969.65.
| Month | Minimum Price | Average Price | Maximum Price |
|---|---|---|---|
| February 2031 | 804.35 | 835.26 | 869.50 |
| March 2031 | 826.07 | 857.81 | 892.98 |
| April 2031 | 848.38 | 880.97 | 917.09 |
| May 2031 | 871.28 | 904.76 | 941.85 |
| June 2031 | 894.81 | 929.19 | 967.28 |
| July 2031 | 918.97 | 954.27 | 993.40 |
| August 2031 | 943.78 | 980.04 | 1,020.22 |
| September 2031 | 969.26 | 1,006.50 | 1,047.77 |
| October 2031 | 995.43 | 1,033.68 | 1,076.06 |
| November 2031 | 1,022.31 | 1,061.59 | 1,105.11 |
| December 2031 | 1,049.91 | 1,090.25 | 1,134.95 |
| January 2032 | 1,078.26 | 1,119.69 | 1,165.59 |
LTC Price Prediction 2032
As we look forward to 2032, market analysts predict that Litecoin could achieve a maximum price of $1504.7, but it might also face a downturn to roughly $1066.4. Taking these forecasts into account, the projected average price for 2032 is calculated to be $1285.55.
| Month | Minimum Price | Average Price | Maximum Price |
|---|---|---|---|
| February 2032 | 1,066.40 | 1,107.37 | 1,152.78 |
| March 2032 | 1,095.19 | 1,137.27 | 1,183.90 |
| April 2032 | 1,124.76 | 1,167.98 | 1,215.87 |
| May 2032 | 1,155.13 | 1,199.51 | 1,248.69 |
| June 2032 | 1,186.32 | 1,231.90 | 1,282.41 |
| July 2032 | 1,218.35 | 1,265.16 | 1,317.03 |
| August 2032 | 1,251.25 | 1,299.32 | 1,352.59 |
| September 2032 | 1,285.03 | 1,334.40 | 1,389.11 |
| October 2032 | 1,319.73 | 1,370.43 | 1,426.62 |
| November 2032 | 1,355.36 | 1,407.43 | 1,465.14 |
| December 2032 | 1,391.95 | 1,445.43 | 1,504.70 |
| January 2033 | 1,429.54 | 1,484.46 | 1,545.32 |
The Main Questions Of Critical Thinking When We Talk About Litecoin Price Forecast
When discussing the Litecoin price forecast, the following main critical thinking questions can help you gain a better understanding and make more informed investment decisions:
- What are the underlying factors driving Litecoin cost, and how might they change in the future? Consider the role of market sentiment, technology improvements, adoption, competition, and regulatory changes in shaping Litecoin’s price.
- How reliable are the sources of Litecoin rate forecasts, and what methodologies do they use? Evaluate the credibility of the expert opinions, analytical resources, and algorithms used to make price forecasts, and consider any potential biases or limitations in their methods.
- What is the potential impact of price volatility and external factors on the future price of Litecoin? Assess the risks associated with the unpredictable nature of the digital asset market, global economic events, and geopolitical developments that could influence Litecoin’s price.
By asking these critical thinking questions, you can better understand the various opinions and predictions about Litecoin’s future price, and make more well-informed investment decisions regarding your investments.
Litecoin (LTC) Future Price Predictions by Experts
When it comes to Litecoin price forecasts, it’s always fascinating to hear the perspectives of well-known financial experts and crypto experts too.
- Wallet Investor: Wallet Investor’s one-year price forecast for Litecoin price today was around $300. Their five-year prediction estimated LTC price could reach approximately $800.
- DigitalCoinPrice: DigitalCoinPrice predicted that Litecoin price would reach around $250 by the end of 2024 and could rise to approximately $450 by 2025.
- Bobby Lee: The co-founder of BTCC, China’s first cryptocurrency exchange, Bobby Lee, predicted in 2017 that Litecoin could reach $10,000 in the long term. However, it’s unclear if he still holds this view given the market’s evolution since then.

Bobby Lee
- PrimeXBT: PrimeXBT, a popular cryptocurrency trading platform, predicts that Litecoin could reach between $500 and $600 in the mid-term and might go beyond $1,000 in the long-term if the market conditions remain favorable and Litecoin continues to see increased adoption.
- Long Forecast: Long Forecast, a platform that provides long-term financial forecasts, has a relatively conservative outlook on Litecoin’s future price. They predicted that Litecoin’s price could range from around $160 to $280 in 2024. Their long-term projection for 2025 was between $150 and $260.
- Trading Beasts: Trading Beasts, another platform providing cryptocurrency price predictions, estimated that Litecoin would reach an average price of around $290 by the end of 2024. Their long-term prediction for 2024 indicated an average price of approximately $420.
- John McAfee: The founder of McAfee Associates, John McAfee, was known for his bold predictions. Although he did not provide a specific price target for Litecoin, he did mention on Twitter that he expected Litecoin’s value to increase significantly. However, please note that John McAfee passed away in 2021, and his predictions should be taken with caution.

John McAfee
- George Tung: A cryptocurrency expert and co-founder of Cryptos R Us, George Tung, predicted in 2018 that Litecoin’s price could reach $1,500 by the end of 2020. It’s important to note that this prediction did not materialize, and it’s uncertain whether he still holds this opinion.
- CoinPriceForecast: CoinPriceForecast, a cryptocurrency price prediction platform, projected that Litecoin could reach around $310 by the end of 2024. Their long-term forecast suggests that Litecoin’s price could hit approximately $520 by 2025 and $780 by 2030.
- Crypto Ground: Crypto Ground, another platform providing price forecasts, predicted that Litecoin would reach about $260 by the end of 2024. Their five-year projection estimates the price to be around $750.
- Gov Capital: Gov Capital, a platform offering financial forecasts, projected that Litecoin would reach approximately $280 by the end of 2024. Their five-year prediction indicated that the price could increase to around $1,300.
Decoding the Charts: Technical Price Analysis
Technical analysis is a method used by traders and investors to forecast the price movements of financial assets, such as stocks, commodities, or cryptocurrencies, by analyzing historical price data and patterns.
Unlike fundamental analysis, which focuses on the intrinsic value of an asset, tech analysis is based on the assumption that historical price movements can provide insights into future price behavior.
Here are some key concepts and tools used in technical analysis:
- Price charts: Technical analysts use various types of rate charts, such as line charts, bar charts, and candlestick charts, to visualize historical price data and identify patterns or trends.
- Trend analysis: Identifying the overall trend is a critical aspect of tech analysis. Traders look for uptrends (a series of higher highs and higher lows) or downtrends (a series of lower highs and lower lows) to determine the market’s direction.
- Support and resistance levels: Support levels are price points where an asset’s price has historically had difficulty falling below, while resistance levels are points where the price has had difficulty rising above. These levels can help traders identify potential entry and exit points for trades.
- Technical indicators: Technical analysts use various mathematical indicators to gain insights into market trends and momentum. Some common indicators include moving averages, (RSI), moving average convergence divergence (MACD), and Bollinger Bands.
- Chart patterns: Technical analysts look for specific chart patterns that may suggest price movements. Examples of chart patterns include head and shoulders, double tops and bottoms, triangles, and flags.
- Volume analysis: Analyzing trade volume can provide insights into the strength or weakness of price movements. High volume during a price increase can signal strong buying interest, while low volume during a price decline may indicate weak selling pressure.
- Timeframes: Technical analysts can apply their methods to various timeframes, from intraday charts to weekly or monthly charts, depending on their trading style and objectives.
Technical Analysis: Navigating the World of Litecoin’s Price Prediction
We’ll touch on the origins and purposes of these indicators, go over the most common ones employed for predicting LTC worth, and even give you some practical examples of how they can be put to use.
With this newfound knowledge at your fingertips, you’ll be better prepared to tackle the wild ride that is the market. So, let’s get ready to dive in and refine our own research and trade strategies with the ultimate goal of making smarter and more profitable investment decisions.
The Origin and Purpose of Technical Indicators
Technical indicators have their roots in the field of tech analysis, which has been in use since the late 19th century. Charles Dow, the founder of Dow Jones & Company, is considered one of the pioneers in tech analysis. His theories, known as Dow Theory, formed the foundation for modern technical analysis. Over time, various analysts and traders have developed numerous technical indicators to assist in the study of historical price movements and other market-related data.
The primary purpose of technical indicators is to help traders and investors make informed investment decisions about when to enter or exit trades, as well as predict future price movements. These indicators are derived from mathematical calculations using historical data, such as price and trading volume. Technical indicators serve as a tool to gauge market sentiment, identify trends, and recognize patterns in price behavior. By doing so, you can make better-informed investment decisions and potentially capitalize on market opportunities.
Importance of Technical Indicators in Predicting Litecoin Price
Technical indicators are essential for predicting Litecoin price due to their ability to analyze historical price movements, trading volume, and other relevant market data. These indicators can help traders identify trends and patterns, which can provide valuable insights into the future direction of Litecoin price.
Using technical indicators allows traders to make data-driven decisions and filter out market noise, which can help increase the chances of success in their trades. Since the digital asset market is highly volatile, utilizing tech analysis and indicators becomes even more crucial for predicting price movements and managing risk.
For instance, if a specific technical indicator signals an upcoming bullish trend in Litecoin, a trader might consider buying LTC in anticipation of a price increase. Conversely, if the indicator points to a bearish trend, the trader might sell their LTC holdings or avoid entering a long position.
There are many technical indicators used in crypto trading to predict the price movements of different cryptocurrencies. Here are some of the most popular technical indicators for predicting Litecoin price:
- Moving Averages (MAs)
- Relative Strength Index (RSI)
- Moving Average Convergence Divergence (MACD)
- Bollinger Bands
- Stochastic Oscillator
- Parabolic SAR (Stop and Reverse)
- Ichimoku Cloud
- Fibonacci Retracement
- Average Directional Index (ADX)
- On Balance Volume (OBV)
- Rate of Change (ROC)
- Commodity Channel Index (CCI)
- Accumulation/Distribution Line (A/D Line)
- Pivot Points
- Chaikin Money Flow (CMF)
- Aroon Indicator
- Gann Fan
- Keltner Channel
- Money Flow Index (MFI)
- TRIX
- The Zig Zag indicator
- Detrended Price Oscillator (DPO)
- Vortex Indicator (VI)
- Elder’s Force Index (EFI)
- Williams %R
These indicators, when used in conjunction with one another, can provide a more comprehensive understanding of the Litecoin market, allowing us to make more accurate Litecoin price predictions ourselves, and improve our overall trade strategy on crypto exchanges.
In the following section, I’ll share with you the essential indicators that I’ve found particularly helpful in my own trade journey, and I’ll provide real-life examples of how to apply them to Litecoin prediction.
Moving Averages (MAs) – Can We Indicate Litecoin Future Price?
The Moving Average (MA) is one of the simplest technical indicators. It is a mathematical calculation that smooths out price action over a given period of time, allowing traders to identify trends in the market. The most common types of MAs for predicting Litecoin’s rate are the Simple Moving Average (SMA) and the Exponential Moving Average (EMA).
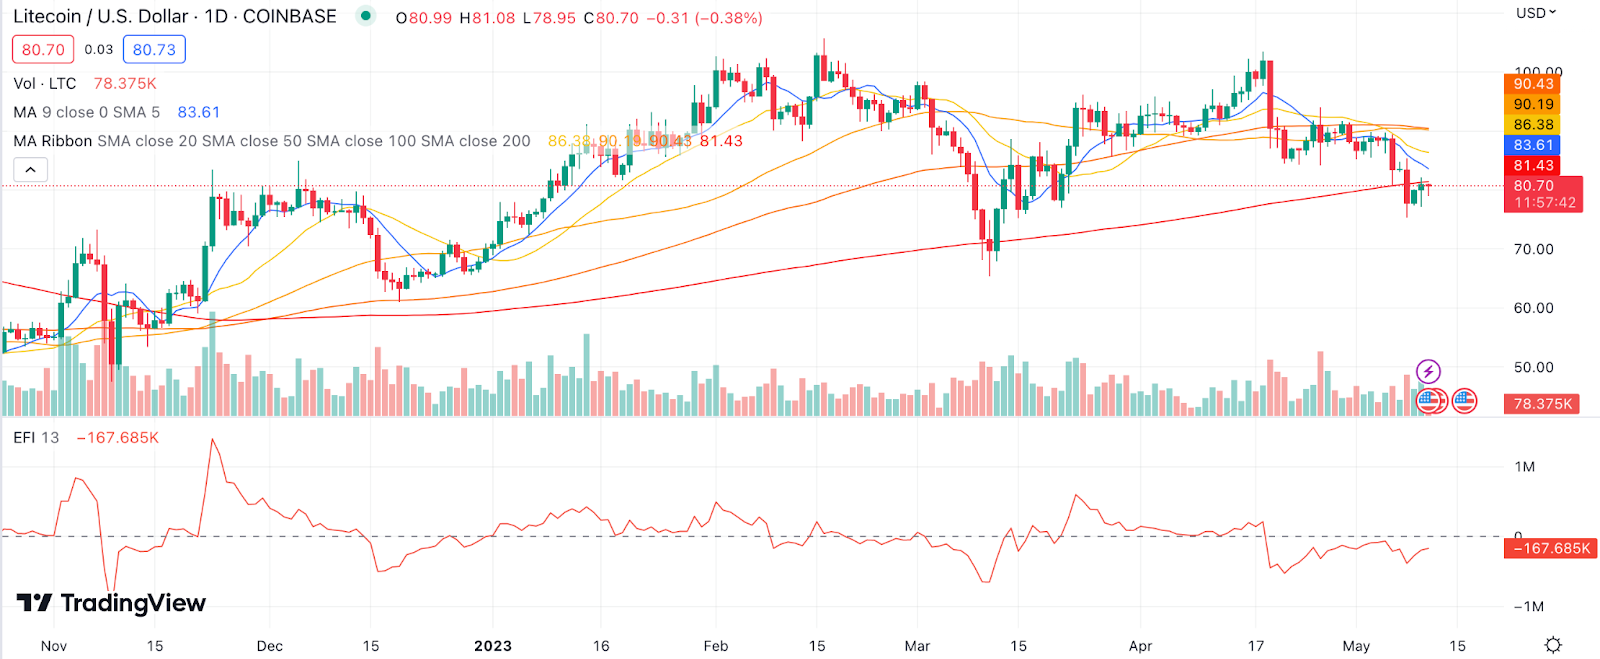
Example: One should use a 50-day SMA to identify the long-term trend of the Litecoin rate chart. If LTC price is trading above the 50-day SMA, it could be considered a bullish signal, while trading below the 50-day SMA could be considered a bearish signal.
Relative Strength Index (RSI) – RSI Litecoin (LTC) Price Prediction
The RSI is a momentum indicator that compares the magnitude of recent gains to recent losses in an attempt to determine overbought and oversold conditions of crypto assets. The RSI ranges from 0 to 100 and is typically considered overbought when above 70 and oversold when below 30.

Example: A trader might use the RSI to identify oversold conditions in Litecoin price, and buy the dip if the RSI reaches 30 or below. Conversely, if the RSI reaches 70 or above, it could be considered overbought, and a trader might consider taking profits or selling short.
Moving Average Convergence Divergence (MACD) – MACD Litecoin (LTC) Prediction
The MACD is a trend-following momentum indicator that uses moving averages to identify changes in momentum. It is calculated by subtracting the 26-day EMA from the 12-day EMA.

Example: MACD is used to identify bullish or bearish crossovers between the 12-day and 26-day EMAs. When the 12-day EMA crosses above the 26-day EMA, it could be considered a bullish signal for LTC, while a cross below could be considered a bearish signal.
Bollinger Bands – For Litecoin (LTC) Price Prediction
Bollinger Bands are a price volatility indicator that consists of a moving average and two standard deviations plotted above and below the moving average. They are used to identify overbought and oversold conditions, as well as to determine the strength and direction of a trend.

Example: Let’s say you want to use Bollinger Bands to identify periods of low volatility in Litecoin price. If the price is trading within the upper and lower bands, it could be considered a period of consolidation. If the price breaks above the upper band, it could be considered a bullish signal, while a break below the lower band could be considered a bearish signal.
Stochastic Oscillator for Litecoin (LTC) Price Prediction
The Stochastic Oscillator is a momentum indicator that compares the closing price of an asset to its price range over a given period of time. It is calculated as a percentage and ranges from 0 to 100.
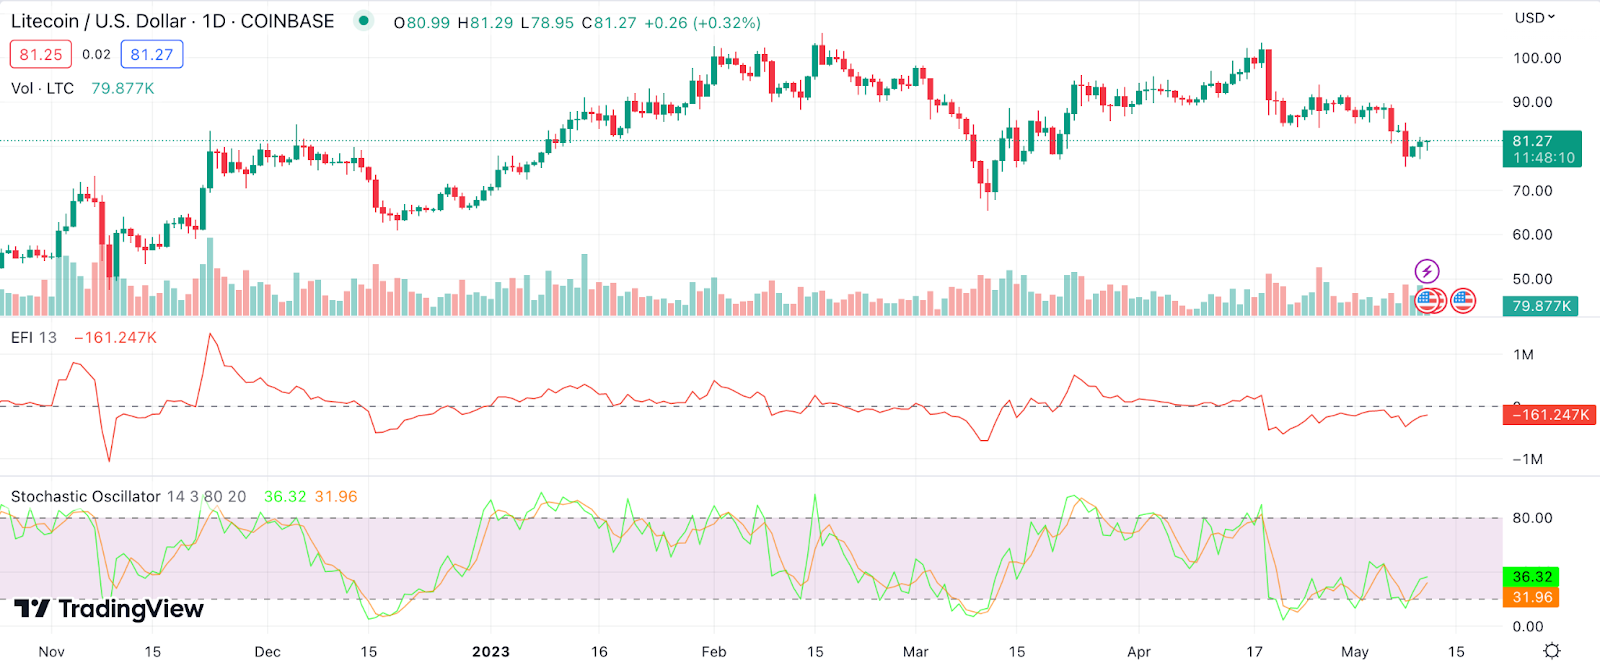
Example: Stochastic Oscillator is another indicator used to identify oversold or overbought conditions in Litecoin pricing. If the Stochastic Oscillator is below 20, it could be considered oversold, while above 80 could be considered overbought.
Parabolic SAR (Stop and Reverse) for Litecoin (LTC) Price Prediction
The Parabolic SAR is a trend-following indicator that identifies potential reversals in price direction. It is plotted as a series of dots above or below price action.
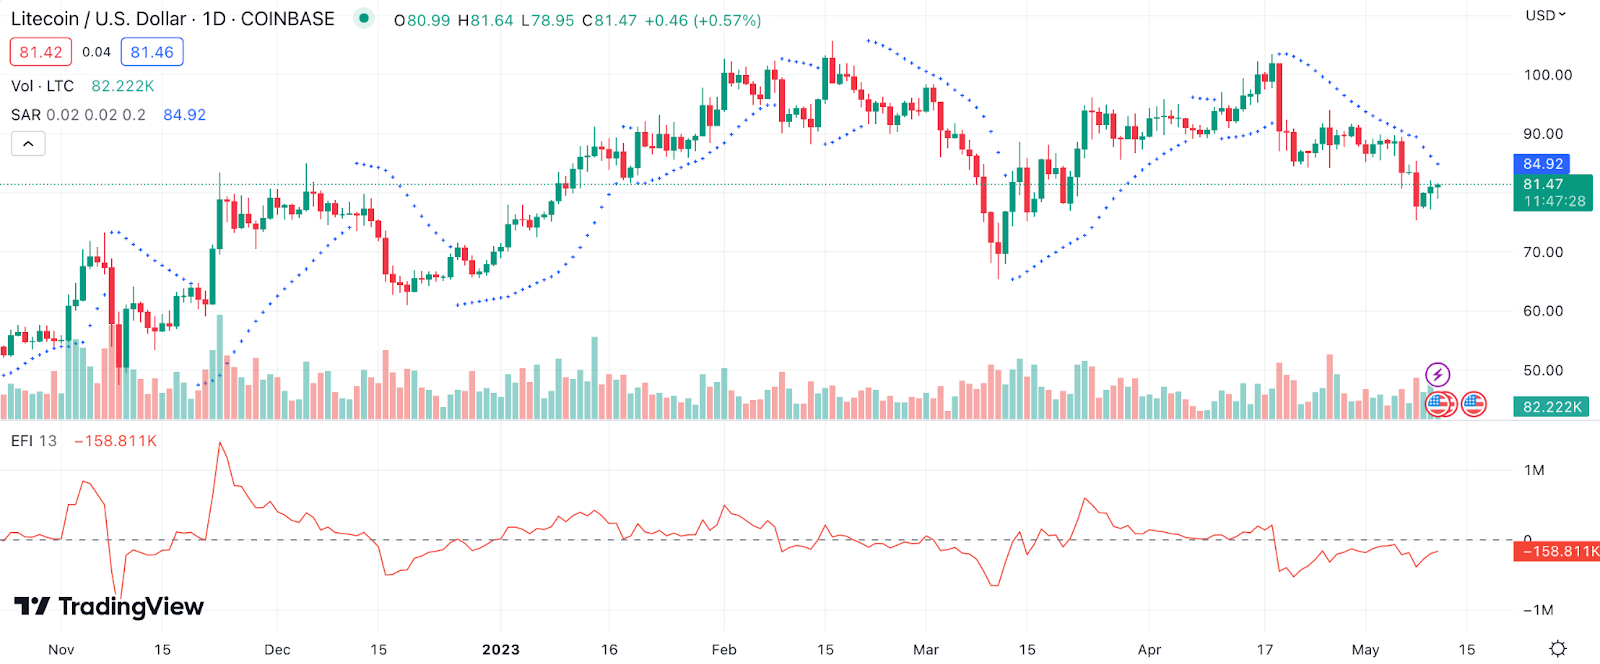
Example: Parabolic SAR is a perfect indicator to identify potential entry or exit points in Litecoin price. If the dots are below price action, it could be considered a bullish signal, while above could be considered bearish.
Ichimoku Cloud for Litecoin (LTC) Price Prediction
The Ichimoku Cloud indicator, also known as the Ichimoku Kinko Hyo, is a technical indicator that helps traders to identify potential areas of support and resistance in a security’s price movement. The indicator is made up of five lines, including the Tenkan-sen (conversion line), Kijun-sen (base line), Chikou Span (lagging line), Senkou Span A and Senkou Span B (leading span A and B). The space between the two Senkou lines is referred to as the ‘cloud,’ which provides a visual representation of the area of support or resistance.
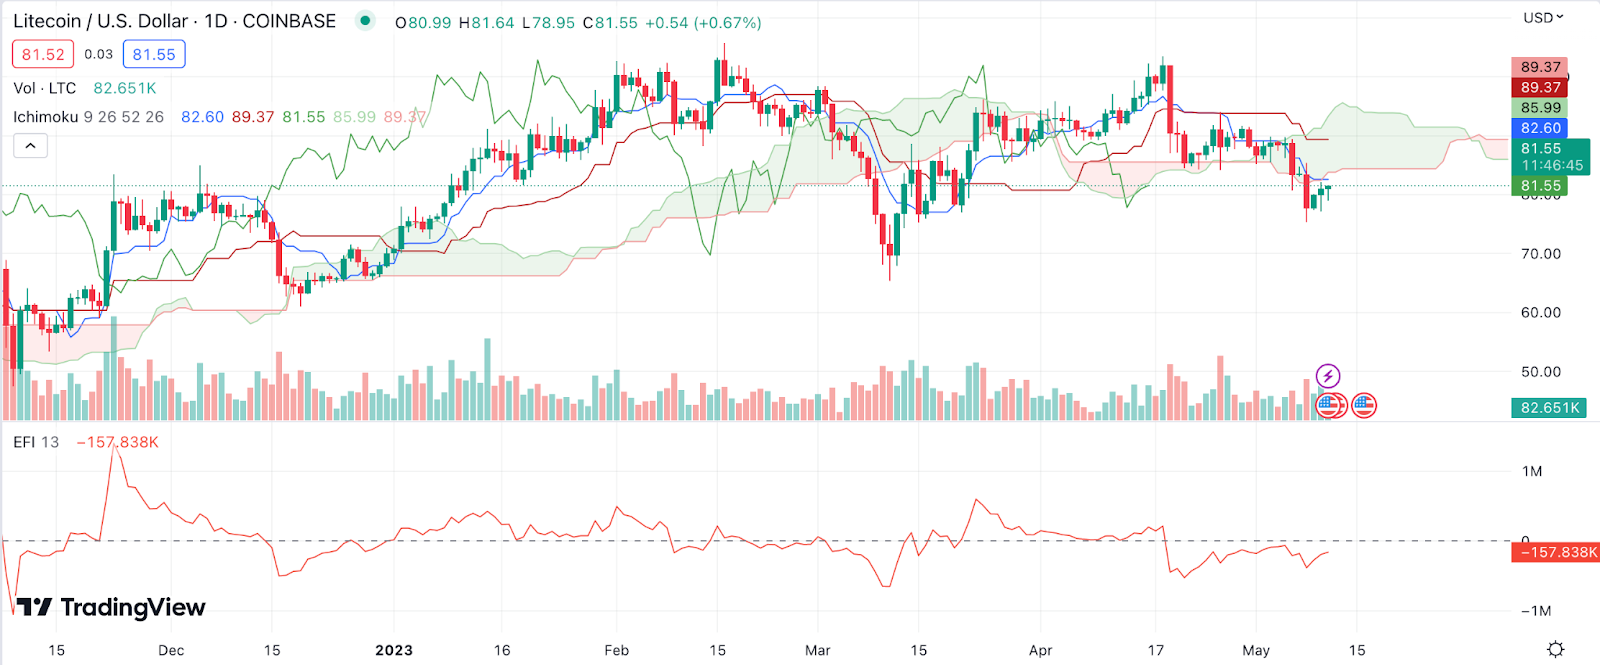
Example: If the price of Litecoin (LTC) is above the cloud, it is considered bullish, and if it’s below the cloud, it’s considered bearish. You can also use the crossover of the Tenkan-sen and Kijun-sen lines to identify potential trend reversals.
Fibonacci Retracement for Litecoin (LTC) Price Prediction
The Fibonacci retracement is a technical indicator that uses horizontal lines to indicate areas of support or resistance at the key Fibonacci levels before the price continues in its original direction. The Fibonacci levels are calculated using the high and low points of a security’s price movement. The key Fibonacci levels are 23.6%, 38.2%, 50%, 61.8%, and 100%.
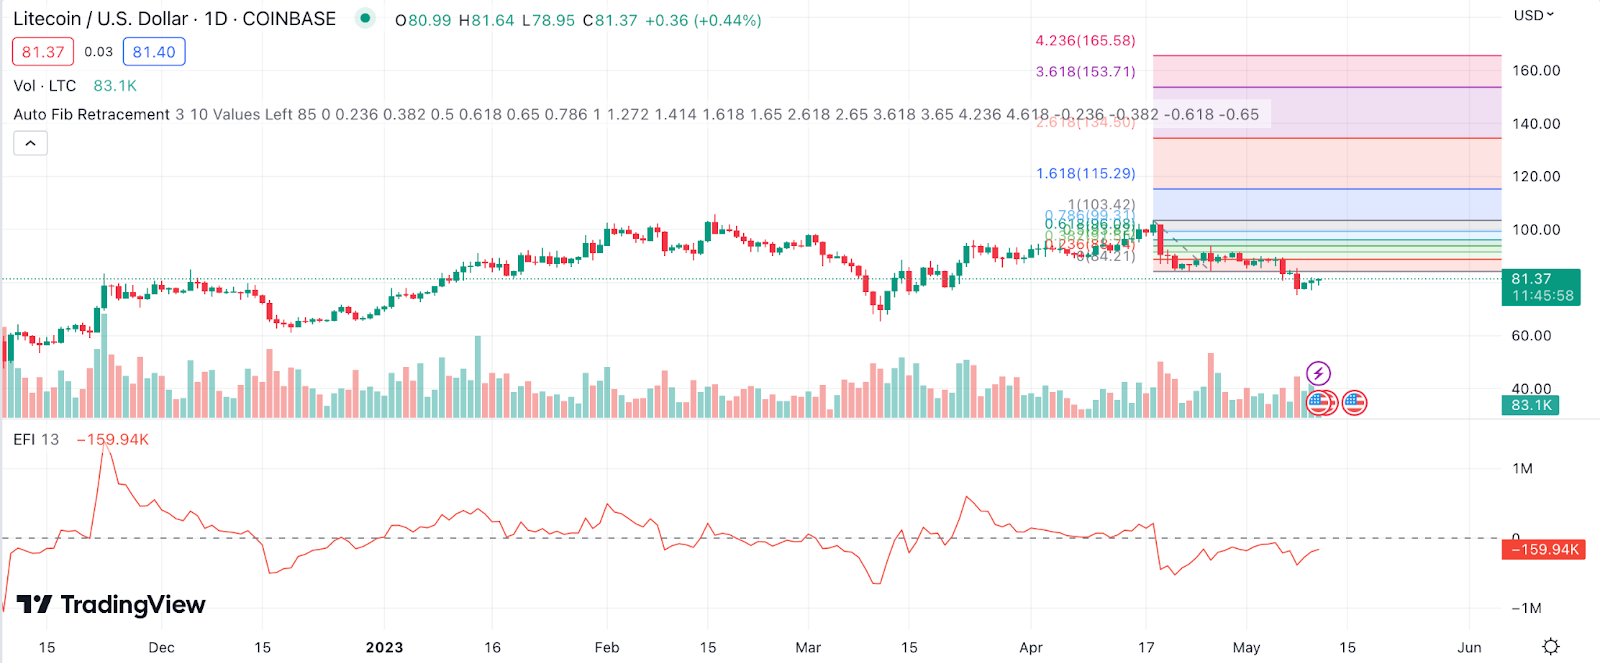
Example: If the price of Litecoin (LTC) is in an uptrend and begins to retrace, traders can use the Fibonacci retracement to identify potential areas of support where the price may continue in its upward direction. You may look for price action signals or other technical indicators to confirm your trades when the price reaches these key levels.
Average Directional Index (ADX) for Litecoin (LTC) Price Prediction
The Average Directional Index (ADX) is a technical indicator that measures the strength of a security’s trend. The ADX ranges from 0 to 100, with a reading above 25 indicating a strong trend and a reading below 20 indicating a weak trend.
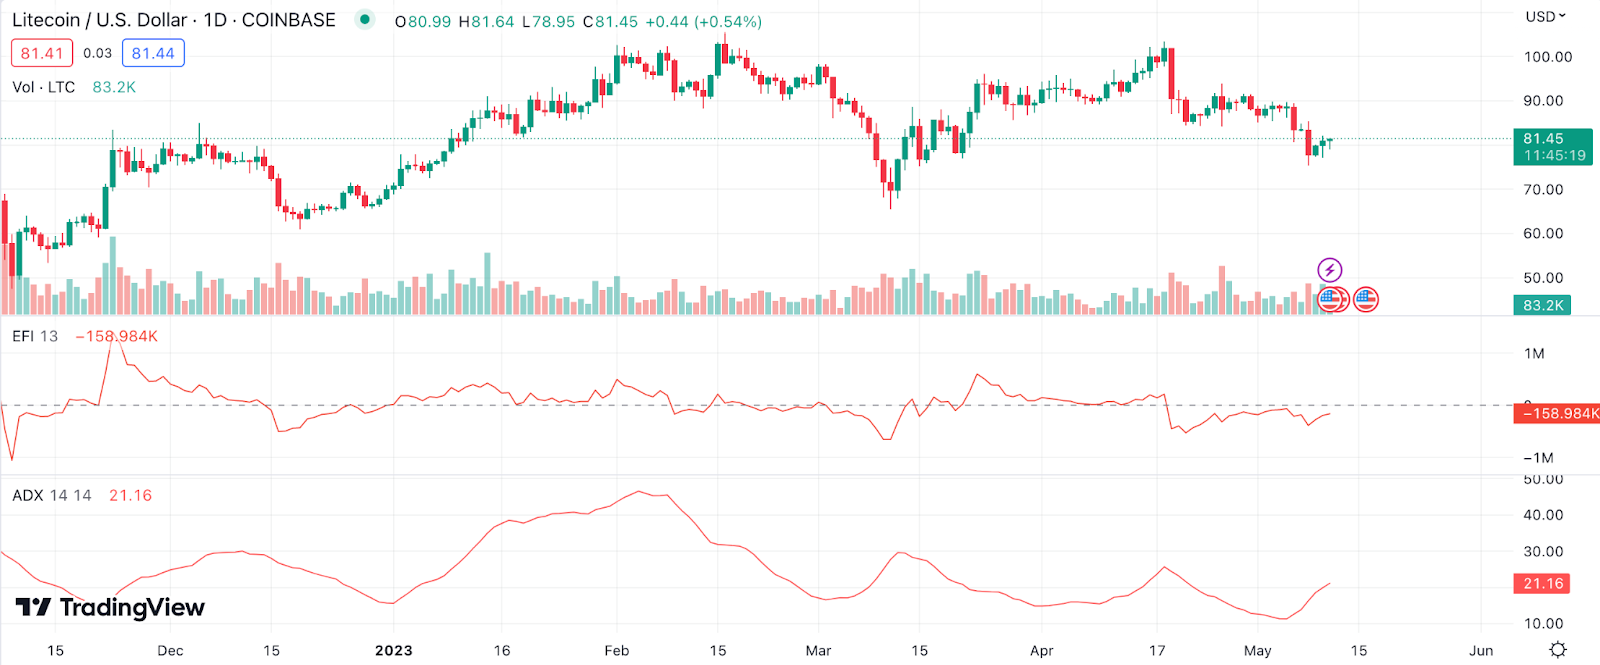
Example: If the ADX reading for Litecoin (LTC) is above 25, it suggests that there is a strong trend in the price movement, and you may look for entry points in the direction of the trend. On the other hand, if the ADX reading is below 20, it suggests that the price is moving sideways, and you may look for other technical indicators to help identifying potential trading opportunities.
On Balance Volume (OBV) for Litecoin (LTC) Price Prediction
The On Balance Volume (OBV) is a technical indicator that measures buying and selling pressure by adding or subtracting the volume of a security’s price movement. If the price of Litecoin (LTC) closes higher than the previous close, OBV will add the volume to the cumulative total. If the price closes lower than the previous close, OBV will subtract the volume from the cumulative total.
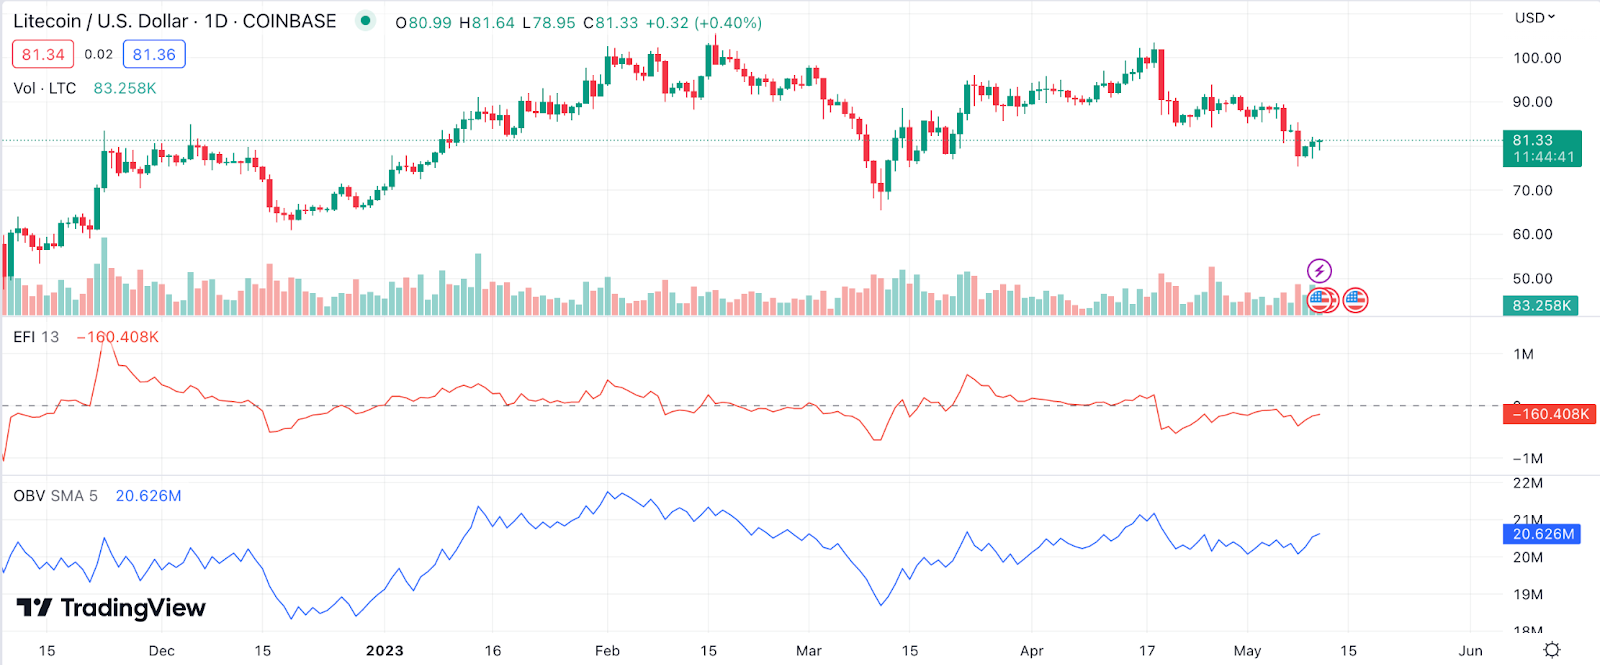
Example: If the price of Litecoin is in an uptrend, and OBV is also increasing, it suggests that there is buying pressure in the market. You may look for entry points in the direction of the trend. On the other hand, if the price is in a downtrend, and the OBV is decreasing, it suggests that there is selling pressure in the market, and you may look for short-selling opportunities.
Rate of Change (ROC) for Litecoin (LTC) Price Prediction
The Rate of Change (ROC) is a momentum indicator that measures the percentage change in a security’s price over a specified period. ROC can help traders identify overbought or oversold conditions in the market.

Example: When assessing Litecoin price using ROC, if the indicator moves above a certain threshold (e.g., 10%), it could indicate overbought conditions, signaling that a price correction may be imminent. Conversely, if ROC falls below a specific level (e.g., -10%), it might suggest oversold conditions, presenting a potential buying opportunity.
Commodity Channel Index (CCI) for Litecoin (LTC) Price Prediction
CCI is a momentum-based oscillator that measures the deviation of an asset’s price from its average price, relative to its typical price fluctuations. Traders use the CCI to identify overbought and oversold conditions. A high CCI (above +100) suggests an overbought condition, while a low CCI (below -100) indicates an oversold condition.

Example: When Litecoin’s CCI crosses above +100, it signals an overbought condition, which could be followed by a price correction. This may prompt investors to take profits or wait for a better entry point before buying more.
Accumulation/Distribution Line (A/D Line) for Litecoin (LTC) Price Prediction
The A/D Line is a volume-based indicator that takes into account both the price and volume of an asset to provide insights into buying and selling pressure. By comparing the closing price to the high and low prices of a trading period, the A/D Line helps traders gauge whether the market is accumulating (buying) or distributing (selling) the asset.
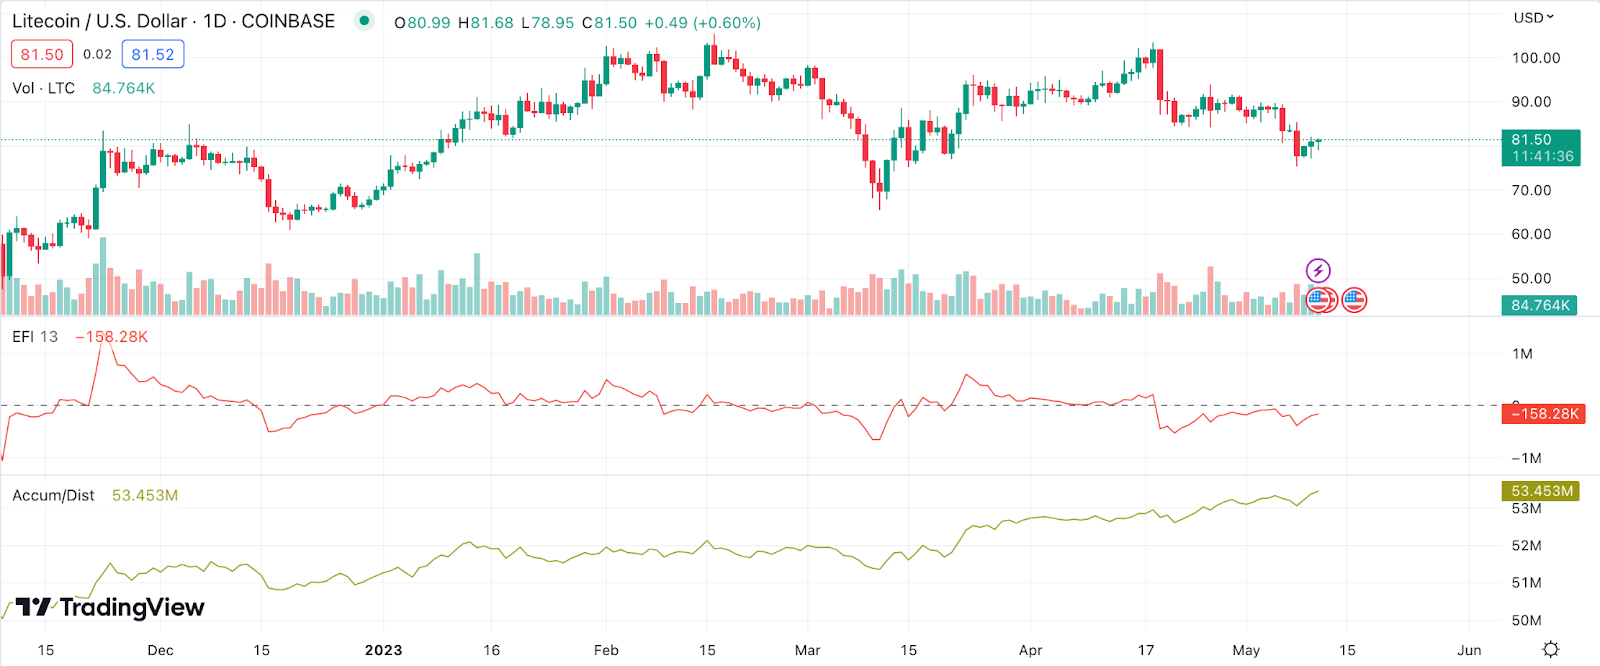
Example: If Litecoin’s A/D Line starts to rise, it indicates increased buying pressure, which could lead to an upward price movement. Investors may interpret this as a buying opportunity or a sign of a potential bullish trend.
Pivot Points for Litecoin (LTC) Price Prediction
Pivot Points are widely used by traders to identify potential support and resistance levels during a specific trading period. They are calculated using the previous period’s high, low, and closing prices and can be applied on various timeframes, such as daily, weekly, or monthly charts.
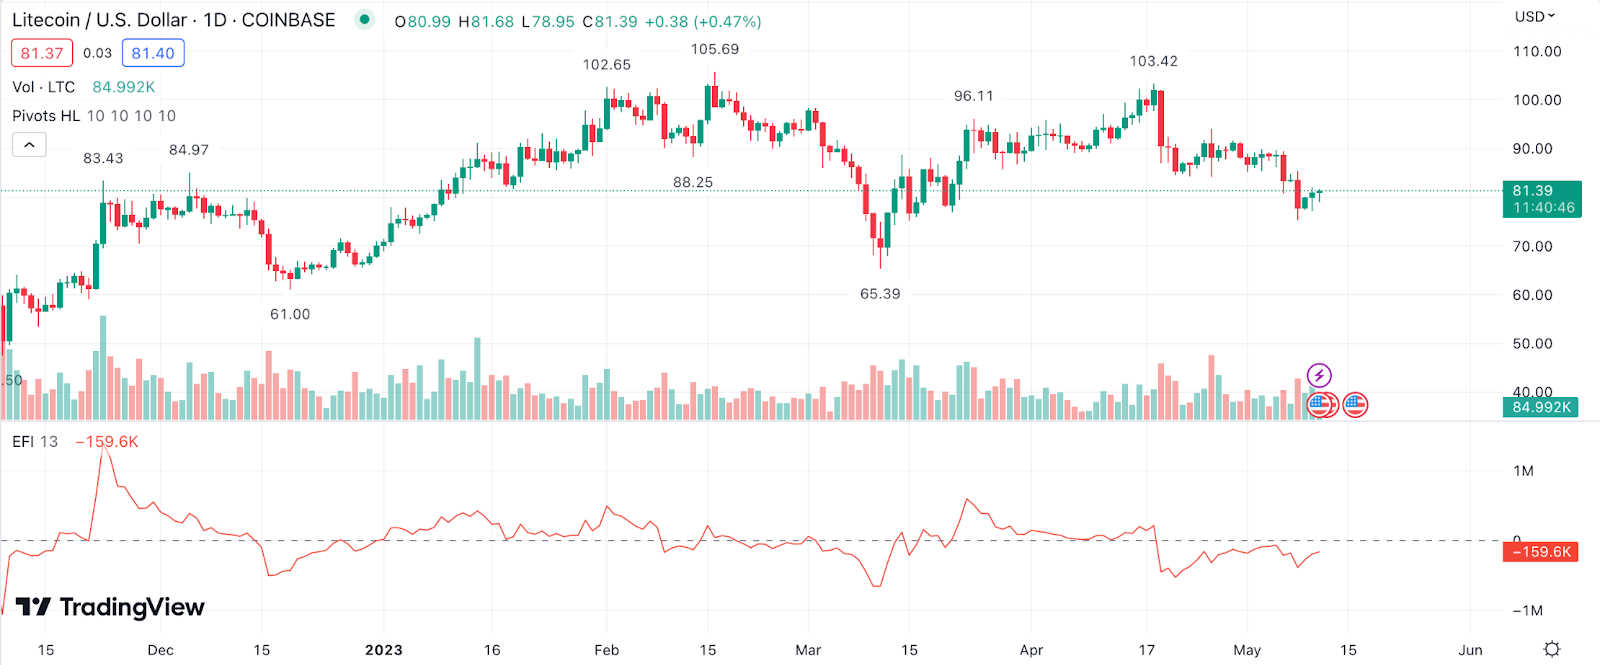
Example: If Litecoin price finds support at a daily pivot point and bounces back, it could indicate a possible entry point for investors who believe the price will continue to rise. Pivot points can also help in setting stop-loss orders and profit targets.
Chaikin Money Flow (CMF) for Litecoin Price Prediction
CMF is a volume-weighted oscillator that measures the flow of money in and out of an asset by comparing its closure price to its high and low prices over a specific period. A positive CMF indicates buying pressure, while a negative CMF suggests selling pressure. The CMF value oscillates between -1 and +1, making it easy to identify changes in buying and selling pressure.
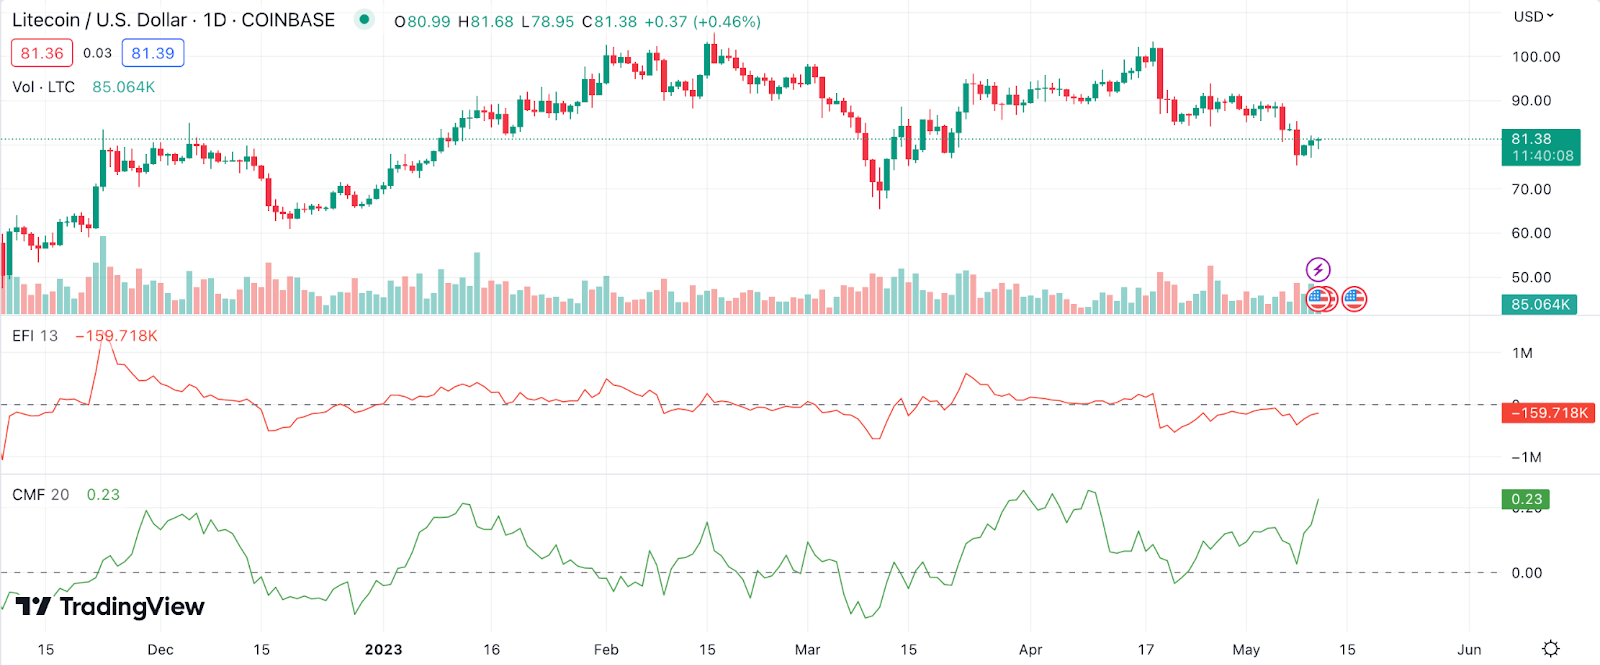
Example: If Litecoin’s CMF turns positive, it signals increased buying pressure, which could lead to a potential uptrend in LTC price. Investors may use this as a signal to enter long positions or monitor the asset for further confirmation of a bullish trend.
Aroon Indicator for Litecoin Price Prediction
The Aroon Indicator is designed to identify the strength of a trend and potential trend reversals. It consists of two separate lines: Aroon Up and Aroon Down, which measure the number of periods since the most recent high and low, respectively. The values of both lines oscillate between 0 and 100.
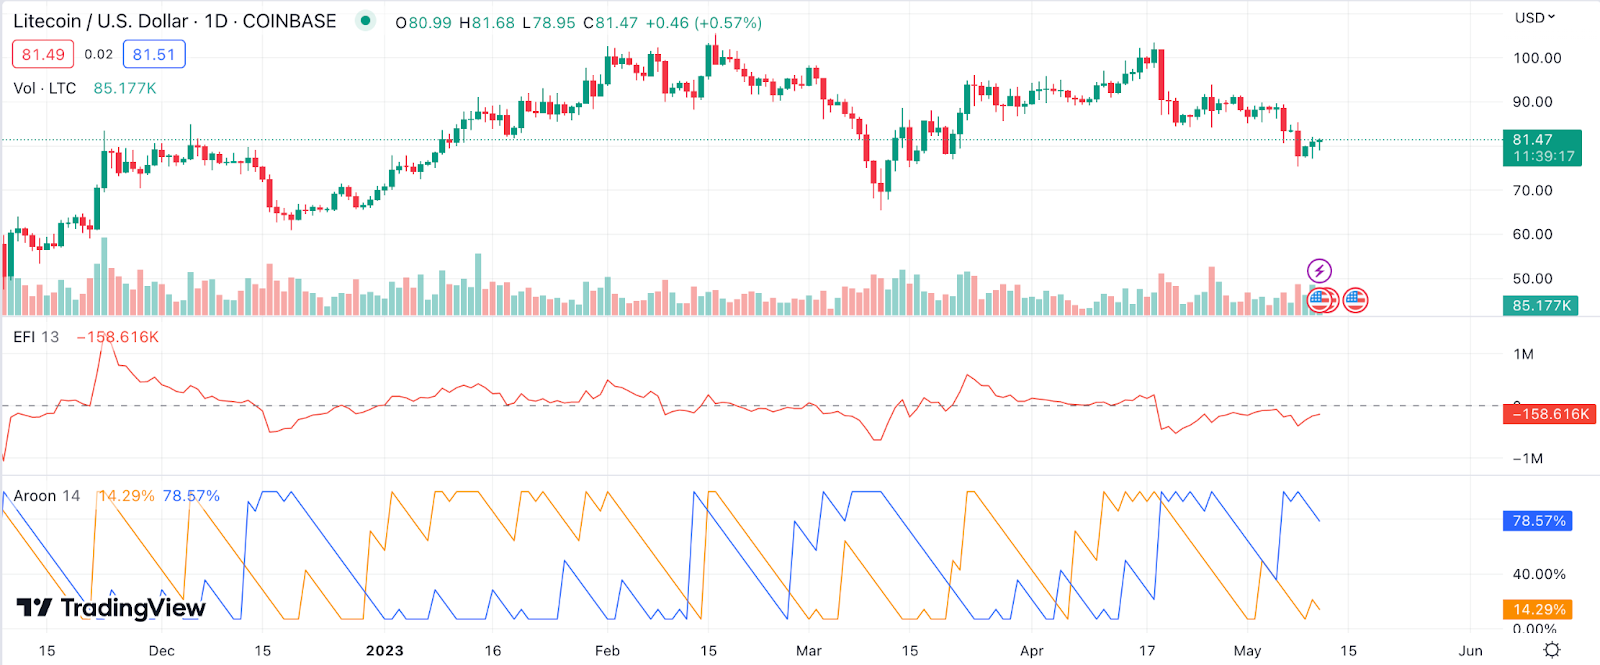
Example: When Litecoin’s Aroon Up line crosses above the Aroon Down line, it could indicate a potential bullish trend reversal. Investors may consider entering a long position or monitoring the asset for further confirmation of the emerging uptrend.
Gann Fan for Litecoin Price Prediction
Gann Fan is a tech analysis tool based on the theories of W.D. Gann, a famous trader and analyst. The Gann Fan consists of a series of diagonal lines drawn from a significant high or low point on the price chart. These lines represent potential support and resistance levels and can help traders identify trend direction and potential reversal points.
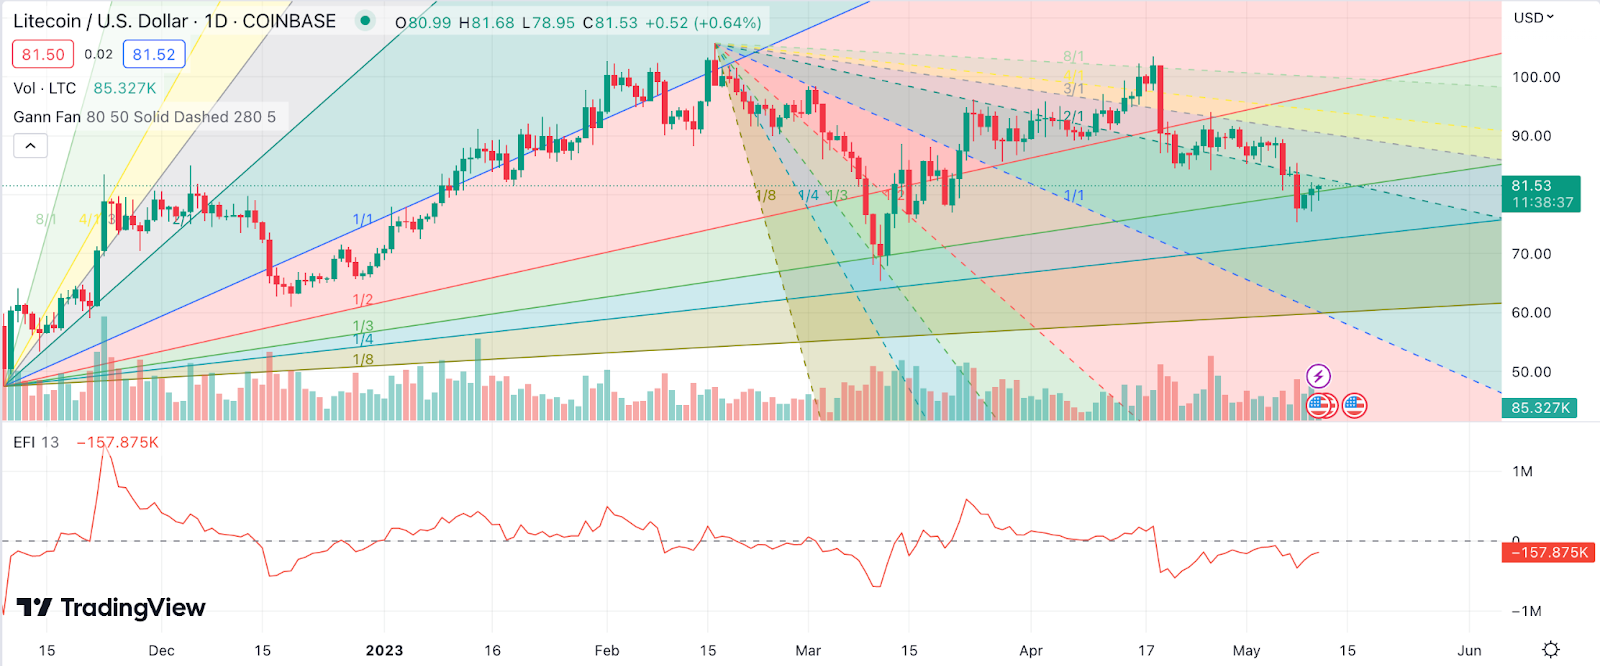
Example: If Litecoin price bounces off a Gann Fan line, it could indicate support at that level, suggesting a potential continuation of the current value trend. Traders may use this information to adjust their positions or consider entering new trades based on the trend’s direction.
Keltner Channel for Litecoin Price Prediction
Keltner Channel is a volatility-based indicator that consists of three lines: the middle line (an exponential moving average), and the upper and lower lines, which are based on the average true range (ATR). The indicator helps traders identify overbought and oversold conditions, potential breakouts, and trend reversals.
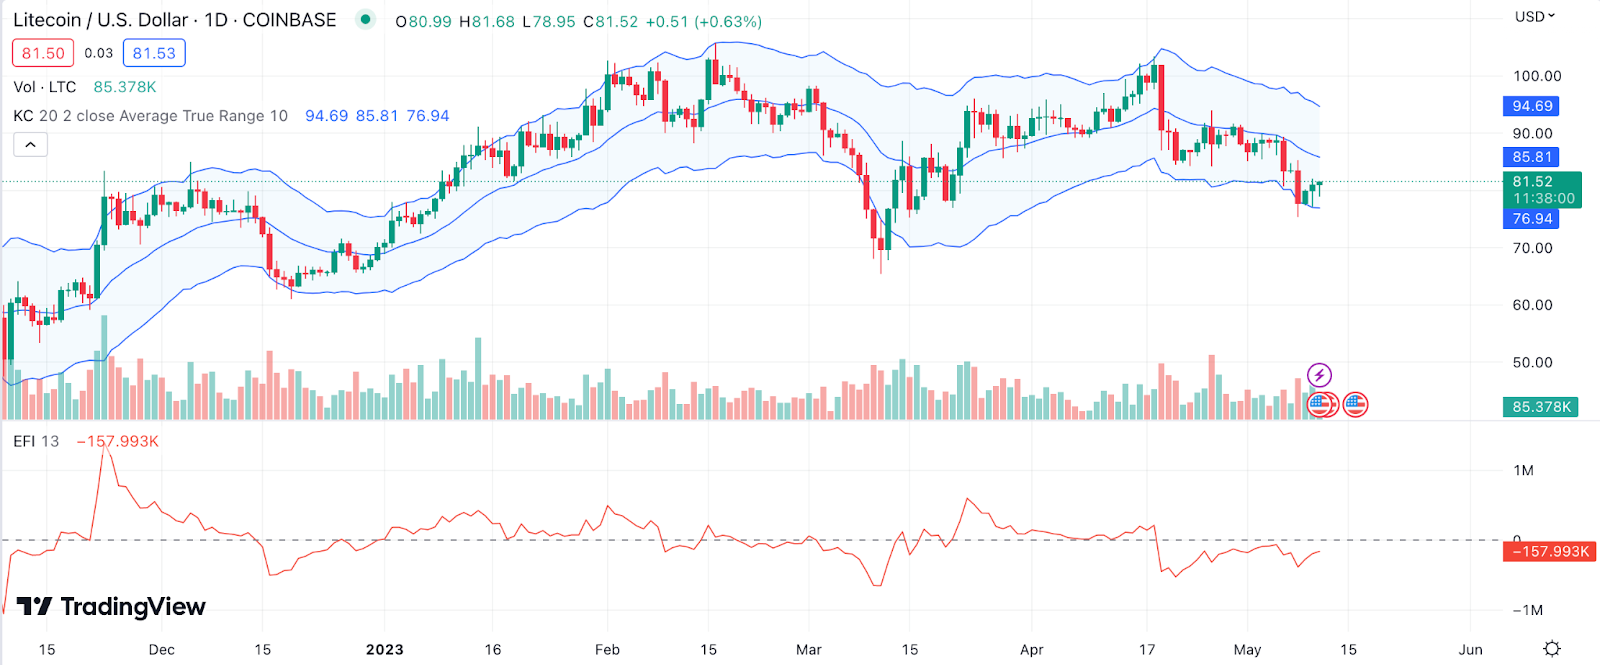
Example: If Litecoin price touches the upper Keltner Channel line, it could signal an overbought condition, which might be followed by a price pullback. Traders can use this information to adjust their positions or consider taking profits if they believe a correction is likely.
Money Flow Index (MFI) for Litecoin Price Prediction
MFI is a momentum oscillator that measures the flow of money into and out of an asset by considering both price and volume data. It oscillates between 0 and 100 and can help traders identify overbought and oversold conditions. An MFI value above 80 indicates an overbought condition, while an MFI value below 20 suggests an oversold condition.

Example: When Litecoin’s MFI falls below 20, it indicates an oversold condition, which could be a potential buying opportunity for traders who believe the price will reverse and move higher.
TRIX for Litecoin Price Prediction
TRIX is a momentum oscillator that measures the percentage rate of change of a triple exponentially smoothed moving average of an asset’s price. It helps traders identify potential trend reversals and confirm existing trends. A positive TRIX value indicates upward momentum, while a negative TRIX value suggests downward momentum.
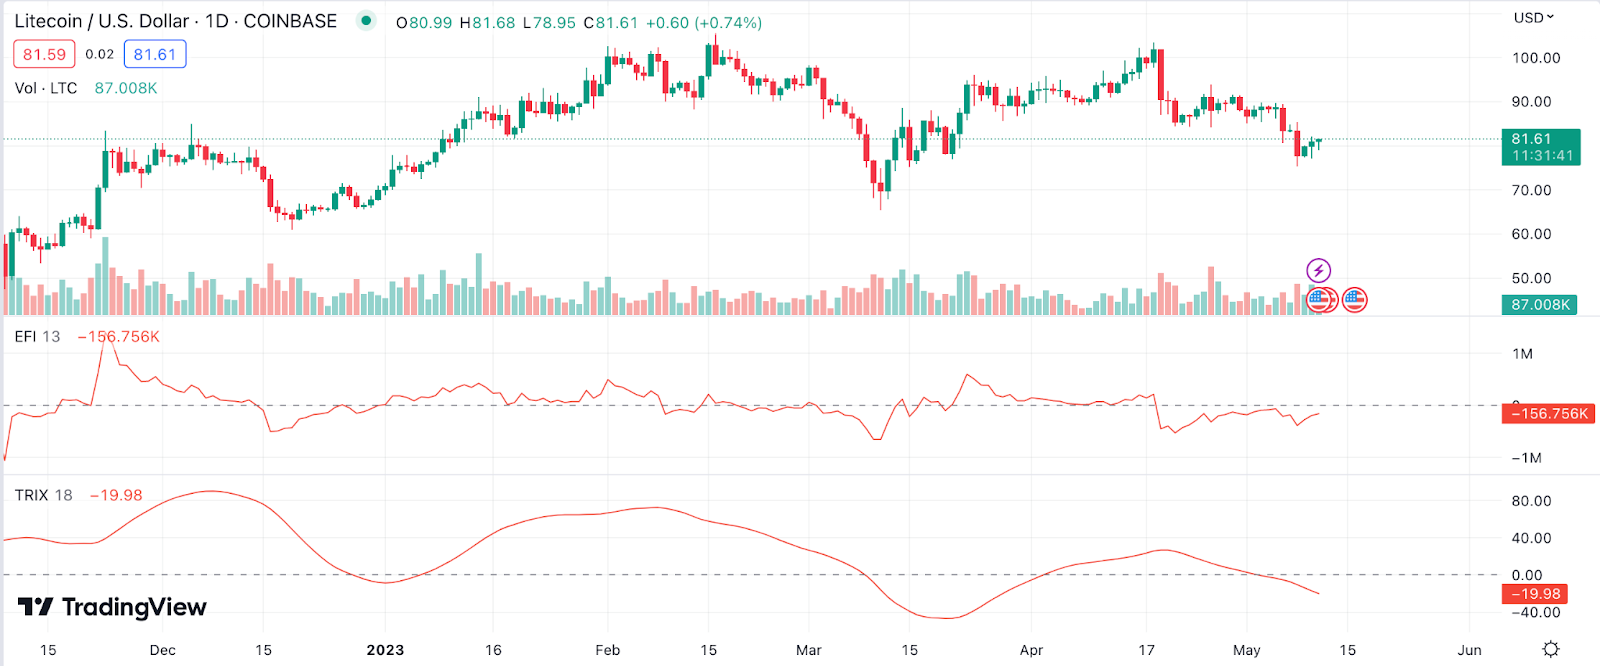
Example: If Litecoin’s TRIX line crosses above the zero line, it signals a potential bullish trend reversal or a continuation of an existing uptrend. Investors may use this indicator to enter long positions or monitor the asset for further confirmation of the trend’s direction.
The Zig Zag Indicator for Litecoin Price Prediction
The Zig Zag indicator helps traders identify trend reversals and filter out minor price fluctuations by connecting significant high and low points on a Litecoin price chart. The indicator is not predictive but can be used in conjunction with other tech analysis tools to analyze price trends and identify potential trading opportunities.
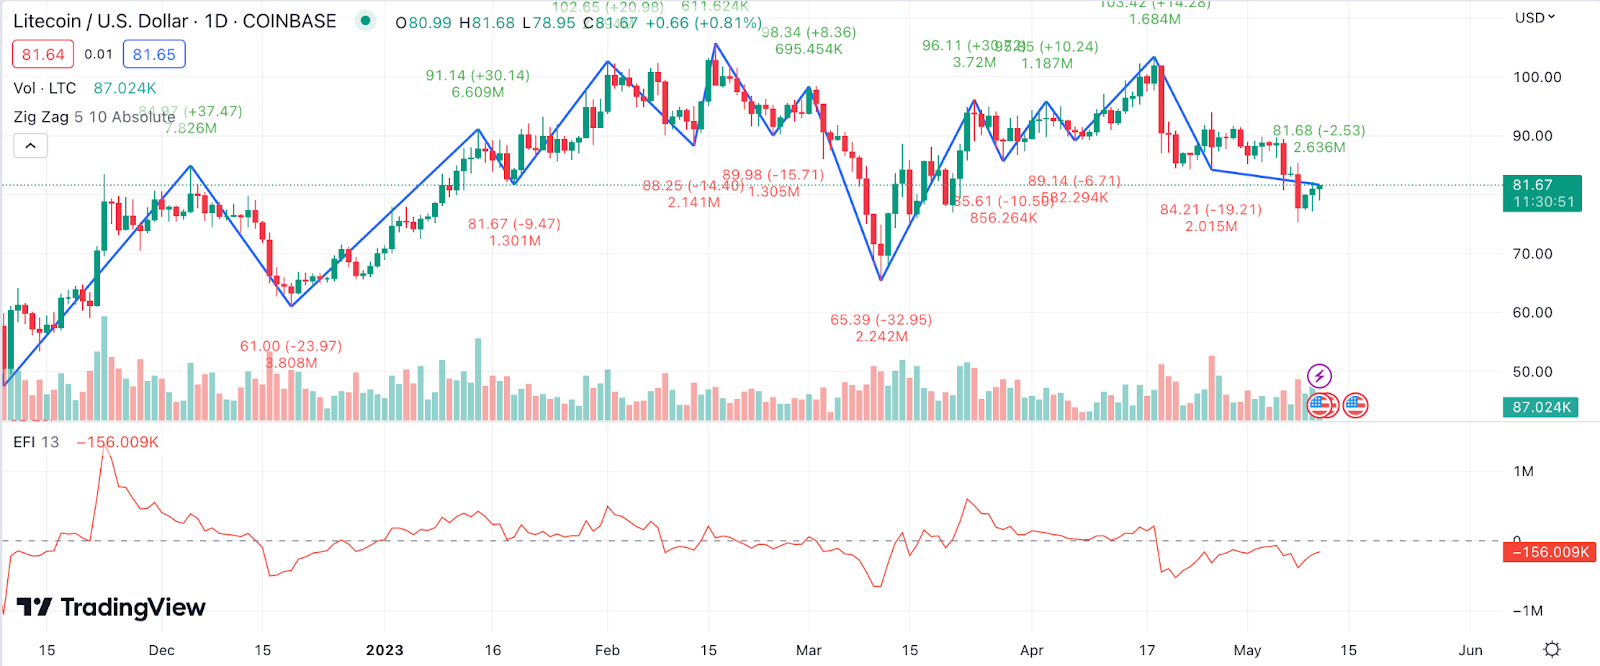
Example: When Litecoin’s Zig Zag indicator forms a new low followed by a higher low, it could suggest the beginning of an uptrend. Traders can use this information in combination with other indicators to confirm the trend’s direction and consider entering long positions.
Detrended Price Oscillator (DPO) for Litecoin Price Prediction
The Detrended Price Oscillator (DPO) is an indicator that helps identify cycles and overbought or oversold conditions by removing the trend from the price data. DPO is calculated by subtracting a moving average from the price and helps to identify short-term price cycles while filtering out long-term trends.

Example: If Litecoin’s DPO crosses above the zero line, it can suggest a short-term bullish cycle. In this situation, you could look for potential buying opportunities, especially if other technical indicators confirm the bullish signal.
Vortex Indicator (VI) for Litecoin Price Prediction
The Vortex Indicator (VI) is a tech analysis tool that measures trend strength and direction by comparing the range of an asset’s high and low prices over a specified period. The indicator consists of two lines, the VI+ and VI-, which help identify bullish and bearish trends as well as potential trend reversals.
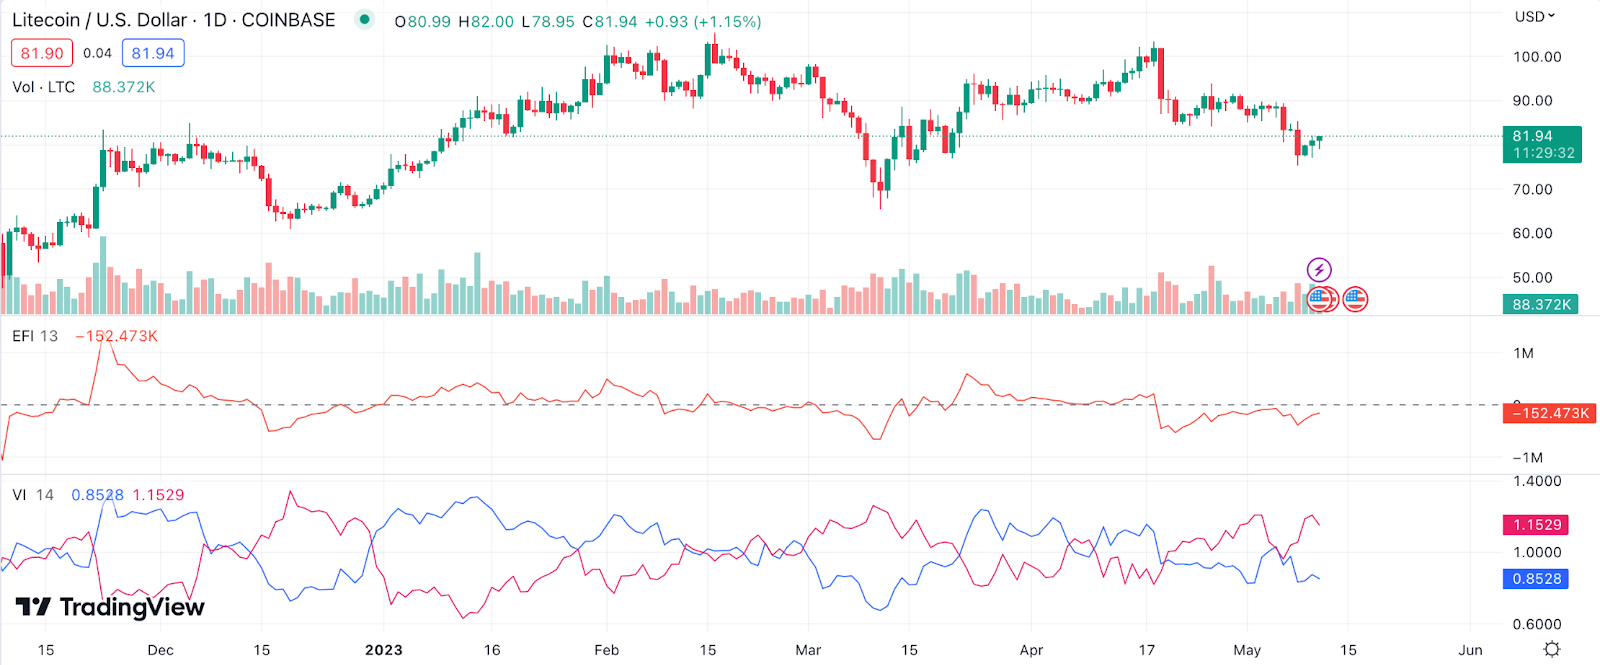
Example: When Litecoin’s VI+ line crosses above the VI- line, it indicates a bullish trend. In response to this signal, investors can consider entering long positions or use it to confirm the direction of an existing trend for further investment decisions.
Elder’s Force Index (EFI) – for Litecoin Price Prediction
Elder’s Force Index (EFI) is a momentum oscillator that measures the force or strength of an asset’s price movement by considering both price and volume data. The indicator helps identify potential trend reversals, breakouts, and overbought or oversold conditions.
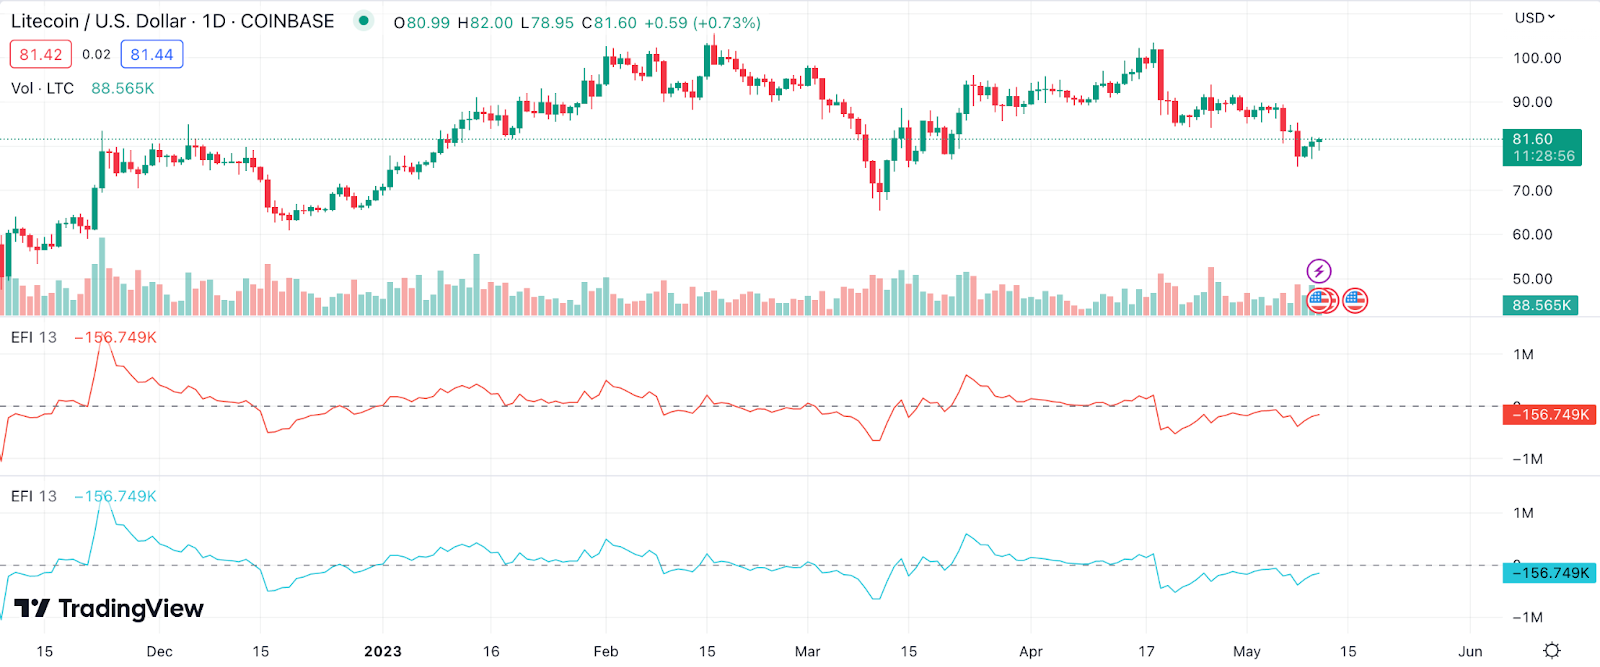
Example: If Litecoin’s EFI shows a strong positive value, it suggests a strong bullish force behind the price movement. Investors can use this indicator to enter long positions or hold existing positions in anticipation of a continued upward trend.
Williams %R for Litecoin Price Prediction
Williams %R is a momentum oscillator that measures the level of an asset’s price in relation to its highest price and lowest low over a specified period. The indicator oscillates between -100 and 0, with values above -20 indicating overbought conditions and values below -80 indicating oversold conditions.
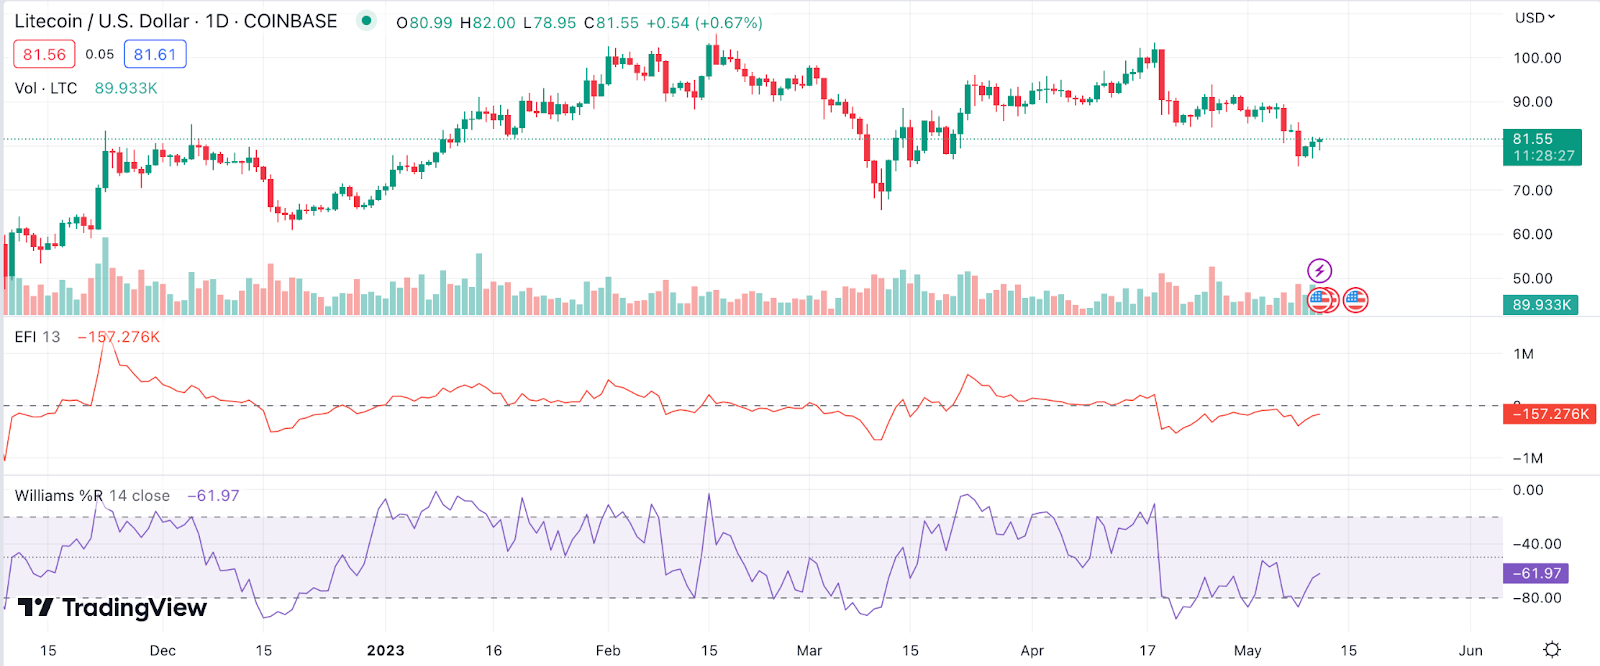
Example: Suppose Litecoin’s Williams %R value drops below -80. In that case, this may signal that the asset is oversold, and you could consider entering a long position, expecting the price to rebound, especially if other technical indicators support a bullish outlook.
Combining Technical Indicators for Accurate Litecoin Price Prediction
In the volatile world of cryptocurrency trading, no single technical indicator can provide a foolproof method for predicting future prices. Therefore, combining multiple technical indicators becomes vital for providing a more holistic view of the market and increasing the accuracy of Litecoin price predictions.
While a single indicator can provide useful insights, it might not account for all factors affecting the price. For instance, the Moving Average might identify a trend, but it won’t indicate if the asset is currently overbought or oversold. This is where combining indicators, such as the Moving Average and RSI, can provide a more complete picture.
The Importance of Using Multiple Technical Indicators for Litecoin Price Prediction
Using multiple technical indicators can help you confirm signals and avoid potential false alarms. When several indicators provide the same signal, it increases the likelihood that the predicted price movement will occur. For example, if both the RSI and Moving Average Convergence Divergence (MACD) indicate a bullish trend for Litecoin, this could give you more confidence in a potential upward LTC price movement.
Moreover, different types of indicators can provide different types of information. Trend indicators like Moving Averages can show the direction of the trend, while oscillators like the RSI can show whether an asset is overbought or oversold. Volume indicators can confirm the strength of a trend or signal a potential reversal. Using these indicators together can provide a more comprehensive view of the market.
How to Combine Various Indicators for a Comprehensive Analysis
When combining various indicators for Litecoin (LTC) price prediction, it’s crucial not to use too many that provide the same kind of information, as this could lead to redundancy. A good practice is to use a combination of trend, momentum, volume, and volatility indicators.
Here are some tips on how to combine various technical indicators for a comprehensive analysis of Litecoin price:
- Identify the Trend: Start with a trend-following indicator like the Moving Average (MA). Look at both short-term and long-term MAs to get a sense of the overall trend. If Litecoin price is consistently above a certain MA, it could indicate a bullish trend. Conversely, if it’s below, it could indicate a bearish trend.
- Assess Momentum: Use a momentum indicator such as RSI or the Moving Average Convergence Divergence (MACD). These can help you determine whether Litecoin is currently overbought or oversold. Remember, an overbought market could indicate a potential price drop, while an oversold market could signal a potential price increase.
- Measure Volatility: Volatility indicators like Bollinger Bands can give you a sense of the market’s potential for large LTC price swings. If the bands are widening, it could mean the market is becoming more volatile. If they’re narrowing, it could indicate less volatility and a potential price consolidation.
- Confirm with Volume: Volume can often confirm or refute the signals you’re getting from other indicators. An increase in volume can confirm a new trend, while decreasing volume might indicate a trend is weakening. The On Balance Volume (OBV) indicator can be especially useful for this.
- Use Different Time Frames: Analyzing Litecoin price using different time frames can provide additional insights. For instance, while the daily chart might show a strong uptrend, the hourly chart might show a temporary downtrend. Using multiple time frames can help you identify the best entry and exit points.
- Avoid Redundancy: While using multiple indicators can be beneficial, using too many of the same type can lead to redundancy and confusion. Try to use a balanced mix of trend, momentum, volume, and volatility indicators for a well-rounded view of the market.
- Practice Patience and Discipline: Technical analysis requires patience and discipline. Don’t rush to make a trade based on a single indicator’s signal. Instead, wait for confirmation from multiple indicators and make sure the trade aligns with your overall trading strategy.
By combining various technical indicators I mentioned, you can gain a deeper understanding of Litecoin price movements, increasing the chances of successful investments and more accurate predictions.
The Pillars of Litecoin Price Prediction: Fundamental Factors
As you understood, Litecoin price analysis is a multifaceted process, involving both technical analysis and fundamental analysis. While tech analysis focuses on price patterns and statistical trends, fundamental analysis delves into the intrinsic value of the cryptocurrency. In this section, we’ll focus on the fundamental factors impacting Litecoin (LTC) price.
Adoption Rate
The adoption rate of a cryptocurrency is a crucial indicator of its potential for growth and acceptance in mainstream financial systems. Several metrics can help assess the current adoption rate of Litecoin, giving us an idea of its growth potential.
Here are some key metrics to look at when evaluating Litecoin adoption rate:
- Number of Users: The number of users on the Litecoin network is a strong indicator of its adoption rate. There are over 710,000 active user addresses on the Litecoin network. This figure represents a significant increase in users since the beginning of the year, indicating growing interest in the platform.
- Transactions: The volume of transactions on the Litecoin network is another important metric. Higher transaction volumes indicate increased usage and adoption, which can contribute to a rise in the value of LTC. Litecoin recently processed a record 576,708 transactions, up from 100,684 transactions in early May.
- Businesses Accepting LTC: As more companies begin to accept LTC as a means of payment, the utility and demand for the token grow. Numerous businesses, both online and physical, accept Litecoin as a form of payment, among them there are Overstock, Newegg, Travala, eGifter, AT&T, etc.
- Trading Volume: Trading volume is a valuable metric to analyze when assessing the adoption rate of any cryptocurrency, including Litecoin (LTC). The average 24-hour trading volume of LTC fluctuates around $620 million, illustrating a strong market interest in the token.
- Institutional Adoption: Institutional adoption is a critical factor for any cryptocurrency, as it can significantly influence the LTC price. Prominent investors have taken notice of Litecoin and its potential. Major institutional players like Grayscale Investments included Litecoin in their investment products, signaling growing institutional adoption.
By examining these metrics, you can gain a deeper understanding of Litecoin’s adoption rate and its potential impact on the Litecoin (LTC) price.
Regulatory Developments
Regulatory developments can have a significant impact on the price of Litecoin. Positive regulatory changes, such as the acceptance of cryptocurrencies as legal tender or the introduction of cryptocurrency-friendly regulations, can boost the price of LTC. Conversely, negative regulatory actions, like bans or restrictive policies, may cause the rate to decline.
Here are some examples of regulatory changes and their potential impact on Litecoin price:
- Bans or Restrictions: If a country or a group of countries were to impose bans or restrictions on cryptocurrencies or specific projects, it could create uncertainty and affect the price of LTC. Investors may become wary, and trading volumes could decrease, leading to price fluctuations.
- Taxation and Reporting Requirements: Changes in taxation policies or increased reporting requirements for cryptocurrency transactions might discourage some investors or traders from participating in the market. As a result, Litecoin price could be influenced by reduced trading volume and investor interest.
- Regulatory Clarity: A lack of regulatory clarity can lead to uncertainty, which can negatively impact the LTC price. Conversely, clear and well-defined regulations can provide a more stable environment for cryptocurrencies, potentially leading to increased investor confidence and a positive impact on Litecoin’s rate.
- Anti-Money Laundering (AML) and Know Your Customer (KYC) Regulations: The introduction or tightening of AML and KYC regulations could affect the ease of trading and using cryptocurrencies, including LTC. While such regulations can protect investors and help legitimize the market, they might also increase operational costs for businesses and slow down transactions, potentially affecting Litecoin price.
- Institutional Adoption: Regulatory changes that encourage institutional adoption, such as the introduction of cryptocurrency ETFs or futures, can lead to increased demand and positively impact the price of LTC. On the other hand, regulatory changes that discourage institutional investors from participating in the market might have a negative effect on Litecoin’s (LTC) price.
Therefore, it’s essential to stay updated on the latest regulatory developments, as they can significantly influence Litecoin and LTC price.
Utility
The utility of Litecoin is another essential factor to consider when predicting its price. Analyzing the current and potential utility of the Litecoin network can provide valuable insights into its future price trajectory. At the same time, the actual utility of Litecoin can depend on a variety of factors, including market acceptance, regulatory environment, and technological advancements.
Some real-world use cases of Litecoin (LTC) include:
- Everyday Transactions: One of the key utilities of Litecoin is its use in everyday transactions. Given its faster block generation time, Litecoin can confirm transactions much quicker than Bitcoin, making it an attractive option for merchants and consumers who need quick transaction confirmations.
- International Remittances: Litecoin’s global reach and fast transaction times make it a viable option for international remittances. It offers a cheaper and faster alternative to traditional money transfer services, especially for cross-border transactions.
- Online Shopping: Many online retailers and service providers accept Litecoin as a payment method. Consumers can purchase everything from clothing and electronics to gift cards and travel experiences using Litecoin.
- Digital Asset Investments: Litecoin is a popular choice for investors. Its long-standing position in the digital asset market and wide acceptance give it a stability that appeals to both new and experienced investors.
- Microtransactions: Because of its lower transaction fees compared to Bitcoin, Litecoin is a viable option for microtransactions, including in-app purchases and tipping content creators on social media platforms.
- In-Game Currency: In the world of online gaming, some game developers are integrating Litecoin as an in-game currency, enabling players to buy virtual goods and services.
These are just a few examples of the real-world use cases of Litecoin (LTC), showcasing its growing utility across various sectors within the blockchain industry. As the demand for its technology and token increases, the price of LTC is likely to be positively affected.
Market Sentiment: How Litecoin News Prediction Works
Market sentiment, also known as investor sentiment or market psychology, refers to the overall attitude and feelings of investors and traders towards a particular financial market, asset, or security. It plays a crucial role in driving LTC price movements and can influence the behavior of market participants.
Market sentiment can be bullish (positive) when investors expect prices to rise or bearish (negative) when they expect Litecoin (LTC) price to fall.
Here are some factors and tools used to gauge market sentiment for Litecoin price today:
- Social Media Sentiment Analysis: Tools like LunarCrush and CryptoMood aggregate data from various social media platforms, such as Twitter, Reddit, and Telegram, to measure the overall sentiment for Litecoin.
- Google Trends: By analyzing search trends for Litecoin-related terms, you can get an idea of the public’s interest in Litecoin and potential shifts in market sentiment.
- Trading Volume: Analyzing the trading volume on major exchanges can give you insight into the market’s interest and conviction in Litecoin.
- Price Movements and Technical Analysis: Tracking price trends, support and resistance levels, and technical indicators can provide valuable information on market sentiment and potential LTC price direction.
- News and Developments: Staying up-to-date with the latest news related to Litecoin, including partnerships, technological advancements, and regulatory changes, can help you gauge the market sentiment and overall outlook.
- Cryptocurrency Market Cap: Monitoring Litecoin’s market capitalization (market cap) in relation to other cryptocurrencies can give you an idea of its relative market strength and investor sentiment.
- Fear and Greed Index: The Crypto Fear and Greed Index measures the emotions and sentiments of investors in the digital asset market, which can be useful for understanding the current Litecoin price and market sentiment.
- Community Engagement: Actively participating in Litecoin’s online community, such as forums, chat rooms, and social media groups, can provide valuable insights into the sentiment and opinions of fellow Litecoin enthusiasts and investors.
- Expert Opinions: Following the opinions of renowned cryptocurrency analysts and influencers can help you understand the prevailing market sentiment for the current price of Litecoin.
The Bottom Line: Making Your Own Litecoin Price Predictions
Well, we’ve covered a lot of ground here. By now, you should have a better understanding of the factors that influence Litecoin price and how to use that knowledge to make your own predictions.
Remember, though, that predicting the price of LTC (or any asset, for that matter) is never a surefire thing. There’s always a degree of uncertainty and risk involved.
FAQ
When Will Litecoin Go Up?
Predicting exact price movements for any cryptocurrency, including Litecoin, is challenging due to the volatile nature of the crypto markets. However, based on historical trends, market sentiment, and technical analysis, many experts have a positive outlook and anticipate a steady growth for Litecoin in the near future. It’s essential to conduct your own research and stay updated with market developments before making any investment decisions.
Should I Buy Litecoin?
Deciding whether to buy Litecoin or any other cryptocurrency depends on your investment goals, risk tolerance, and understanding of the crypto market. Litecoin has shown significant growth and adoption over the years, making it a potential investment. However, the digital asset market is volatile and can be risky. It’s crucial to do your own research and possibly consult with a financial advisor before investing.
How High Can Litecoin Go?
The potential growth of Litecoin is subject to numerous factors, including market demand, adoption rate, regulatory developments, and overall sentiment in the crypto market. Some experts and analytical platforms have given optimistic projections for Litecoin’s price in the next few years, but these are estimates and not guaranteed. My investment advice would be —always do your due diligence before investing.
Will Litecoin Crash Again in 2024?
As a passionate crypto blogger, I’d love to tell you that I know the answer, but I simply cannot predict whether the current Litecoin price will crash again in 2024 or not. Predicting a market crash is as challenging as predicting price surges. Various factors could lead to a market downturn, including regulatory changes, a significant negative event in the crypto space, or a broader economic downturn. Still, it’s important to note that while the digital asset market has experienced crashes in the past, it has also shown resilience and capacity for recovery.