Introduction: A Journey into Bitcoin Price Predictions
Hey there, fellow crypto enthusiasts! Today, I’ll be guiding you on an exciting exploration into the world of Bitcoin price predictions from 2024 to 2030.
But let’s be real, predicting the price of Bitcoin can be a daunting task.
We’ll be discussing Bitcoin’s origin and purpose, its price history, and the expert opinions and tools that traders use to forecast its value.
The market’s volatility and unpredictability can even give experienced traders a run for their money.
That’s where mastering the art of technical analysis and understanding the wide array of indicators comes into play, helping us make better-informed investment decisions.
So, strap in and join me on this thrilling expedition through the ever-changing realm of Bitcoin forecasting!
Bitcoin (BTC) Overview
| Bitcoin Price | $109,341.16 |
| Bitcoin Price Change 24h | 2.03% |
| Bitcoin Price Change 7d | 1.22% |
| Bitcoin Market Cap | $2,174,446,391,805.40 |
| Bitcoin Circulating Supply | 19,886,806.00 |
| Bitcoin Trading Volume | $55,521,709,027.41 |
| Bitcoin All-Time Low (ATL) | $68,789.63 |
| Bitcoin All-Time Low (ATL) | $0.04865 |
A Brief History: Bitcoin and its Purpose
Before diving into the bitcoin price predictions though, let’s quickly revisit what Bitcoin is and why it exists. In 2009, the enigmatic Satoshi Nakamoto introduced Bitcoin, a digital currency that operates on a decentralized network known as the Bitcoin blockchain. The primary goal of Bitcoin is to facilitate peer-to-peer transactions without intermediaries like banks, making Bitcoin a truly global and accessible form of currency.
In the early days, Bitcoin was seen as a niche currency used by tech enthusiasts and libertarians. However, over the years, its popularity has grown, and it has become a mainstream investment option. The price of Bitcoin has gone through numerous ups and downs, with some of the most notable moments being:
- In 2010, a developer named Laszlo Hanyecz made the first-ever real-world transaction using Bitcoin when he bought two pizzas for 10,000 BTC.
- In 2013, the price of Bitcoin soared to over $1,000 for the first time.
- In 2017, Bitcoin reached an all-time high of almost $20,000 before crashing back down.
- In 2020-2024, Bitcoin price surged to new all-time highs, driven by institutional adoption and increasing demand.
Bitcoin – BTC Price Prediction For Today, Tomorrow, This Week and Next 30 Days
| Date | Price | Change |
|---|---|---|
| July 04, 2025 | 109,931.60 | 0.54% |
| July 05, 2025 | 110,239.41 | 0.28% |
| July 06, 2025 | 109,412.62 | -0.75% |
| July 07, 2025 | 108,318.49 | -1.00% |
| July 08, 2025 | 107,332.79 | -0.91% |
| July 09, 2025 | 107,418.66 | 0.08% |
| July 10, 2025 | 107,214.56 | -0.19% |
| July 11, 2025 | 106,260.35 | -0.89% |
| July 12, 2025 | 106,058.46 | -0.19% |
| July 13, 2025 | 106,313.00 | 0.24% |
| July 14, 2025 | 107,163.50 | 0.80% |
| July 15, 2025 | 106,263.33 | -0.84% |
| July 16, 2025 | 106,667.13 | 0.38% |
| July 17, 2025 | 106,635.13 | -0.03% |
| July 18, 2025 | 107,360.25 | 0.68% |
| July 19, 2025 | 107,070.37 | -0.27% |
| July 20, 2025 | 107,295.22 | 0.21% |
| July 21, 2025 | 106,479.78 | -0.76% |
| July 22, 2025 | 106,554.31 | 0.07% |
| July 23, 2025 | 105,712.54 | -0.79% |
| July 24, 2025 | 106,515.95 | 0.76% |
| July 25, 2025 | 106,100.54 | -0.39% |
| July 26, 2025 | 105,516.99 | -0.55% |
| July 27, 2025 | 106,487.74 | 0.92% |
| July 28, 2025 | 106,998.88 | 0.48% |
| July 29, 2025 | 107,608.78 | 0.57% |
| July 30, 2025 | 108,232.91 | 0.58% |
| July 31, 2025 | 107,756.68 | -0.44% |
| August 01, 2025 | 106,776.10 | -0.91% |
| August 02, 2025 | 107,694.37 | 0.86% |
Bitcoin Price Prediction 2024
We have analyzed the future Bitcoin price data for 2024. The minimum projected price stands at $98,407.04, while the average and maximum prices are $114,808.22 and $131,209.39, respectively.
Our assessment of future returns from this data suggests a fairly stable outlook for Bitcoin in 2024, with a moderate growth trajectory.
The relatively narrow price range indicates that the market may not expect dramatic fluctuations in value, but it still presents a notable upside potential for Bitcoin investors willing to assume the associated high risk.
However, given the historical volatility of cryptocurrencies and the ever-changing market landscape, it is crucial for crypto investors to exercise caution and conduct thorough due diligence before making any investment decisions in this space.
| Month | Minimum Price | Average Price | Maximum Price |
|---|---|---|---|
| February 2024 | 46,003.98 | 47,771.53 | 49,730.16 |
| March 2024 | 47,246.09 | 49,061.36 | 51,072.88 |
| April 2024 | 48,521.74 | 50,386.02 | 52,451.85 |
| May 2024 | 49,831.82 | 51,746.44 | 53,868.05 |
| June 2024 | 51,177.28 | 53,143.60 | 55,322.48 |
| July 2024 | 52,559.07 | 54,578.47 | 56,816.19 |
| August 2024 | 53,978.16 | 56,052.09 | 58,350.23 |
| September 2024 | 55,435.57 | 57,565.50 | 59,925.68 |
| October 2024 | 56,932.34 | 59,119.77 | 61,543.68 |
| November 2024 | 58,469.51 | 60,716.00 | 63,205.36 |
| December 2024 | 60,048.19 | 62,355.33 | 64,911.90 |
| January 2025 | 61,669.49 | 64,038.93 | 66,664.52 |
January 2024: Bitcoin Price Forecast
As we enter 2024, Bitcoin opens the year with a potential minimum price of $43,033.18. Our team’s analysis suggests an average trading range around $45,251.73, with the possibility of peaks reaching as high as $48,725.16. This upward trend indicates a robust start for Bitcoin, reflecting increased investor confidence and market stability.
BTC Price Forecast for February 2024
Moving into February, Bitcoin’s momentum seems to continue, with a forecasted minimum price of $46,003.98. We anticipate the average price to hover around $47,771.53, suggesting a steady yet cautious market sentiment. The maximum price could surge to $49,730.16, hinting at strong buying interest and bullish market behavior.
March 2024: Bitcoin Price Forecast
March 2024 looks promising for Bitcoin, with the minimum price expected at $47,246.09. Our research points towards an average trading value of $49,061.36, a steady increase reflecting growing market confidence. The potential high could reach $51,072.88, indicating an optimistic outlook among investors.
BTC Price Forecast for April 2024
April’s forecast for Bitcoin shows a continued positive trend, with the minimum price projected at $48,521.74. An average price of $50,386.02 could be seen, driven by consistent investor interest and market growth. The maximum price could climb to a significant $52,451.85, showcasing the robustness of the crypto market.
May 2024: Bitcoin Price Forecast
As summer approaches, May holds potential for Bitcoin, with a minimum price of $49,831.82. The market could see an average price around $51,746.44, reflecting a sustained positive trend. A maximum of $53,868.05 suggests that investor enthusiasm remains high, potentially driven by positive market news and global economic factors.
BTC Price Forecast for June 2024
June’s Bitcoin price forecast shows a minimum of $51,177.28, indicating a stable and growing market. We’re looking at an average price of around $53,143.60, a sign of continued investor trust in Bitcoin. The peak price might reach $55,322.48, possibly influenced by key technological advancements and market dynamics.
July 2024: Bitcoin Price Forecast
In July, Bitcoin is expected to have a minimum price of $52,559.07. The average price might stabilize around $54,578.47, reflecting a balanced market sentiment. A potential high of $56,816.19 could be driven by seasonal market trends and investor optimism.
BTC Price Forecast for August 2024
August sees Bitcoin with a predicted minimum price of $53,978.16. An average price of $56,052.09 suggests steady growth, while a maximum of $58,350.23 could indicate a bullish market, possibly fueled by significant global economic developments.
September 2024: Bitcoin Price Forecast
September’s forecast for Bitcoin includes a minimum price of $55,435.57. We anticipate an average price point of $57,565.50, with the market potentially reaching a high of $59,925.68. This growth could be attributed to increasing institutional interest and positive regulatory news.
BTC Price Forecast for October 2024
In October, Bitcoin’s minimum price is expected to be $56,932.34. The average trading price might hover around $59,119.77, showing sustained market confidence. A high of $61,543.68 could be influenced by festive season spending and global economic cues.
November 2024: Bitcoin Price Forecast
For November, Bitcoin could see a minimum price of $58,469.51. An average price of $60,716.00 indicates a solid market position, while a maximum of $63,205.36 suggests the potential for significant market movements, possibly driven by year-end financial strategies.
BTC Price Forecast for December 2024
December’s forecast shows Bitcoin with a potential minimum price of $60,048.19. The market could average around $62,355.33, a reflection of the year’s overall positive trend. A maximum price of $64,911.90 could be reached, ending the year on a high note, influenced by holiday spending and investor optimism.
Bitcoin Prediction 2025
Cryptocurrency market experts are ready to announce their forecast for Bitcoin’s performance in 2025, backed by thorough analysis of the data. With a minimum price of $60,991.19, an average price of $72,359.08, and a maximum price of $86,058.93, we can anticipate a period of moderate and stable growth.
| Month | Minimum Price | Average Price | Maximum Price |
|---|---|---|---|
| February 2025 | 60,991.19 | 63,334.57 | 65,931.28 |
| March 2025 | 62,637.95 | 65,044.60 | 67,711.43 |
| April 2025 | 64,329.17 | 66,800.80 | 69,539.64 |
| May 2025 | 66,066.06 | 68,604.43 | 71,417.21 |
| June 2025 | 67,849.85 | 70,456.74 | 73,345.47 |
| July 2025 | 69,681.79 | 72,359.08 | 75,325.80 |
| August 2025 | 71,563.20 | 74,312.77 | 77,359.60 |
| September 2025 | 73,495.41 | 76,319.22 | 79,448.30 |
| October 2025 | 75,479.78 | 78,379.84 | 81,593.41 |
| November 2025 | 77,517.74 | 80,496.09 | 83,796.43 |
| December 2025 | 79,610.71 | 82,669.49 | 86,058.93 |
| January 2026 | 81,760.20 | 84,901.56 | 88,382.53 |
Bitcoin Price Prediction 2026
We have carefully examined the future Bitcoin price data for 2026. The data provided suggests a minimum price of $80,860.92, an average price of $95,932.24, and the highest price of $114,095.25.
| Month | Minimum Price | Average Price | Maximum Price |
|---|---|---|---|
| February 2026 | 80,860.92 | 83,967.73 | 87,410.40 |
| March 2026 | 83,044.16 | 86,234.85 | 89,770.48 |
| April 2026 | 85,286.36 | 88,563.20 | 92,194.29 |
| May 2026 | 87,589.09 | 90,954.40 | 94,683.53 |
| June 2026 | 89,953.99 | 93,410.17 | 97,239.99 |
| July 2026 | 92,382.75 | 95,932.24 | 99,865.47 |
| August 2026 | 94,877.09 | 98,522.42 | 102,561.83 |
| September 2026 | 97,438.77 | 101,182.52 | 105,331.00 |
| October 2026 | 100,069.61 | 103,914.45 | 108,174.94 |
| November 2026 | 102,771.49 | 106,720.14 | 111,095.66 |
| December 2026 | 105,546.32 | 109,601.58 | 114,095.25 |
| January 2027 | 108,396.07 | 112,560.83 | 117,175.82 |
Bitcoin Price Prediction 2027
Crypto analysts have delved into the price patterns for Bitcoin in 2027, revealing a range of noteworthy projections. With a possible low of $107,203.82, an estimated average of $127,185.09, and an anticipated high of $151,265.24, Bitcoin’s growth trajectory appears to be on a steady path.
| Month | Minimum Price | Average Price | Maximum Price |
|---|---|---|---|
| February 2027 | 107,203.82 | 111,322.76 | 115,887.00 |
| March 2027 | 110,098.32 | 114,328.48 | 119,015.95 |
| April 2027 | 113,070.98 | 117,415.35 | 122,229.38 |
| May 2027 | 116,123.90 | 120,585.56 | 125,529.57 |
| June 2027 | 119,259.24 | 123,841.37 | 128,918.87 |
| July 2027 | 122,479.24 | 127,185.09 | 132,399.68 |
| August 2027 | 125,786.18 | 130,619.09 | 135,974.47 |
| September 2027 | 129,182.41 | 134,145.80 | 139,645.78 |
| October 2027 | 132,670.33 | 137,767.74 | 143,416.22 |
| November 2027 | 136,252.43 | 141,487.47 | 147,288.45 |
| December 2027 | 139,931.25 | 145,307.63 | 151,265.24 |
| January 2028 | 143,709.39 | 149,230.93 | 155,349.40 |
Bitcoin Price Prediction 2028
According to the technical analysis of Bitcoin expected in 2028, our team of trading experts has derived some noteworthy insights. With a minimum price of $142,128.73, an average price of $168,619.50, and the highest price of $200,544.50, we can anticipate a phase of measured and steady growth.
| Month | Minimum Price | Average Price | Maximum Price |
|---|---|---|---|
| February 2028 | 142,128.73 | 147,589.54 | 153,640.71 |
| March 2028 | 145,966.21 | 151,574.46 | 157,789.01 |
| April 2028 | 149,907.29 | 155,666.97 | 162,049.32 |
| May 2028 | 153,954.79 | 159,869.98 | 166,424.65 |
| June 2028 | 158,111.57 | 164,186.47 | 170,918.11 |
| July 2028 | 162,380.58 | 168,619.50 | 175,532.90 |
| August 2028 | 166,764.86 | 173,172.23 | 180,272.29 |
| September 2028 | 171,267.51 | 177,847.88 | 185,139.64 |
| October 2028 | 175,891.73 | 182,649.77 | 190,138.41 |
| November 2028 | 180,640.81 | 187,581.32 | 195,272.15 |
| December 2028 | 185,518.11 | 192,646.01 | 200,544.50 |
| January 2029 | 190,527.10 | 197,847.46 | 205,959.20 |
Bitcoin Price Prediction 2029
In light of the latest data, our team of crypto experts has come up with intriguing forecasts for Bitcoin’s past performance in 2029. It’s anticipated that the minimum price could hover around $188,431.49, while the average price may settle at $223,552.44, and the maximum price could potentially reach $265,877.98.
| Month | Minimum Price | Average Price | Maximum Price |
|---|---|---|---|
| February 2029 | 188,431.49 | 195,671.33 | 203,693.86 |
| March 2029 | 193,519.14 | 200,954.46 | 209,193.59 |
| April 2029 | 198,744.16 | 206,380.23 | 214,841.82 |
| May 2029 | 204,110.25 | 211,952.49 | 220,642.55 |
| June 2029 | 209,621.23 | 217,675.21 | 226,599.90 |
| July 2029 | 215,281.00 | 223,552.44 | 232,718.09 |
| August 2029 | 221,093.59 | 229,588.36 | 239,001.48 |
| September 2029 | 227,063.12 | 235,787.24 | 245,454.52 |
| October 2029 | 233,193.82 | 242,153.50 | 252,081.79 |
| November 2029 | 239,490.05 | 248,691.64 | 258,888.00 |
| December 2029 | 245,956.28 | 255,406.32 | 265,877.98 |
| January 2030 | 252,597.10 | 262,302.29 | 273,056.68 |
Bitcoin Price Prediction 2030
After analyzing the recent data, our team of seasoned crypto analysts has devised an intriguing projection for Bitcoin’s value in 2030. We anticipate that the minimum price could be around $249,818.78, while the average price might settle at $296,381.45, and the maximum price could soar to $352,495.82.
| Month | Minimum Price | Average Price | Maximum Price |
|---|---|---|---|
| February 2030 | 249,818.78 | 259,417.22 | 270,053.33 |
| March 2030 | 256,563.89 | 266,421.49 | 277,344.77 |
| April 2030 | 263,491.12 | 273,614.87 | 284,833.08 |
| May 2030 | 270,605.38 | 281,002.47 | 292,523.57 |
| June 2030 | 277,911.72 | 288,589.53 | 300,421.71 |
| July 2030 | 285,415.34 | 296,381.45 | 308,533.09 |
| August 2030 | 293,121.55 | 304,383.75 | 316,863.49 |
| September 2030 | 301,035.83 | 312,602.11 | 325,418.80 |
| October 2030 | 309,163.80 | 321,042.37 | 334,205.11 |
| November 2030 | 317,511.22 | 329,710.51 | 343,228.64 |
| December 2030 | 326,084.03 | 338,612.70 | 352,495.82 |
| January 2031 | 334,888.30 | 347,755.24 | 362,013.21 |
Bitcoin Price USD Prediction (2031)
Upon careful examination of the provided data, our expert team has formulated a thought-provoking outlook for Bitcoin’s performance in 2031. We foresee a minimum price of $331,204.86, an above-average price hovering around $392,936.74, and a maximum reaching up to $467,332.07.
| Month | Minimum Price | Average Price | Maximum Price |
|---|---|---|---|
| February 2031 | 331,204.86 | 343,930.28 | 358,031.43 |
| March 2031 | 340,147.39 | 353,216.40 | 367,698.27 |
| April 2031 | 349,331.37 | 362,753.24 | 377,626.13 |
| May 2031 | 358,763.32 | 372,547.58 | 387,822.03 |
| June 2031 | 368,449.93 | 382,606.37 | 398,293.23 |
| July 2031 | 378,398.08 | 392,936.74 | 409,047.15 |
| August 2031 | 388,614.83 | 403,546.03 | 420,091.42 |
| September 2031 | 399,107.43 | 414,441.77 | 431,433.89 |
| October 2031 | 409,883.33 | 425,631.70 | 443,082.60 |
| November 2031 | 420,950.18 | 437,123.76 | 455,045.83 |
| December 2031 | 432,315.83 | 448,926.10 | 467,332.07 |
| January 2032 | 443,988.36 | 461,047.10 | 479,950.03 |
Bitcoin Price Prediction 2032
As true crypto enthusiasts, we’ve been investigating Bitcoin’s possible trajectory for 2032, taking into account prices from $439,104.93 to $619,579.72.
| Month | Minimum Price | Average Price | Maximum Price |
|---|---|---|---|
| February 2032 | 439,104.93 | 455,976.05 | 474,671.06 |
| March 2032 | 450,960.77 | 468,287.40 | 487,487.18 |
| April 2032 | 463,136.71 | 480,931.16 | 500,649.34 |
| May 2032 | 475,641.40 | 493,916.30 | 514,166.87 |
| June 2032 | 488,483.71 | 507,252.04 | 528,049.37 |
| July 2032 | 501,672.77 | 520,947.85 | 542,306.71 |
| August 2032 | 515,217.94 | 535,013.44 | 556,948.99 |
| September 2032 | 529,128.82 | 549,458.80 | 571,986.61 |
| October 2032 | 543,415.30 | 564,294.19 | 587,430.25 |
| November 2032 | 558,087.52 | 579,530.13 | 603,290.87 |
| December 2032 | 573,155.88 | 595,177.44 | 619,579.72 |
| January 2033 | 588,631.09 | 611,247.23 | 636,308.37 |
Our educated guess points to a period of gradual and steady growth promising cryptocurrencies during these years. So, fellow investors, keep your wits about you and always perform thorough own research before delving into the world of crypto investments.
The Main Questions Of Critical Thinking When We Talk About
Here are three critical thinking questions to deepen your own research and understanding of the price of BTC and the other factors influencing it:
- How can the interplay between technical and fundamental analysis, and market sentiment affect the price of BTC? Consider how each of these different factors can reinforce or counteract one another in shaping market behavior and trends.
- What external factors, such as global economic conditions, geopolitical events, or technological advancements, might impact the price of BTC? How could these factors interact with the elements of technical and fundamental analysis, and market sentiment to influence the overall market dynamics?
- How can investors and traders manage the risks and uncertainties associated with the price of Bitcoin? Consider the role of diversification, high risk management strategies, and the importance of maintaining a long-term perspective in navigating the volatile crypto market.
Reflecting on these critical thinking questions can help you develop a deeper understanding of the complexities surrounding the future price of Bitcoin and the importance of considering various perspectives and factors in making informed good investment decisions.
The Crystal Ball: Expert Views on Bitcoin’s Future
When it comes to Bitcoin price projection, it’s always fascinating to hear the perspectives of well-known, financial experts and crypto experts too.
Jurrien Timmer, senior commodity strategist from Fidelity Investments, for example, envisions Bitcoin reaching a market cap of $10 trillion by 2030, translating to a staggering $500,000 per Bitcoin!
Cathie Wood, the innovative founder of ARK Invest, shares a similar outlook, but anticipates this milestone being achieved by 2026.
Of course, these predictions are subject to factors like adoption, rising interest rates, regulatory changes, and technological advancements. So, let’s dive into the tools and methods traders use to predict Bitcoin worth, including fundamental analysis, technical price analysis, and sentiment analysis.
- Tim Draper: Venture capitalist Tim Draper has been a strong supporter of Bitcoin. He predicted that Bitcoin would reach $250,000 by 2024 or early 2025.

- Michael Saylor: MicroStrategy’s CEO, Michael Saylor, is a Bitcoin advocate who has consistently added Bitcoin to his company’s balance sheet. He sees Bitcoin as a hedge against inflation and a superior store of value compared to traditional assets.

- Anthony Pompliano: Co-founder of Morgan Creek Digital, Anthony Pompliano, is bullish on Bitcoin. He has predicted that the price of BTC could reach $100,000 in the long term due to its limited supply and in creasing demand.

- Max Keiser: Financial analyst and host of the Keiser Report, Max Keiser, is bullish on Bitcoin. He predicts that Bitcoin’s price could reach $220,000 in the long term, citing increasing institutional interest and the decreasing value of fiat currencies.
- Raoul Pal: Macro investor and Real Vision founder Raoul Pal is optimistic about Bitcoin’s future results. He has mentioned the potential for Bitcoin to reach $1 million in the coming years, considering its growing mass adoption and limited supply.
- Chamath Palihapitiya: Venture capitalist and Social Capital founder Chamath Palihapitiya has been a long-time supporter of BTC. He believes that Bitcoin could reach $1 million per coin in the long term as a hedge against traditional financial systems.
- Dan Morehead: The founder and CEO of Pantera Capital, Dan Morehead, is bullish on Bitcoin. He has predicted that BTC could reach $115,000 by August 2021 (which didn’t happen) but remains optimistic about its long-term potential.
- Thomas Lee: Fundstrat Global Advisors co-founder Thomas Lee is a long-term Bitcoin supporter. While he hasn’t provided specific price predictions recently, he believes that increasing institutional interest and adoption of cryptocurrencies will benefit Bitcoin in the long run.
- Mike Novogratz: Galaxy Digital CEO and former hedge fund manager Mike Novogratz has been optimistic about BTC. He sees it as digital gold and predicts that its price could reach $500,000 in the future, considering its limited supply and growing demand.
- Willy Woo: An independent cryptocurrency analyst, Willy Woo, is known for his on-chain analysis and bullish outlook on BTC. He has stated that Bitcoin could reach a price of $200,000 to $300,000 in the coming years, based on factors such as adoption, Bitcoin network effects, market cap, and scarcity.
- Tyler and Cameron Winklevoss: The Winklevoss twins, founders of Gemini cryptocurrency exchange, are long-term Bitcoin supporters. They believe that Bitcoin’s price could reach $500,000, viewing it as a superior store of value compared to gold.
- Brian Kelly: The founder and CEO of BKCM LLC, Brian Kelly, is bullish on BTC. He believes that institutional interest and increased adoption will continue to drive Bitcoin’s price higher over time, although he has not provided specific price targets.
- John McAfee: The late John McAfee, founder of McAfee Associates and a controversial figure in the cryptocurrency space, had made some wild predictions about Bitcoin’s price, including it reaching $1 million by the end of 2020 (which did not happen).
- Arthur Hayes: The former CEO of BitMEX, Arthur Hayes, has been bullish on Bitcoin. He has suggested that Bitcoin’s price could eventually reach $100,000, driven by institutional interest, limited supply, and growing demand.
- PlanB: The creator of the stock-to-flow (S2F) model, PlanB, has forecasted that the price of BTC could reach around $100,000 by the end of 2021 (although this didn’t happen) and continue to rise in the long term.
Decoding the Charts: Technical Price Analysis
Technical analysis is a method used by traders and investors to forecast the price movements of financial assets, such as stocks, commodities, or cryptocurrencies, by analyzing historical price data and patterns.
Unlike fundamental analysis, which focuses on the intrinsic value of an asset, technical analysis is based on the assumption that historical price movements can provide insights into future price behavior.
Here are some key concepts and tools used in technical analysis:
- Price charts: Technical analysts use various types of price charts, such as line charts, bar charts, and candlestick charts, to visualize historical price data and identify patterns or trends.
- Trend analysis: Identifying the overall trend is a critical aspect of technical analysis. Traders look for uptrends (a series of higher highs and higher lows) or downtrends (a series of lower highs and lower lows) to determine the market’s direction.
- Support and resistance levels: Support levels are price points where an asset’s price has historically had difficulty falling below, while resistance levels are points where the price has had difficulty rising above. These levels can help traders identify potential entry and exit points for trades.
- Technical indicators: Technical analysts use various mathematical indicators to gain insights into market trends and momentum. Some common indicators include moving averages, (RSI), moving average convergence divergence (MACD), and Bollinger Bands.
- Chart patterns: Technical analysts look for specific chart patterns that may suggest price movements. Examples of chart patterns include head and shoulders, double tops and bottoms, triangles, and flags.
- Volume analysis: Analyzing trade volume can provide insights into the strength or weakness of price movements. High volume during a price increase can signal strong buying interest, while low volume during a price decline may indicate weak selling pressure.
- Timeframes: Technical analysts can apply their methods to various timeframes, from intraday charts to weekly or monthly charts, depending on their trading style and objectives.
Technical Analysis: Navigating the World of Bitcoin’s Price Prediction
We’ll touch on the origins and purposes of these indicators, go over the most common ones employed for predicting BTC worth, and even give you some practical examples of how they can be put to use.
With this newfound knowledge at your fingertips, you’ll be better prepared to tackle the wild ride that is the market. So, let’s get ready to dive in and refine our own research and trade strategies with the ultimate goal of making smarter and more profitable investment decisions.
Technical Indicators: Origin and Purpose for Bitcoin’s Price Prediction
As a crypto enthusiast, I’m always on the lookout for ways to improve my Bitcoin price prediction game. One of the most effective ways to do this is by using indicators.
In this section, we’ll discuss what indicators are, their history, their role in financial markets, and how they can help us predict BTC worth more accurately.
Technical indicators are mathematical calculations derived from historical price data, such as price, volume, and open and interest rates, to predict future price movements.
They have been used for centuries in various forms, starting with Japanese rice traders who developed candlestick charts back in the 18th century.
Over time, these indicators have evolved into more sophisticated tools, thanks to the works of prominent analysts like Charles Dow, who laid the groundwork for modern technical analysis, and W.D.
Gann, who developed complex methods like the Gann Fan. Nowadays, we have a wide range of technical indicators at our disposal to help us make informed trading decisions.
The Role of Technical Indicators in Financial Markets
Technical indicators play a vital role in financial markets by providing traders with objective insights into market behavior.
They help traders identify patterns, trends, and potential turning points in the market, which can be useful when making buy and sell decisions.
These indicators also allow traders to assess the overall strength and direction of a particular asset, like Bitcoin, and gauge the momentum of price changes.
In essence, indicators act as a valuable resource for traders to navigate the complexities of financial markets, enabling them to make better-informed decisions based on historical data and mathematical calculations.
When it comes to both price action and prediction, technical indicators serve as powerful tools that can help us anticipate potential price movements. By analyzing historical price data, these indicators can signal potential trend reversals, overbought or oversold conditions, and even the strength of a trend.
Some of the common indicators used for predicting Bitcoin worth include:
- Moving Averages (MAs)
- Relative Strength Index (RSI)
- Moving Average Convergence Divergence (MACD)
- Bollinger Bands
- Stochastic Oscillator
- Parabolic SAR (Stop and Reverse)
These indicators, when used in conjunction with one another, can provide a more comprehensive understanding of the Bitcoin crypto market, allowing us to make more accurate bitcoin price predictions ourselves, and improve our overall trade strategy on crypto exchanges.
To sum up, technical indicators are an essential aspect of any successful price prediction strategy.
By understanding their origins, purpose, and applications in financial markets, we can harness their power to make better-informed investment decisions, and boost our crypto trade game.
So, let’s keep exploring the world of technical analysis and continue refining our price prediction skills.
I know how important it is to have a solid understanding of the most common technical indicators used for both crypto prices and predicting BTC worth.
In this section, I’ll share with you three essential indicators that I’ve found particularly helpful in my own trade journey, and I’ll provide real-life examples of how to apply them to Bitcoin prediction.
Moving Averages (MAs) – Can We Indicate Bitcoin Future Price?
Moving Averages (MAs) are among the most popular and widely used technical indicators.
They help smooth out price fluctuations by calculating the average price of an asset over a specific period.
There are two main types of moving averages: Simple Moving Average (SMA) and Exponential Moving Average (EMA).
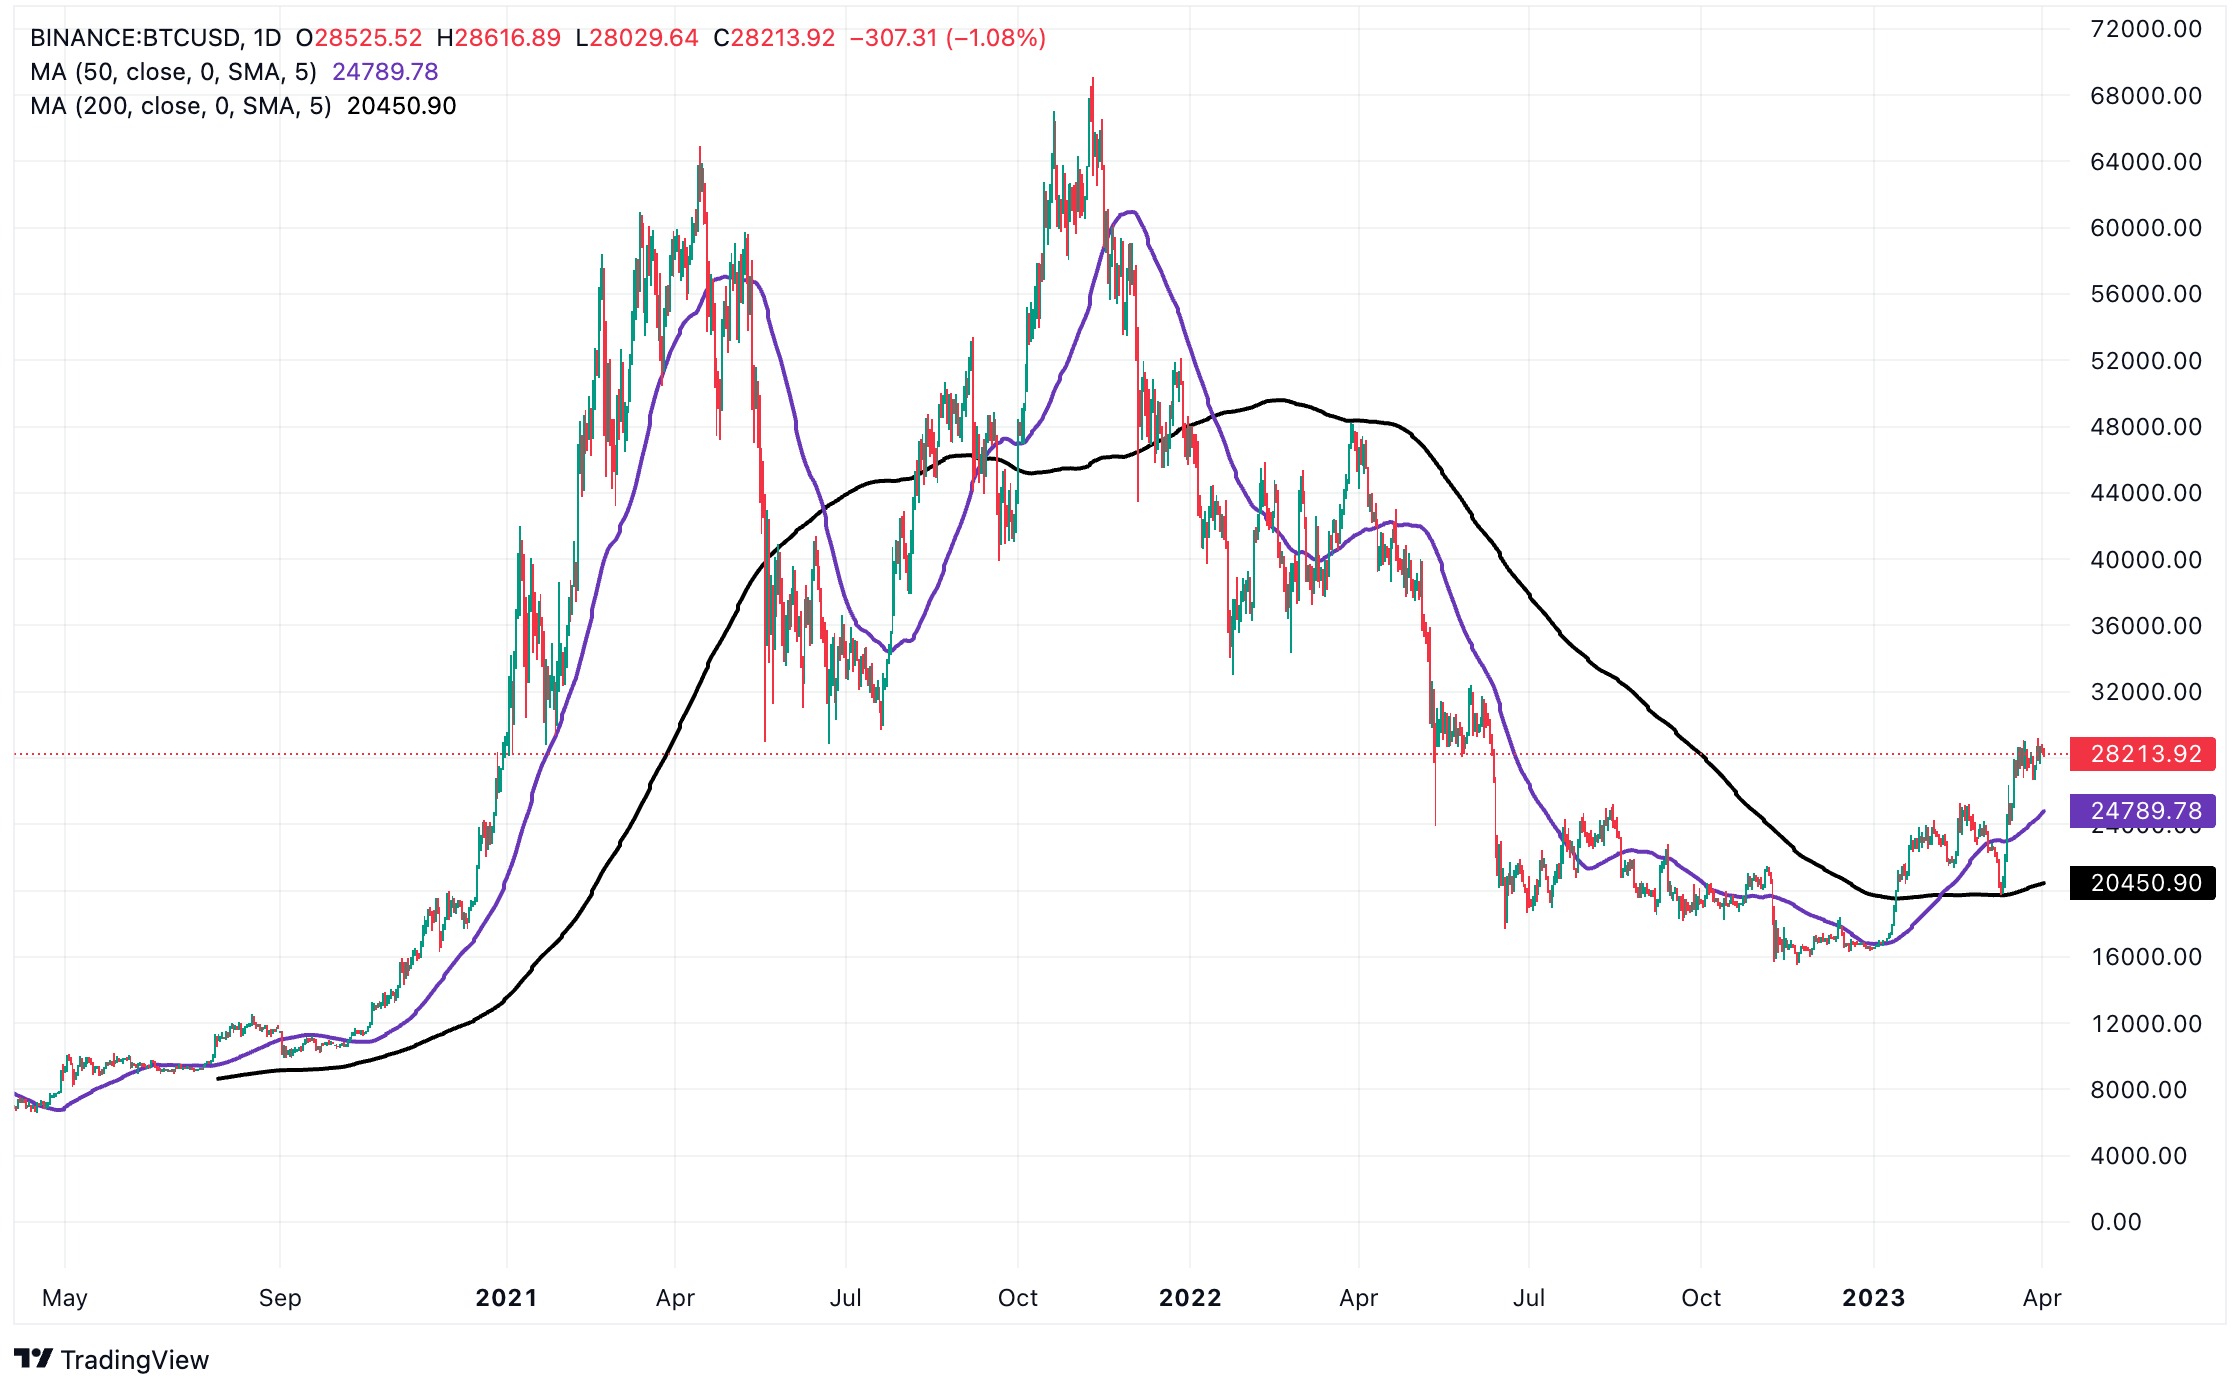
Example: Let’s say you’re analyzing Bitcoin’s price using a 50-day SMA. You’d add up the closing prices of the last 50 days and then divide the sum by 50 to get the average. If the current price is above the 50-day SMA, it could signal that the market is in an uptrend, and vice versa.
Relative Strength Index (RSI) – RSI Bitcoin Outlook
The RSI is a momentum oscillator that measures the speed and change of price movements.
It ranges from 0 to 100 and helps traders identify overbought and oversold conditions.
Generally, an RSI value above 70 indicates overbought conditions, while a value below 30 suggests oversold conditions.
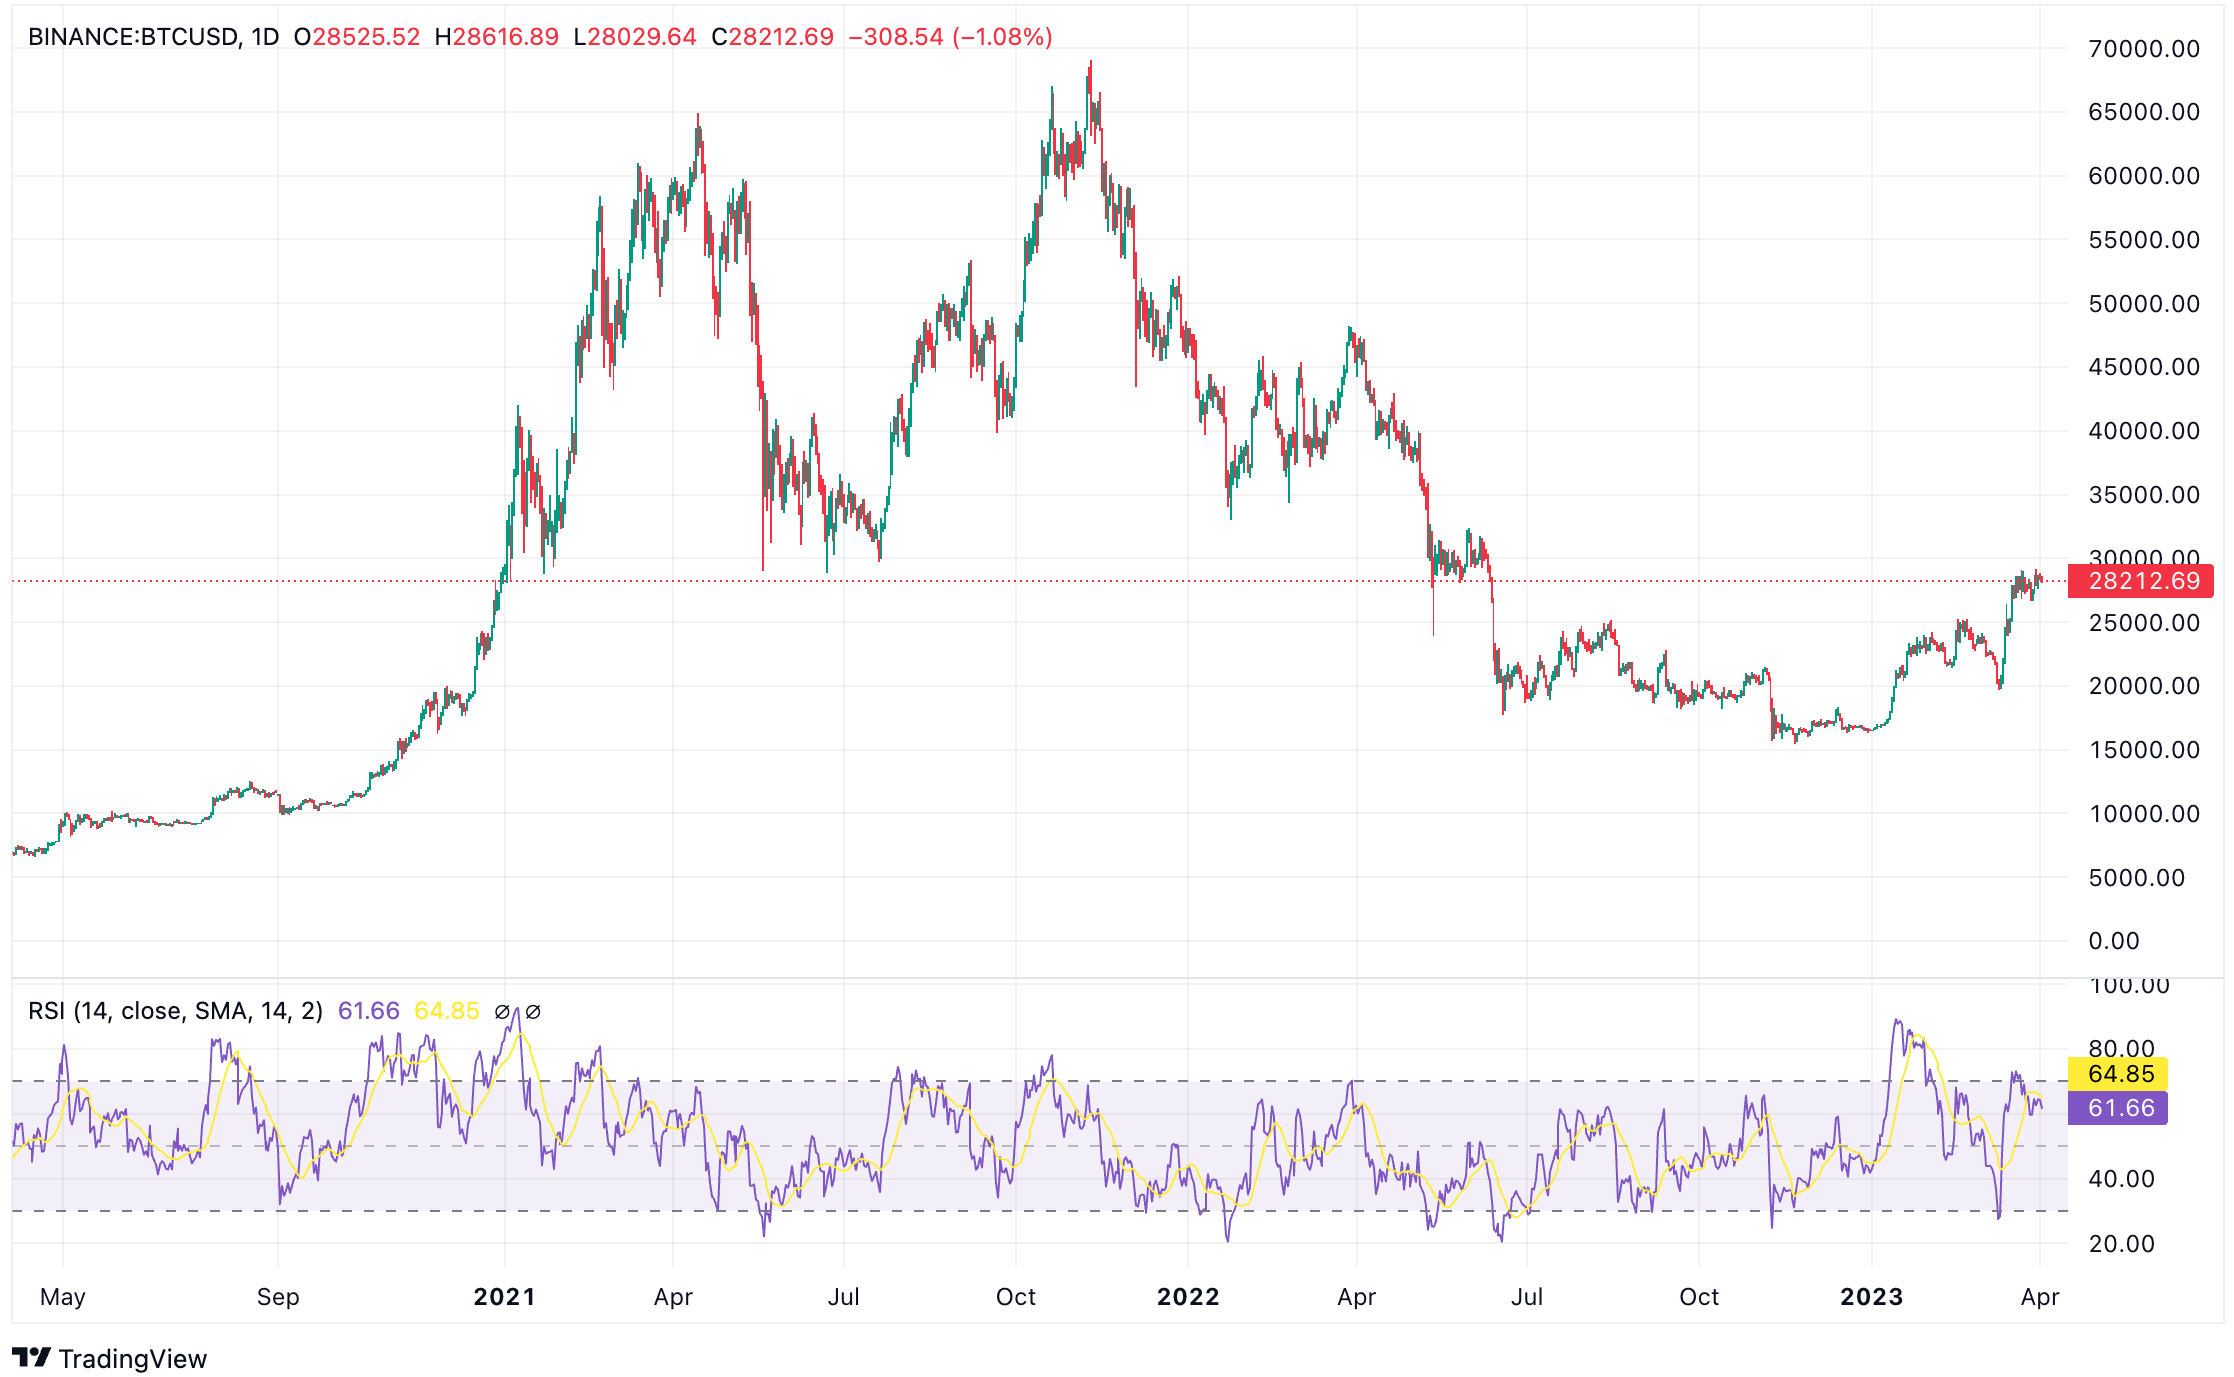
Example: If the RSI for BTC reaches 75, it could signal that the market is overbought, and a potential price reversal might be imminent. On the other hand, if the RSI drops to 25, it might indicate that the market is oversold, and the price could soon rise.
Moving Average Convergence Divergence (MACD) – MACD BTC Prediction
The Moving Average Convergence Divergence (MACD) is a trend-following momentum indicator that shows the relationship between two moving averages of an asset’s price.
It’s calculated by subtracting the longer moving average (typically 26 periods) from the shorter moving average (usually 12 periods).
The MACD line is then plotted along with a signal line (a 9-period EMA of the MACD line), and the difference between the two lines is displayed as a histogram.
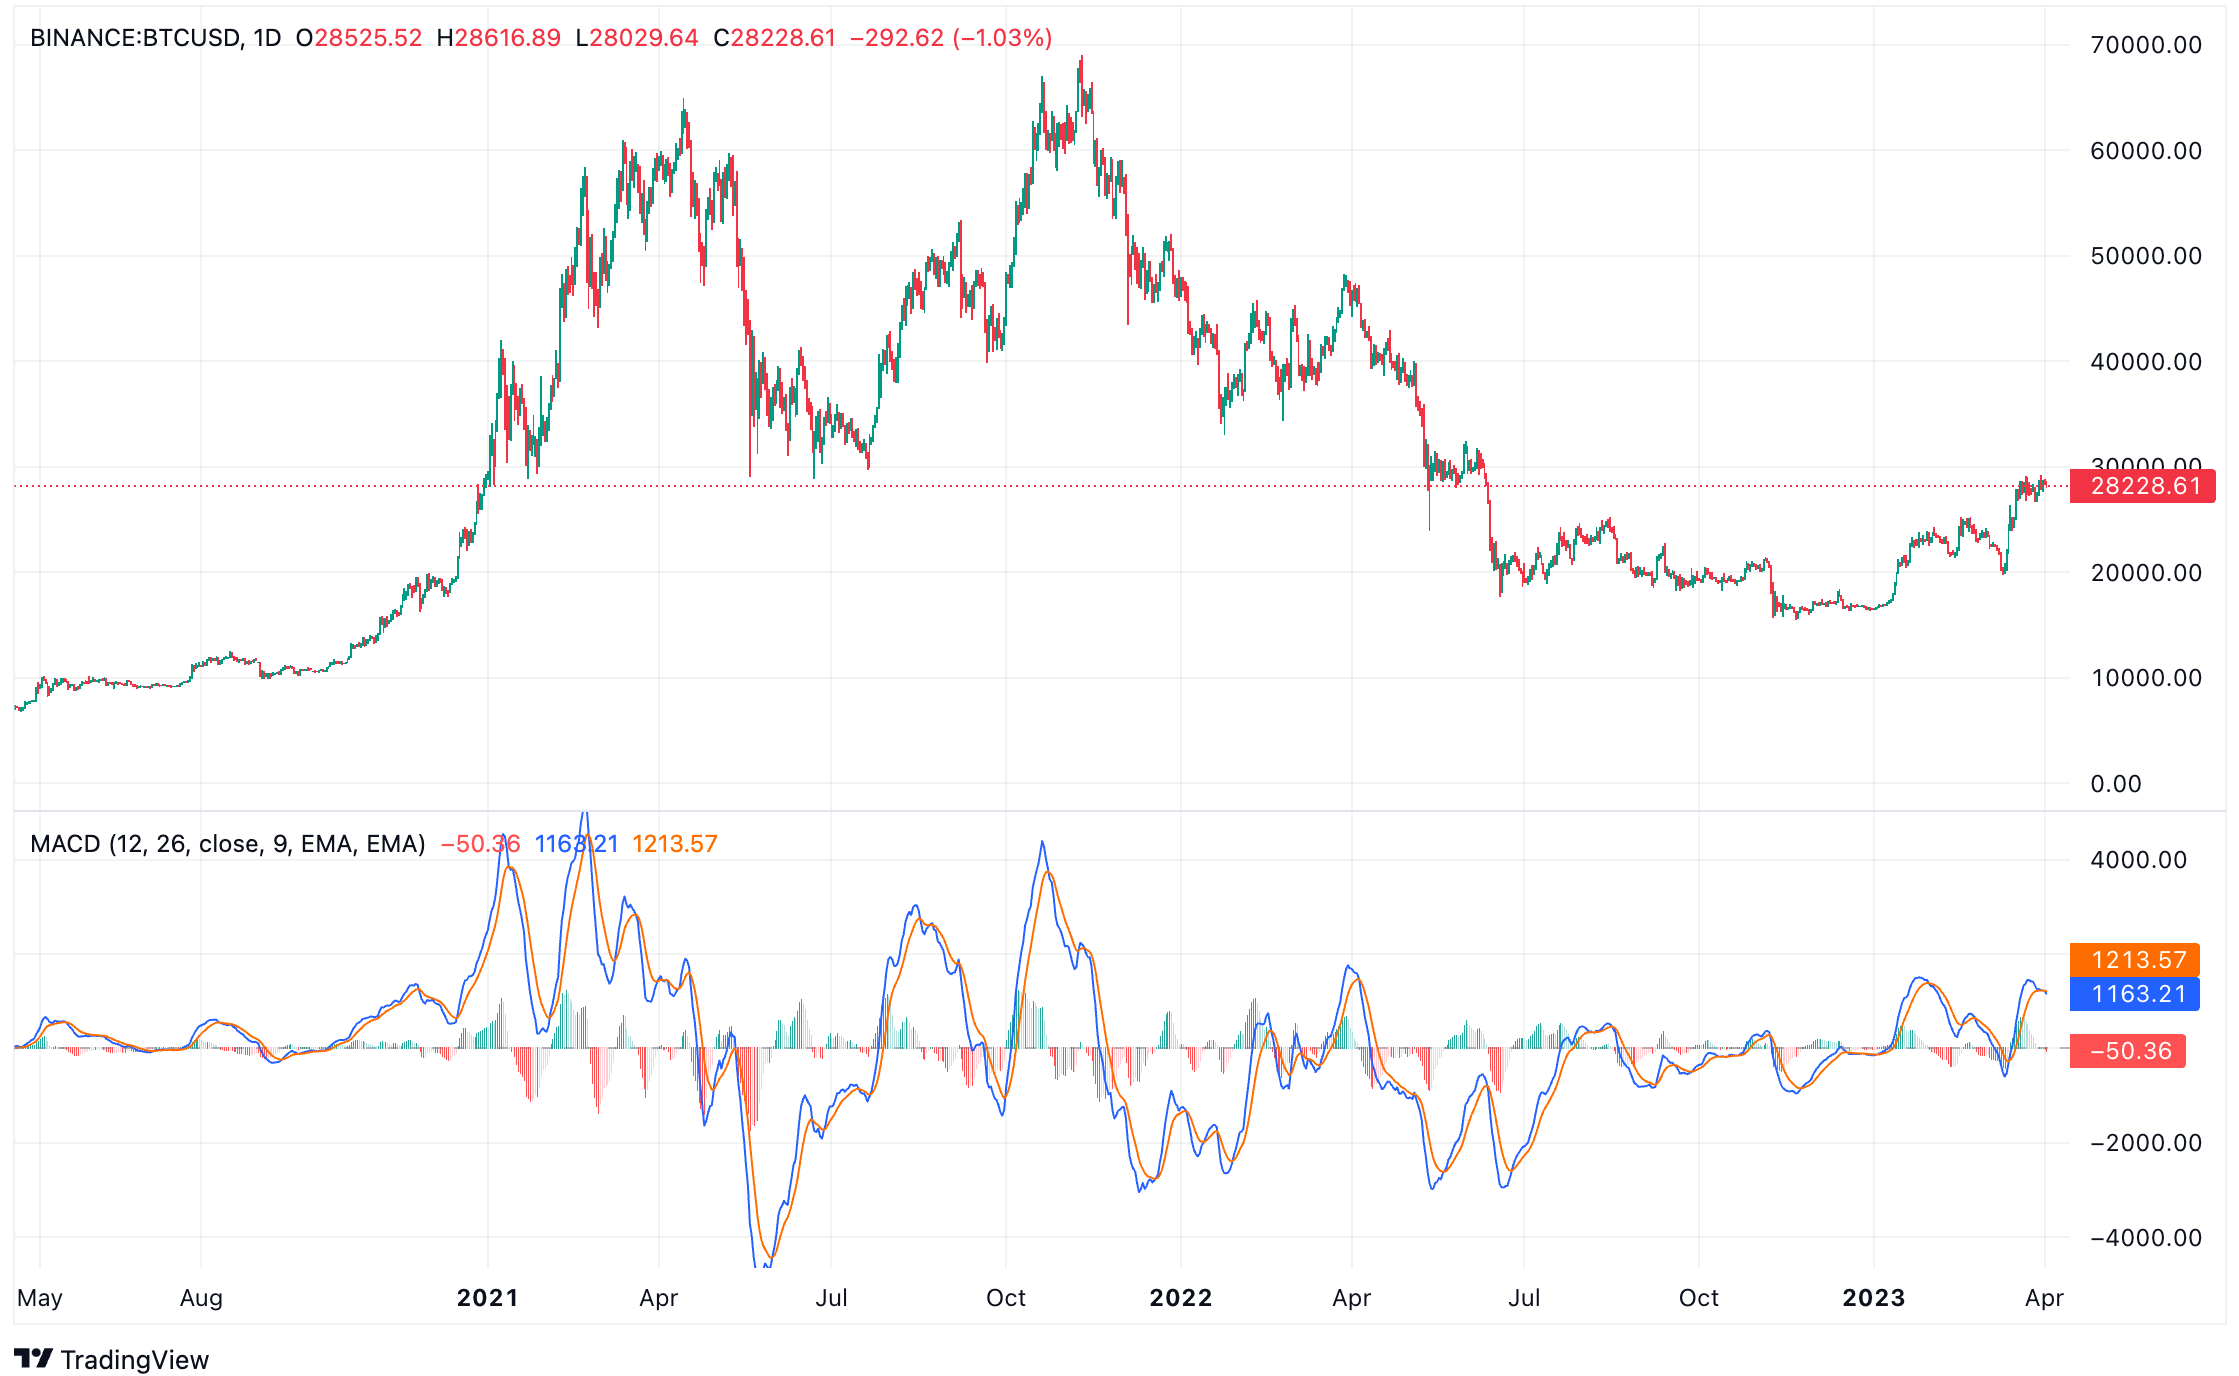
Example: When the MACD line crosses above the signal line, it could indicate a bullish signal, suggesting that it might be a good time to purchase BTC. Conversely, if the MACD line crosses below the signal line, it could signal a bearish trend, implying that it might be time to sell or short Bitcoin.
Bollinger Bands – For Bitcoin Price Prediction
Bollinger Bands are a versatile technical indicator developed by John Bollinger in the 1980s.
They consist of a simple moving average (typically 20 periods) and two standard deviations above and below the moving average.
These bands expand and contract based on market volatility, providing traders with useful information on potential price movements.
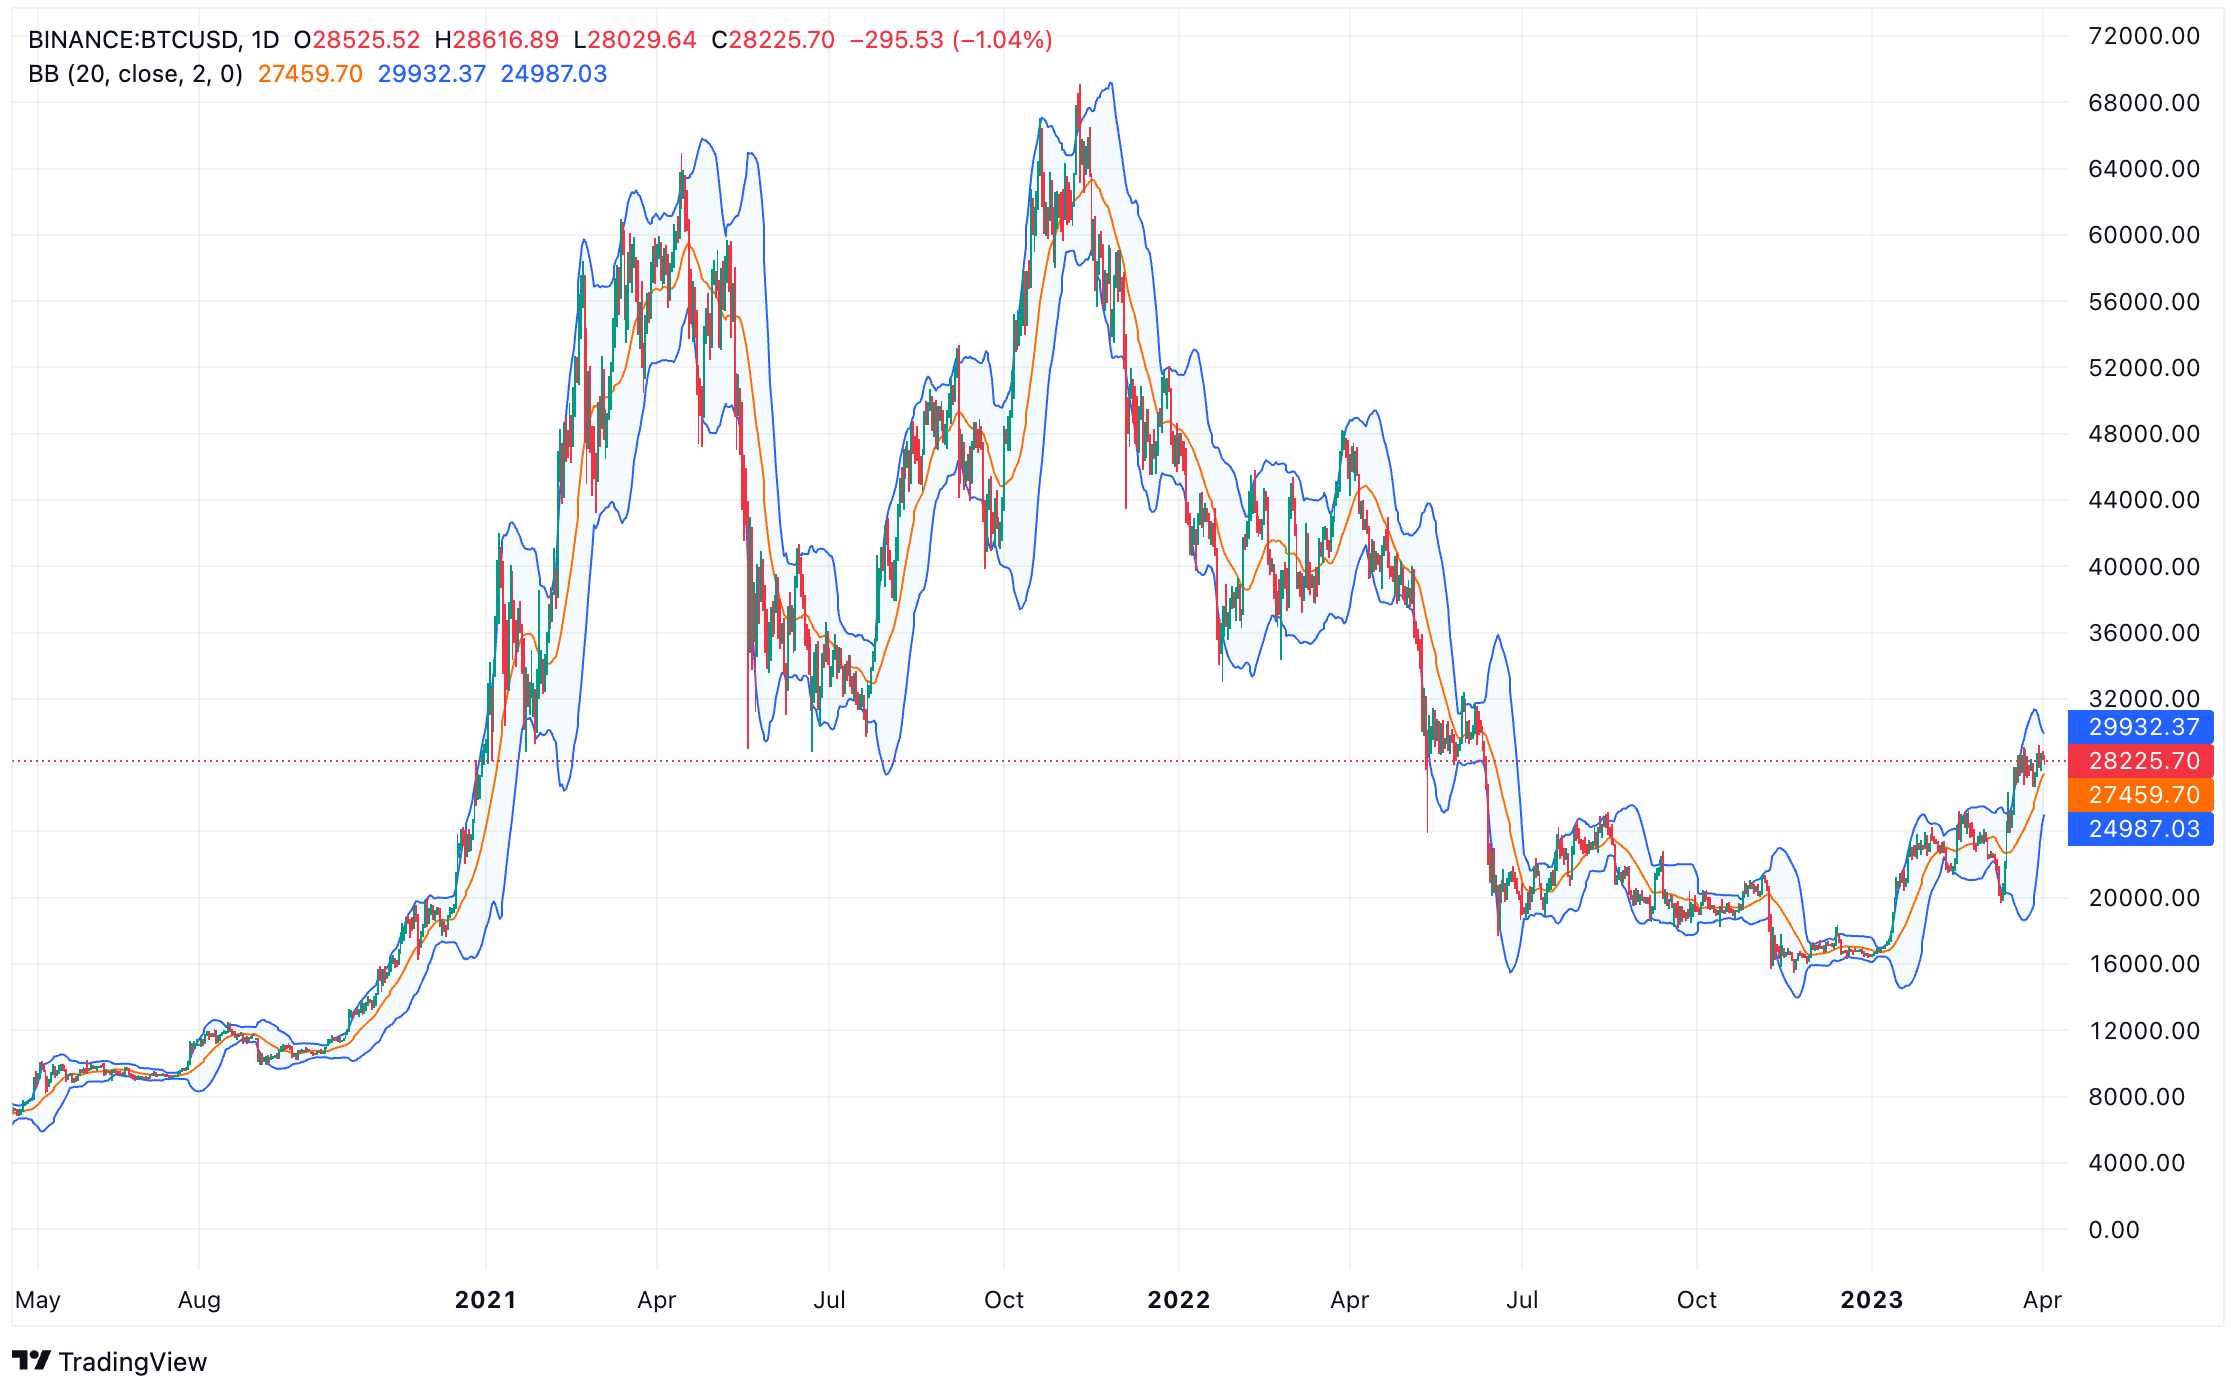
Example: When Bitcoin’s price moves close to the upper Bollinger Band, it might indicate that the market is overbought, and a price reversal could be imminent. Conversely, when the price approaches the lower band, it could signal that the market is oversold, and a price increase might be on the horizon. If the bands are narrowing, it might suggest decreasing volatility, while widening bands could indicate increasing volatility.
Stochastic Oscillator For Bitcoin Price Prediction
The Stochastic Oscillator is a momentum indicator that compares an asset’s closing price to its price range over a specific period.
It ranges from 0 to 100 and is composed of two lines: %K and %D. The %K line represents the current market rate for the various asset classes, while the %D line is a moving average of %K.
Traders use the Stochastic Oscillator to identify overbought and oversold conditions, as well as potential trend reversals.
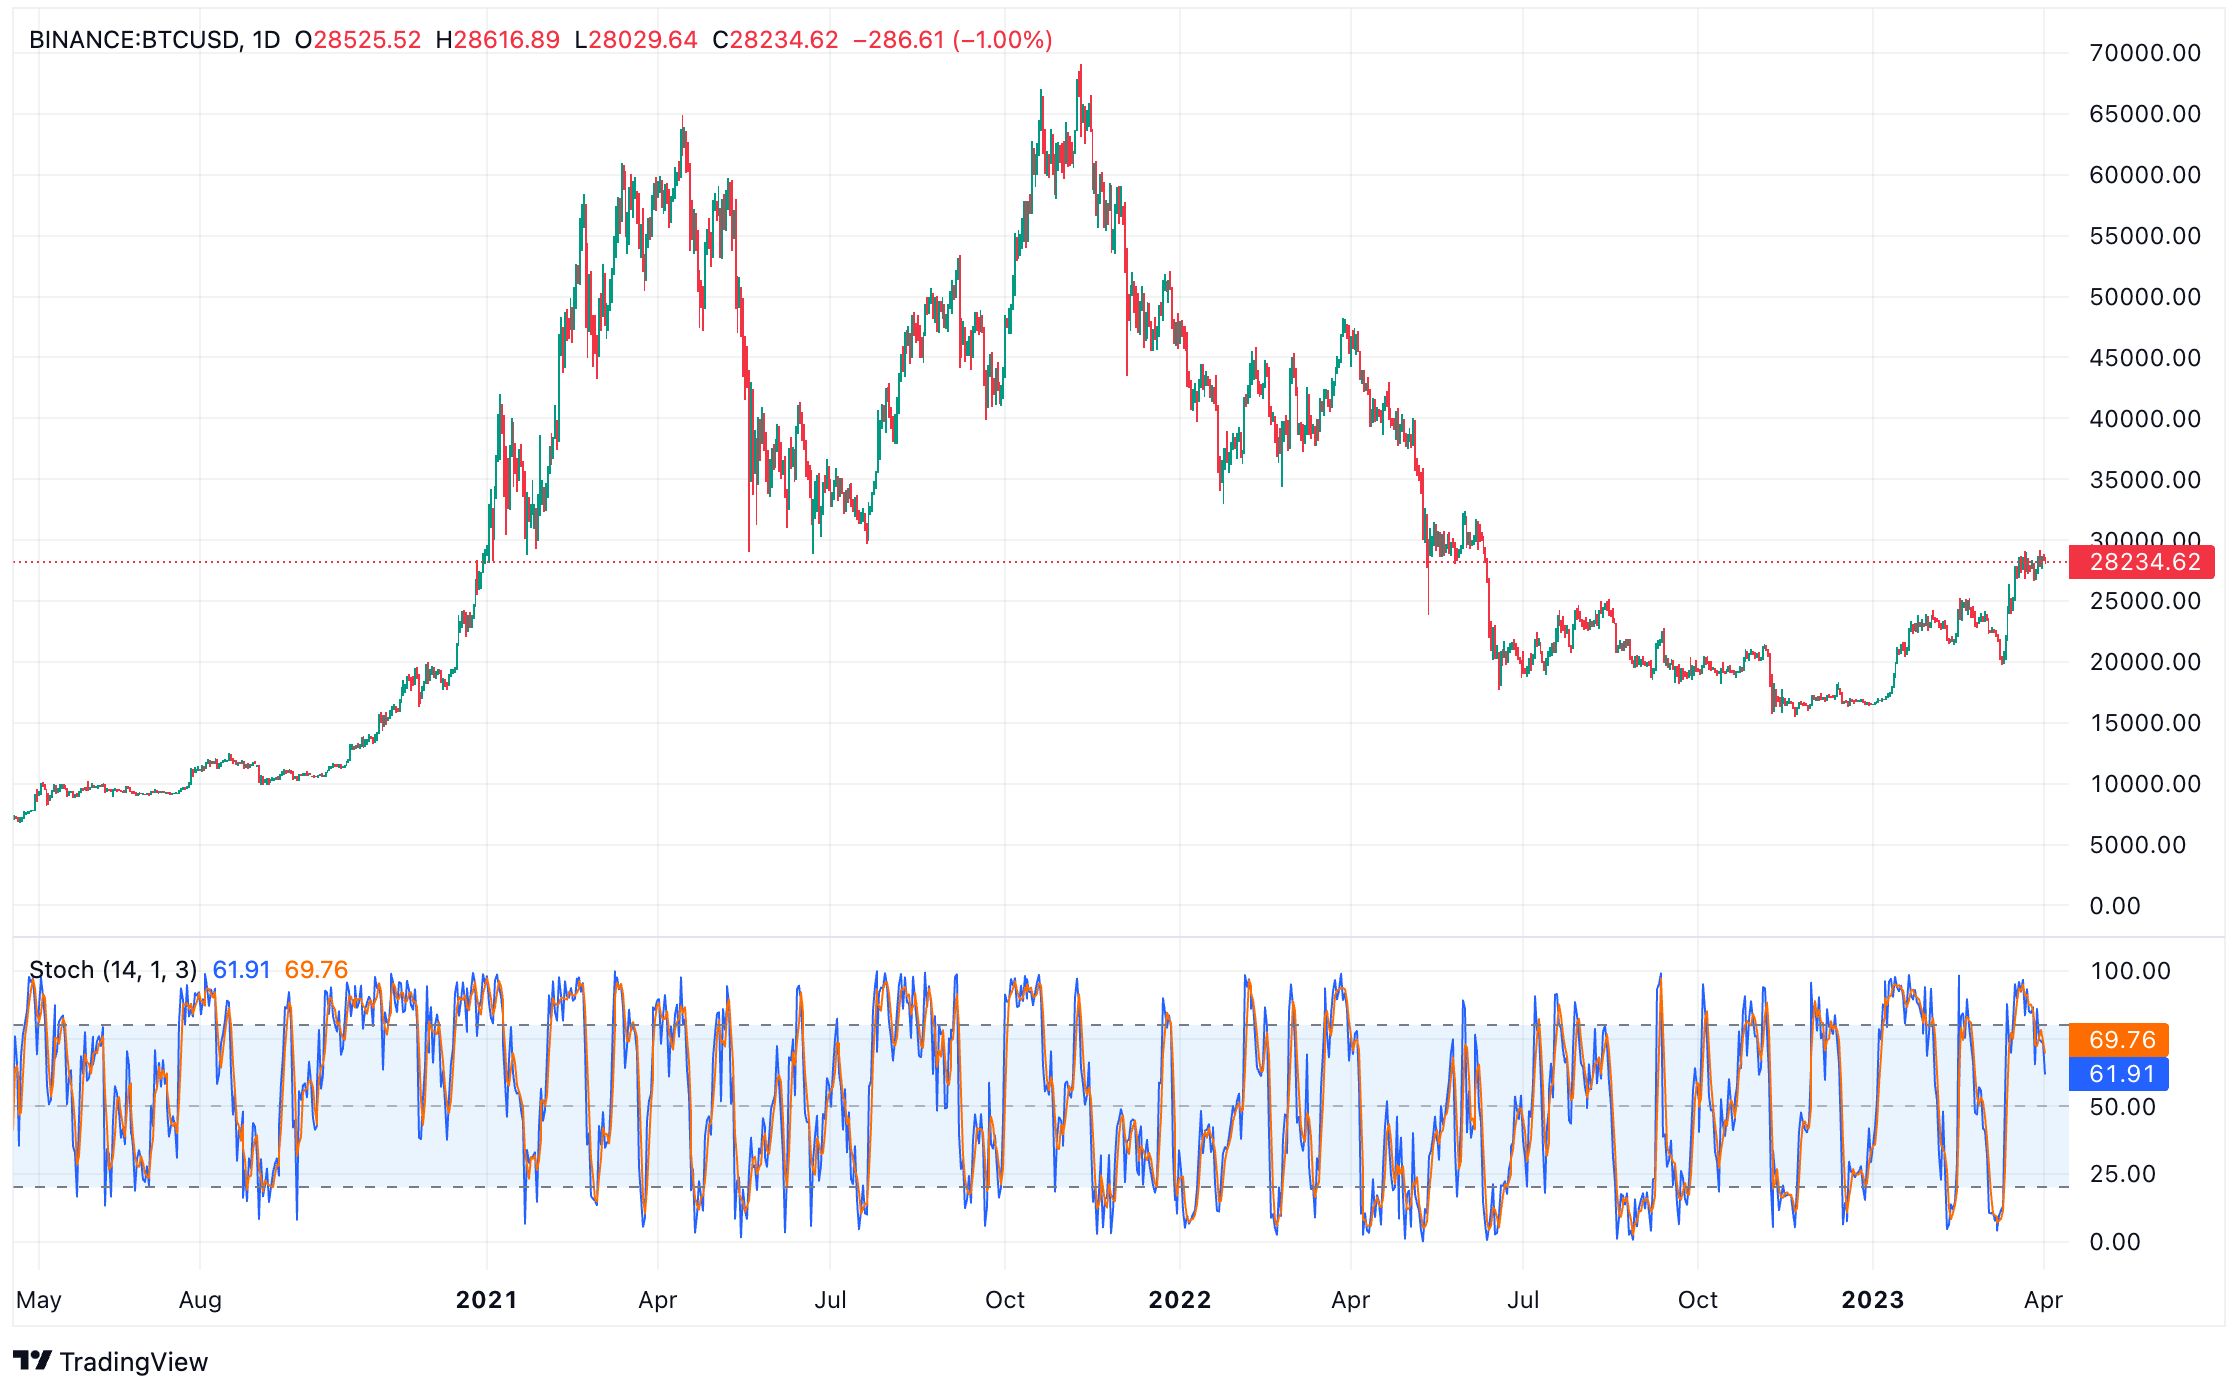
Example: When the %K line crosses above the %D line and both lines are below 20, it could indicate a bullish signal for BTC, suggesting that the market is oversold and the price might soon rise. If the %K line crosses below the %D line and both lines are above 80, it could signal a bearish trend, implying that the market is overbought and the price might drop.
Parabolic SAR (Stop and Reverse) For Bitcoin Price Prediction
The Parabolic SAR (Stop and Reverse) is a trend-following indicator developed by J. Welles Wilder Jr. It helps traders identify potential entry and exit points in trending markets.
The Parabolic SAR is plotted as a series of dots above or below the price, depending on the direction of the trend.
When the dots are below the price, it indicates an uptrend, and when they’re above the price, it suggests a downtrend.
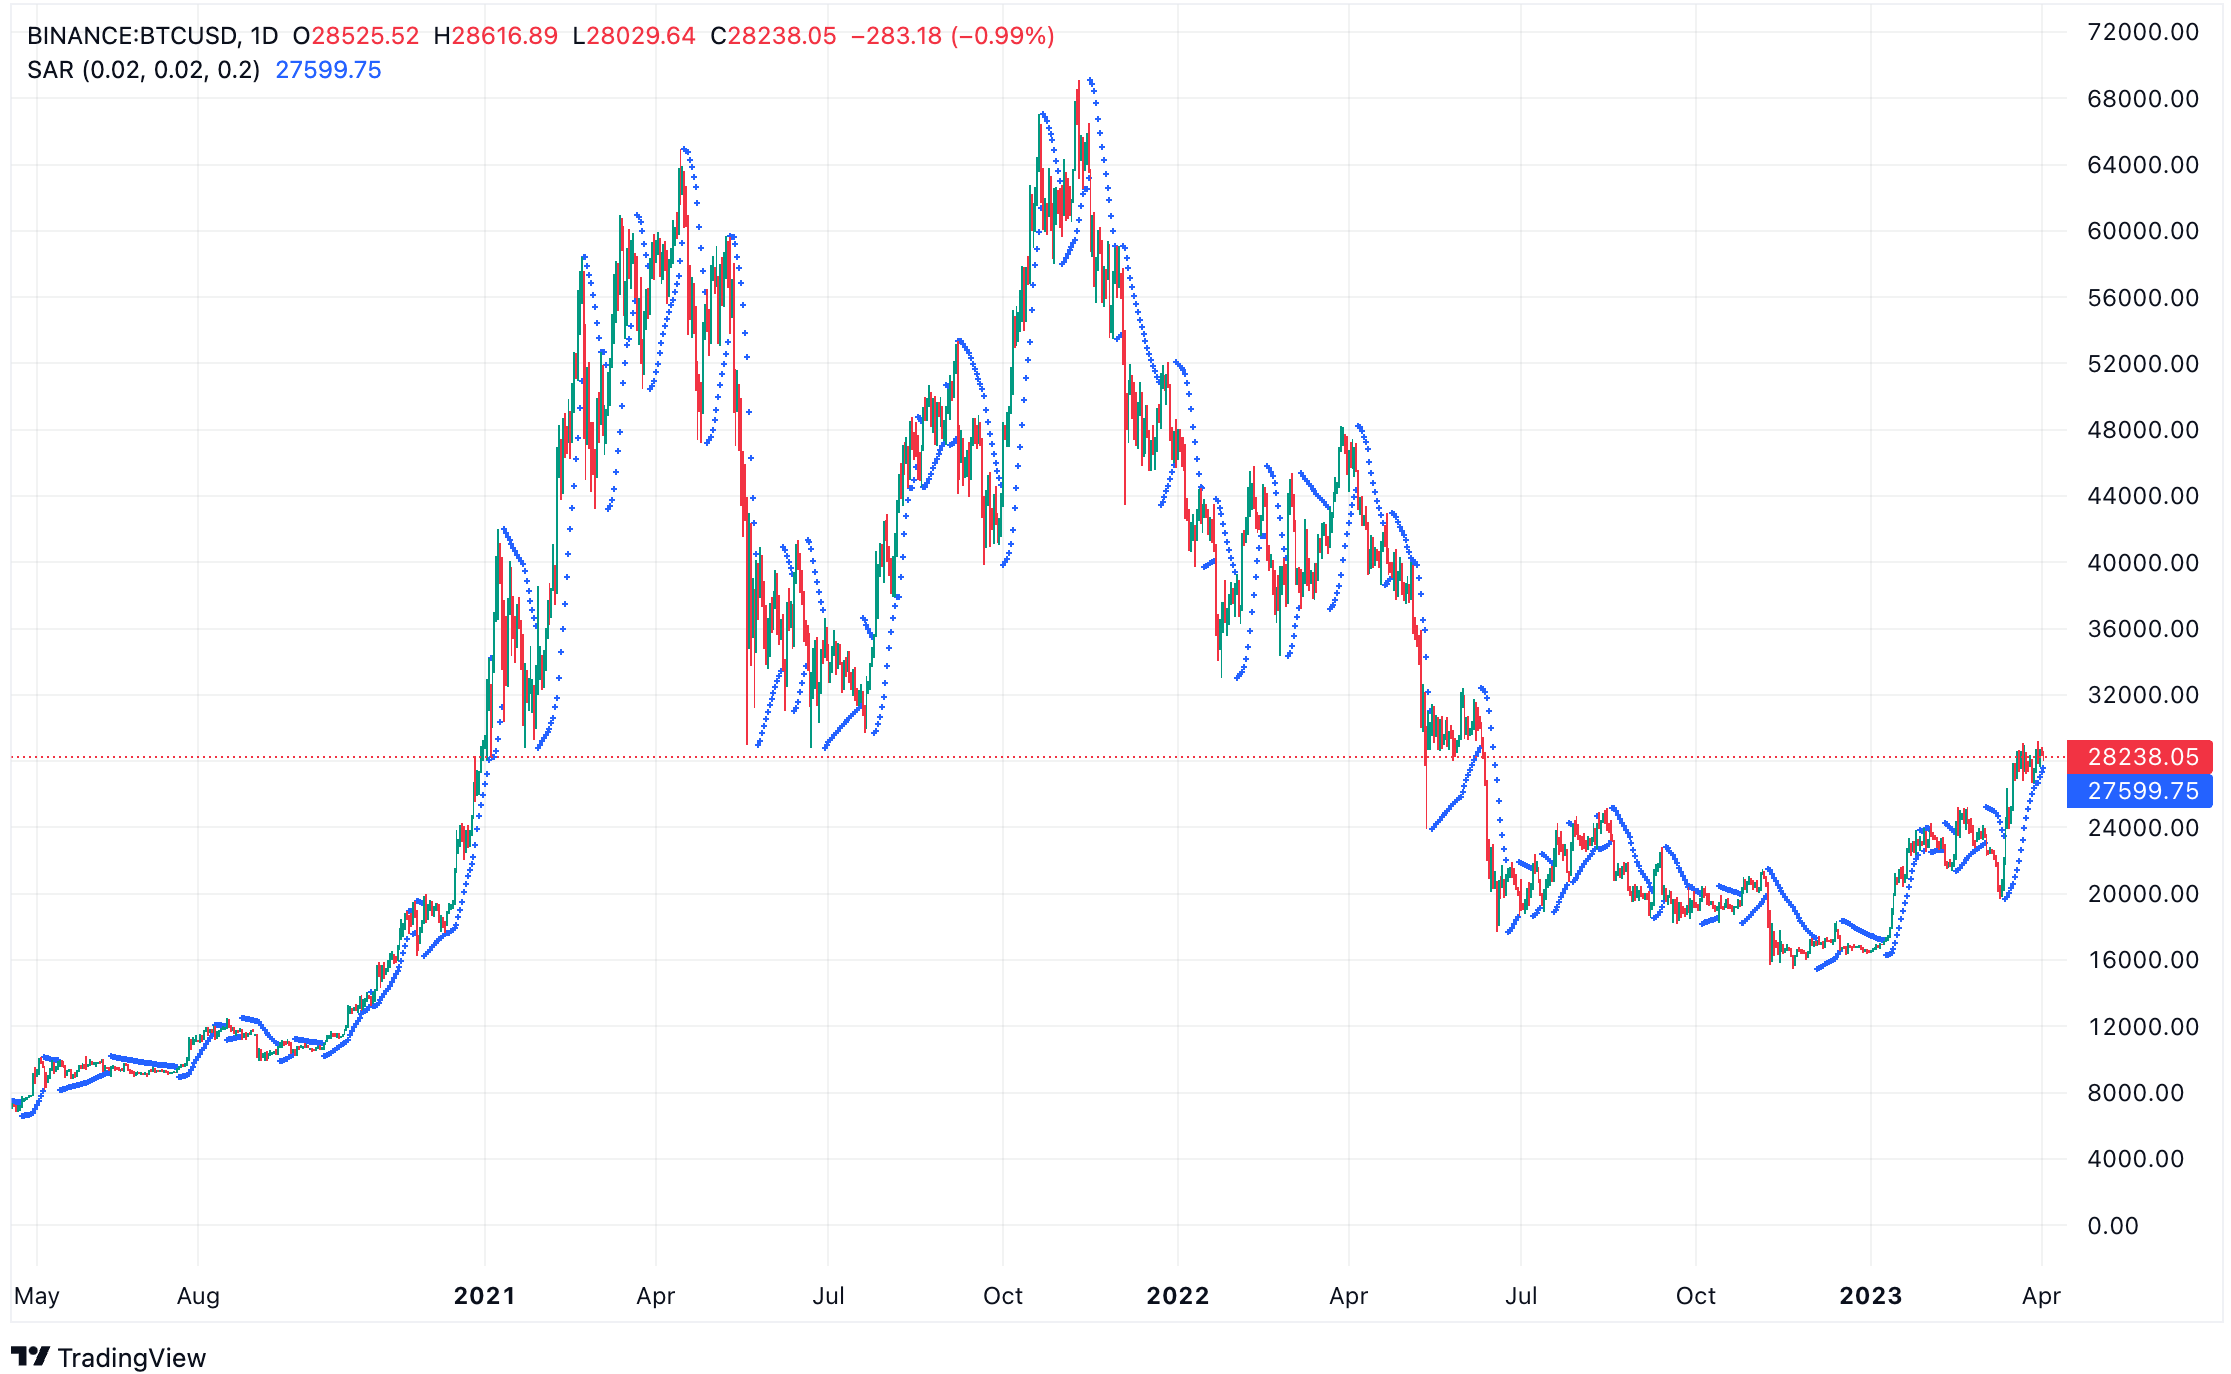
Example: If the Parabolic SAR dots are below Bitcoin’s price, it might be a good time to consider entering a long position, as the trend appears to be bullish. However, if the dots are above the price, it could be a signal to exit a long position or enter a short position, as the trend seems to be bearish.
Ichimoku Cloud For Bitcoin Price Prediction
The Ichimoku Cloud, also known as the Ichimoku Kinko Hyo, is a comprehensive indicator developed by Goichi Hosoda in the 1960s.
It provides a holistic view of market trends, support and resistance levels, and potential buy and sell signals.
The Ichimoku Cloud comprises five lines: Tenkan-sen, Kijun-sen, Senkou Span A, Senkou Span B, and Chikou Span. The space between Senkou Span A and Senkou Span B forms the “cloud.”
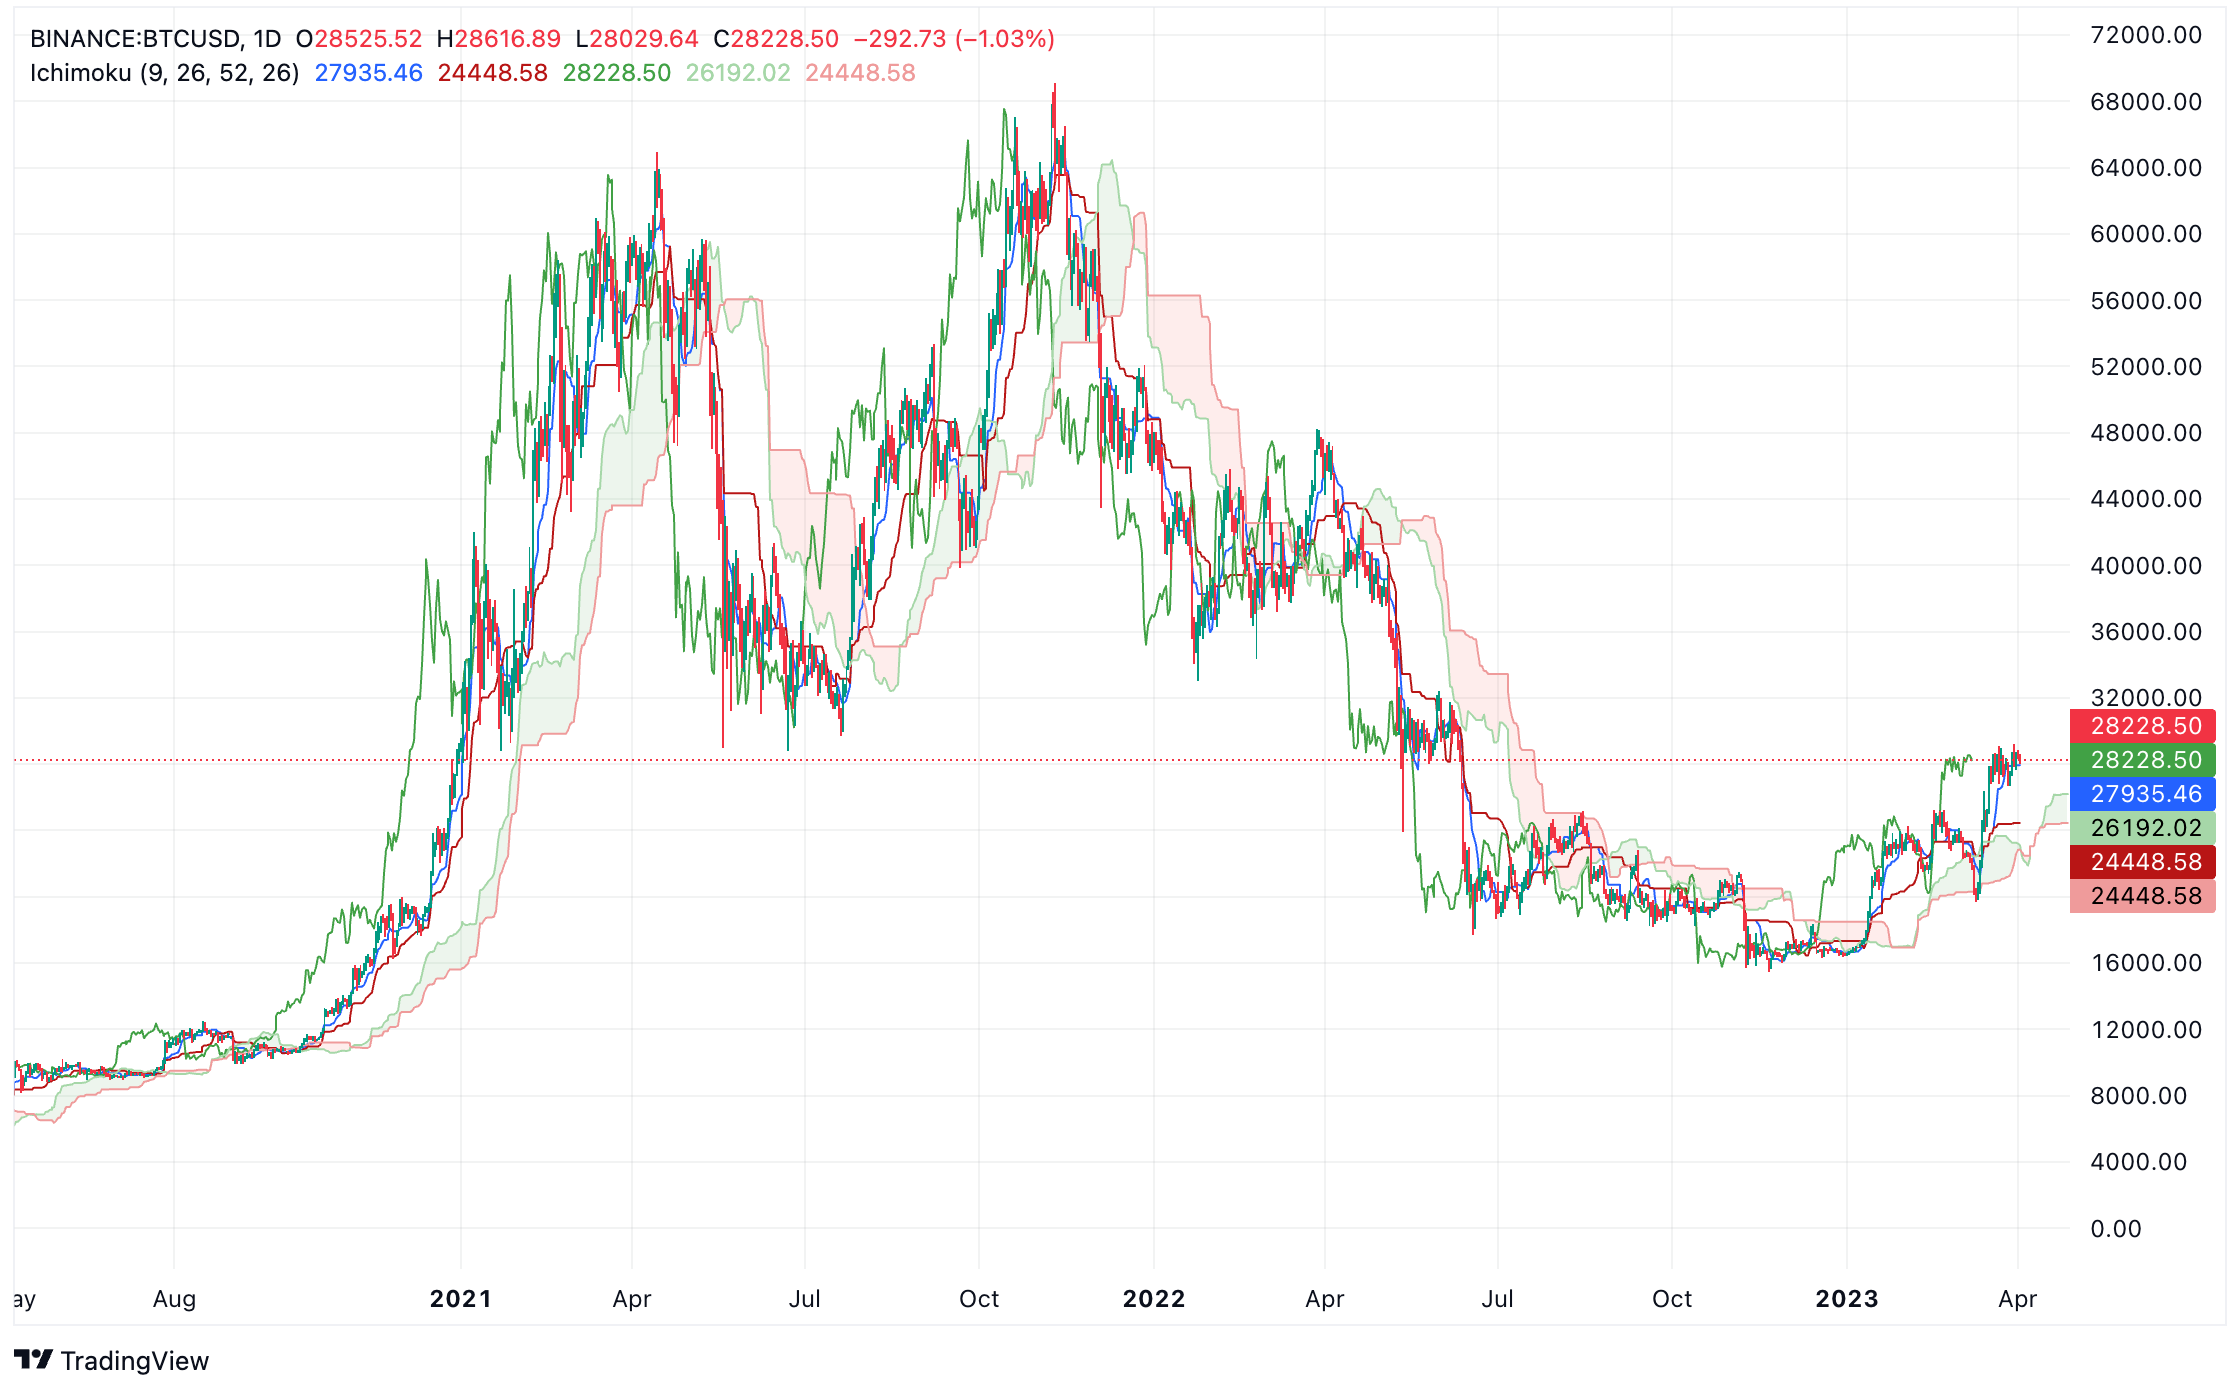
Example: When analyzing Bitcoin’s price using the Ichimoku Cloud, if the price is above the cloud, it might indicate a bullish trend, and you could consider going long. Conversely, if the price is below the cloud, it could suggest a bearish trend, and shorting might be an option. Additionally, if the Tenkan-sen crosses above the Kijun-sen, it could provide a buy signal, while a cross below could be a sell signal.
Fibonacci Retracement For Bitcoin Price Prediction
Fibonacci Retracement is a popular technical analysis tool based on the famous Fibonacci sequence, a series of numbers in which each number is the sum of the two preceding ones.
Traders use Fibonacci Retracement levels to identify potential support and resistance areas during market corrections. The most commonly used Fibonacci levels are 23.6%, 38.2%, 50%, 61.8%, and 78.6%.
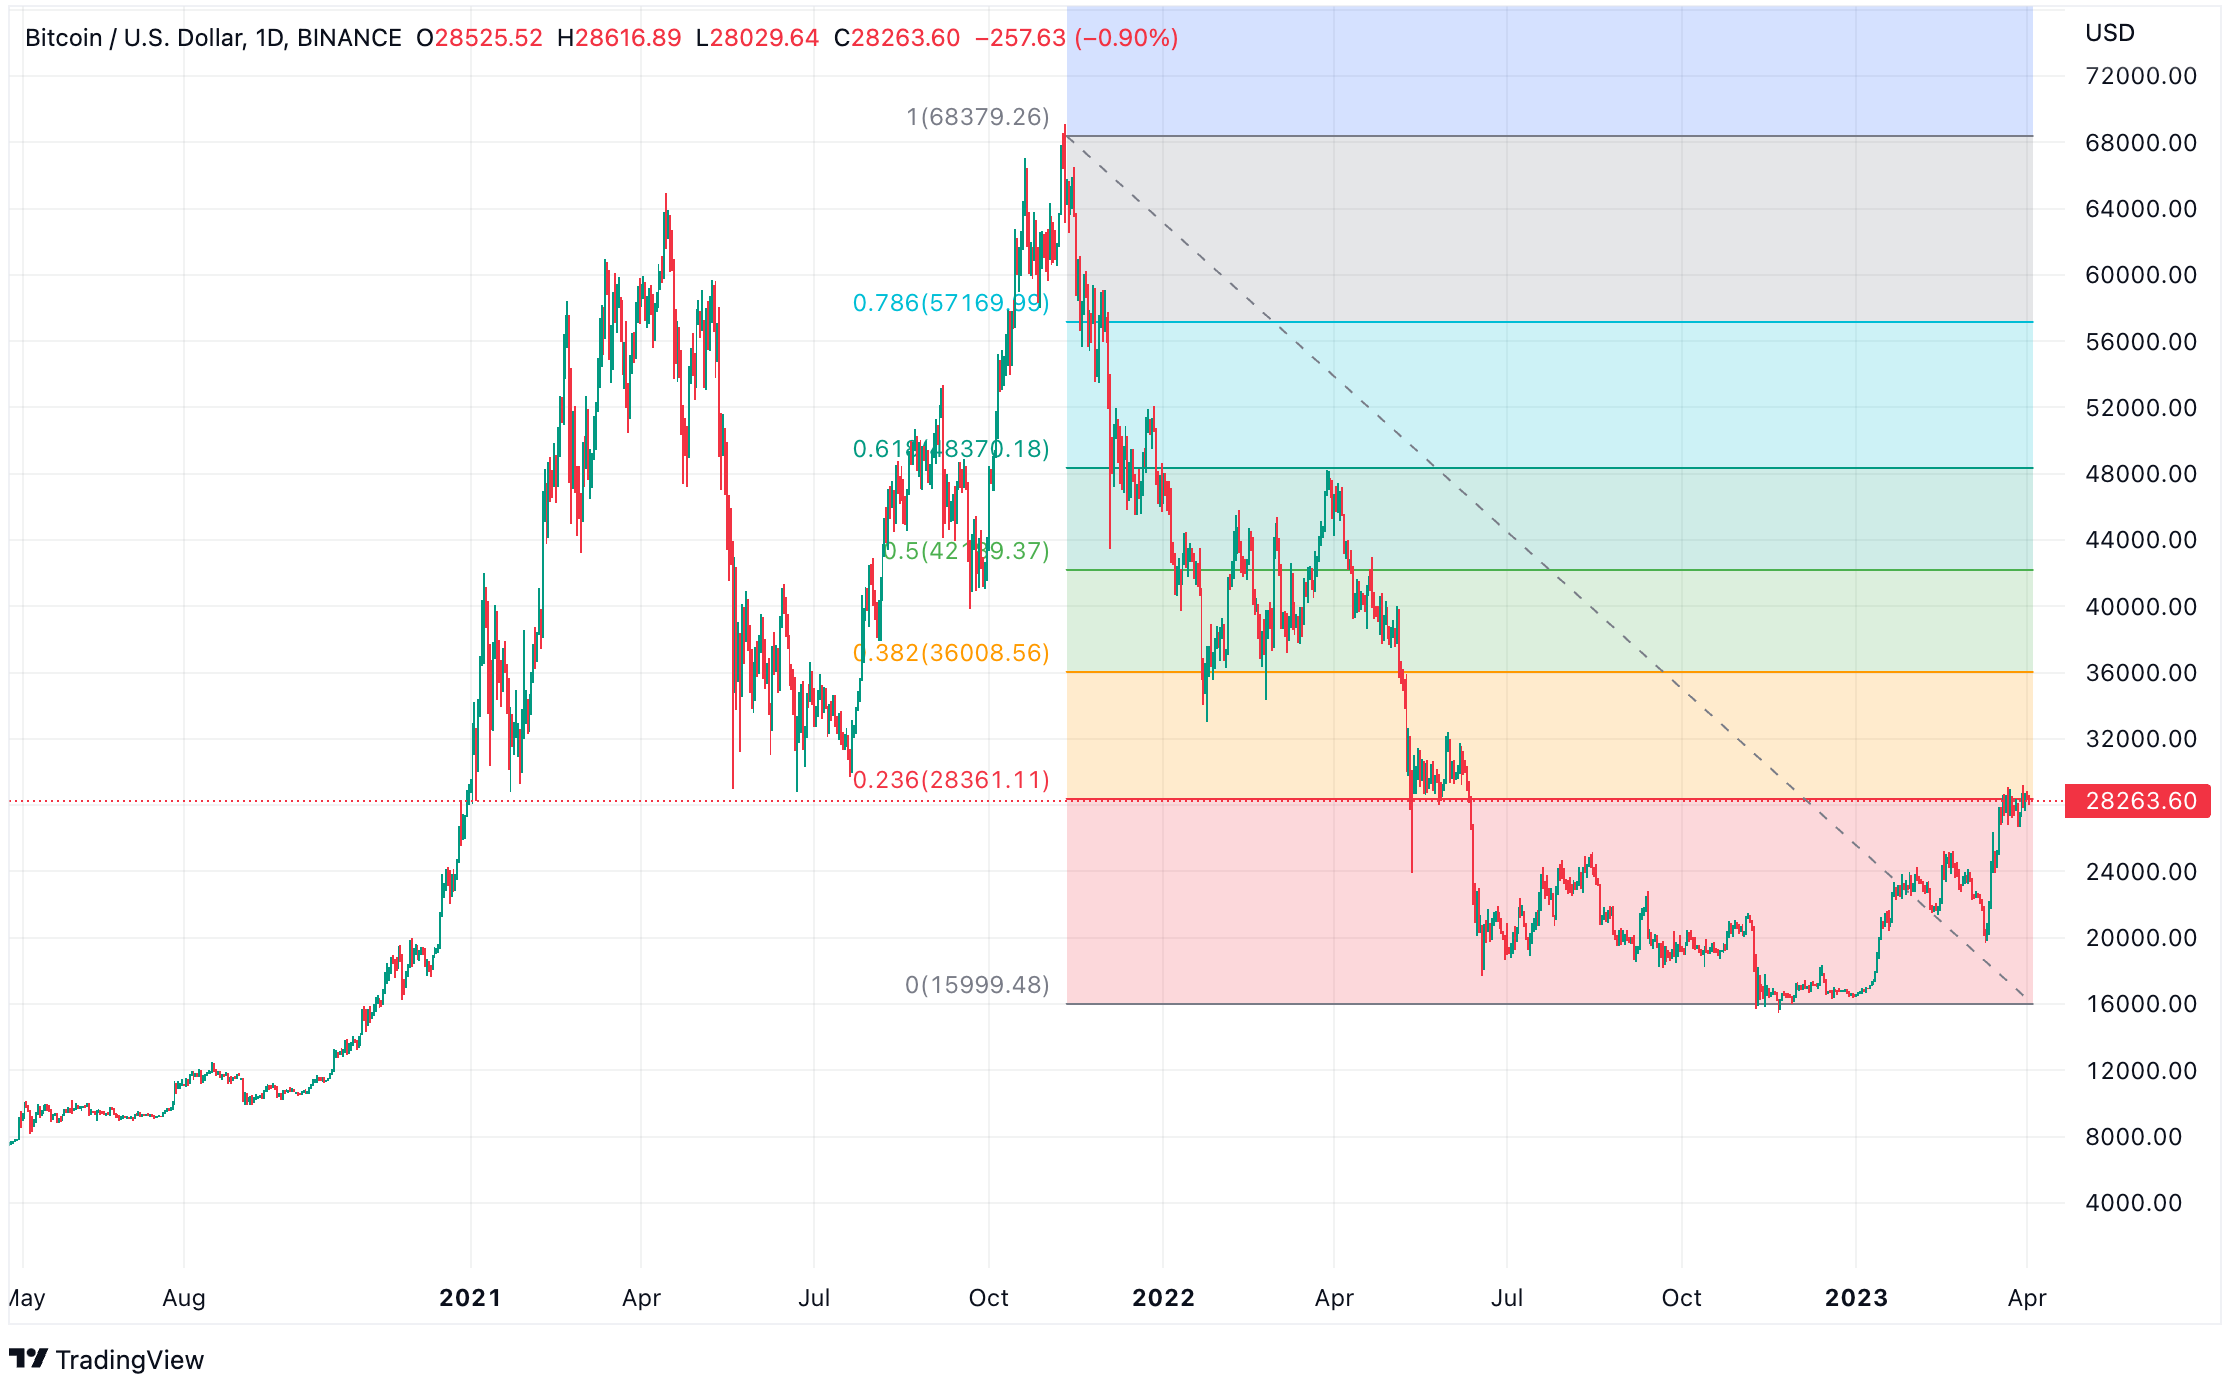
Example: When BTC experiences a significant price increase followed by a pullback, you can apply Fibonacci Retracement levels to help predict potential reversal points. If the price retraces to the 50% level and then starts to bounce back, it could signal a continuation of the uptrend, and you might consider entering a long position.
Average Directional Index (ADX) For Bitcoin Price Prediction
The Average Directional Index (ADX), developed by J. Welles Wilder Jr., is a trend strength indicator that measures the strength of a trend without considering its direction.
The ADX ranges from 0 to 100, with values above 25 indicating a strong trend and values below 20 suggesting a weak or non-trending market.
ADX is often used in conjunction with the Positive Directional Indicator (+DI) and Negative Directional Indicator (-DI) to identify the direction of the trend.
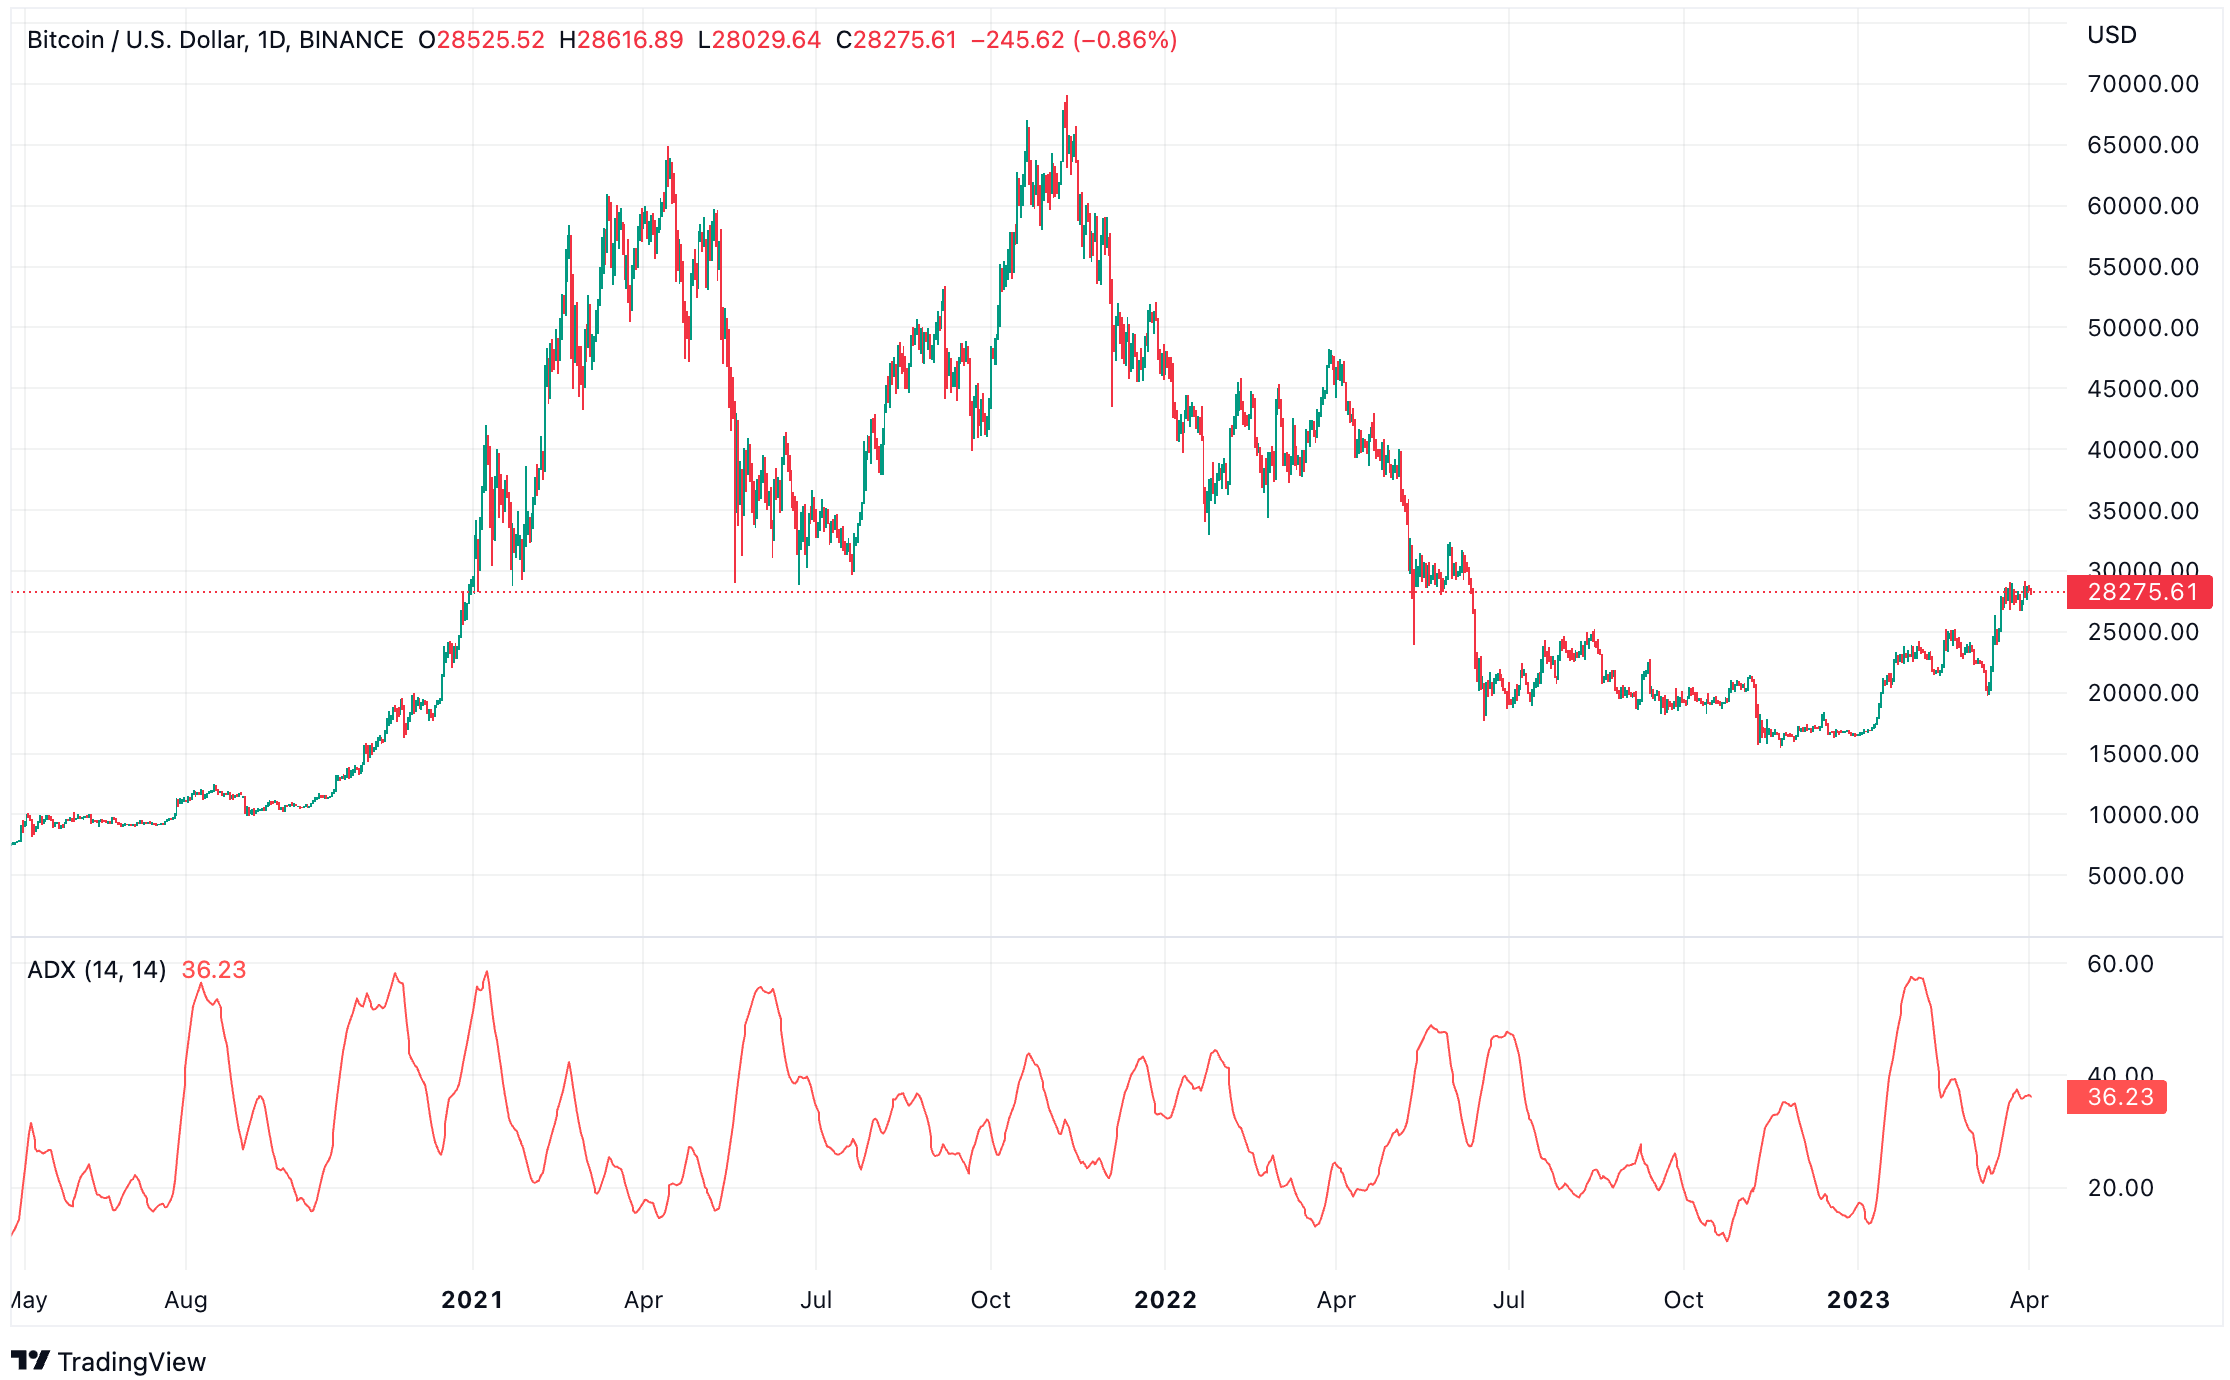
Example: When assessing Bitcoin’s price using the ADX, if the value is above 25 and the +DI is above the -DI, it might indicate a strong uptrend, and you could consider a long position. Conversely, if the ADX is above 25 and the -DI is above the +DI, it could signal a strong downtrend, and shorting might be a better option.
On Balance Volume (OBV) For Bitcoin Price Prediction
On Balance Volume (OBV), developed by Joe Granville, is a momentum-based indicator that measures the cumulative buying and selling pressure in an asset.
The OBV is calculated by adding the volume on up days and subtracting it on down days.
The idea behind this indicator is that volume tends to precede price, meaning that a rising OBV may suggest an upcoming price increase, while a declining OBV could indicate an impending price drop.
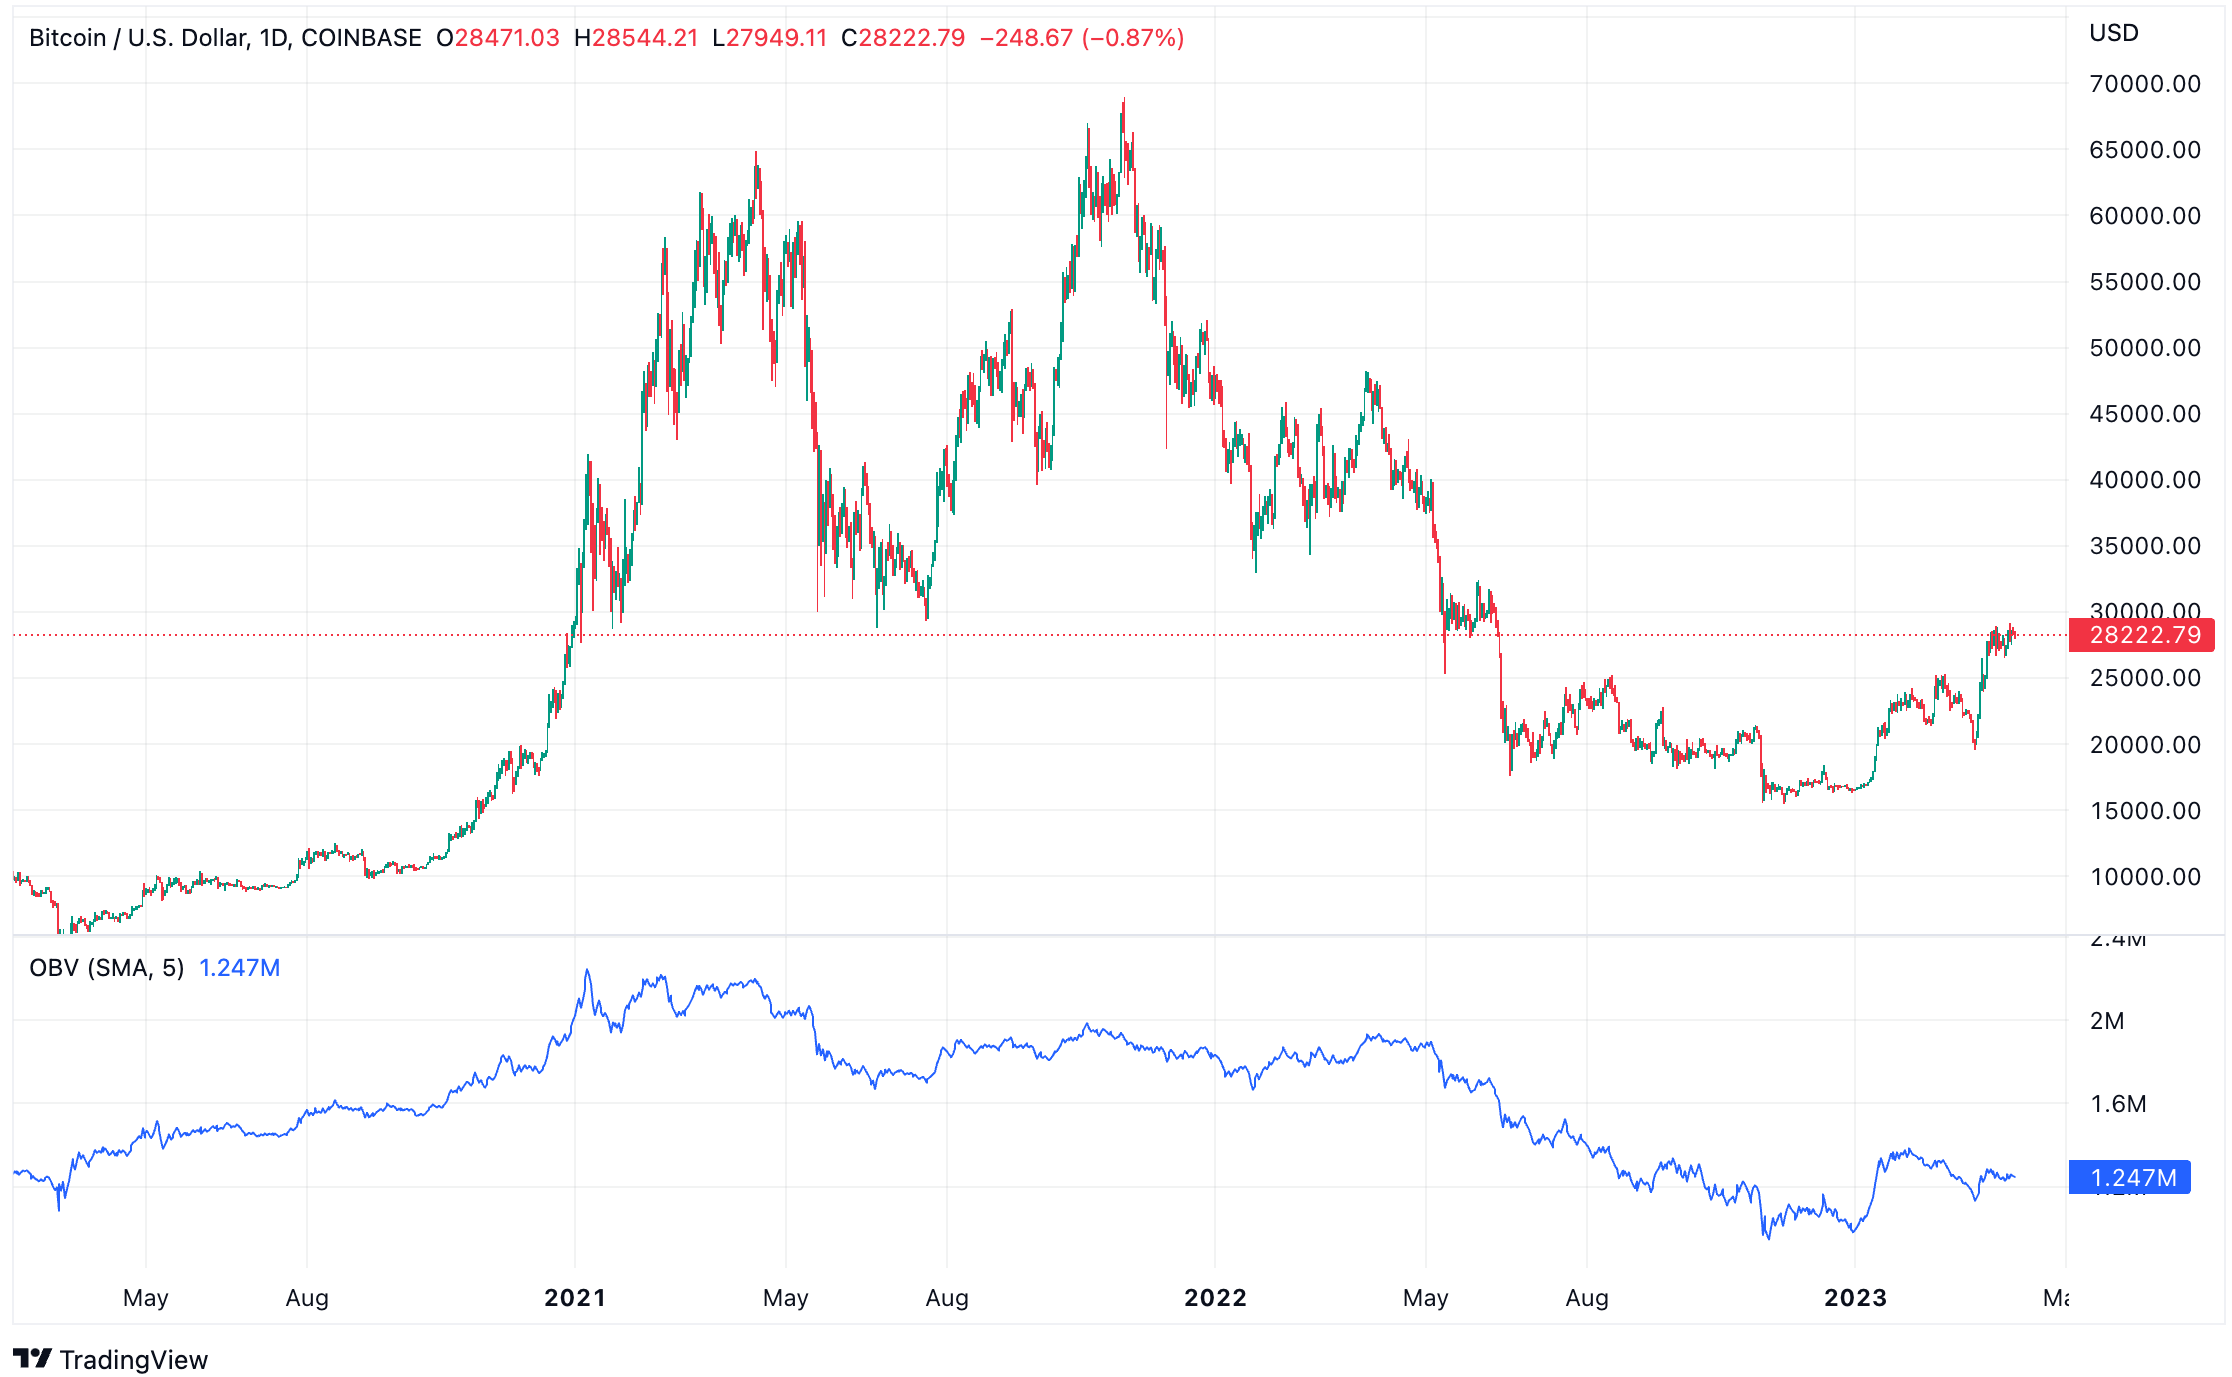
Example: When analyzing Bitcoin’s price using OBV, if you notice a divergence between the price and OBV trend, it could signal a potential price reversal. For instance, if Bitcoin’s price is making lower lows while the OBV is making higher lows, this bullish divergence may hint at an upcoming price increase, and you might consider entering a long position.
Rate of Change (ROC) For Bitcoin Price Prediction
The Rate of Change (ROC) is a momentum indicator that measures the percentage change in price over a specified period.
ROC can help identify trend direction, strength, and potential reversals.
A rising ROC suggests increasing momentum, while a falling ROC indicates decreasing momentum. ROC can also be used to identify overbought and oversold conditions when it reaches extreme values.
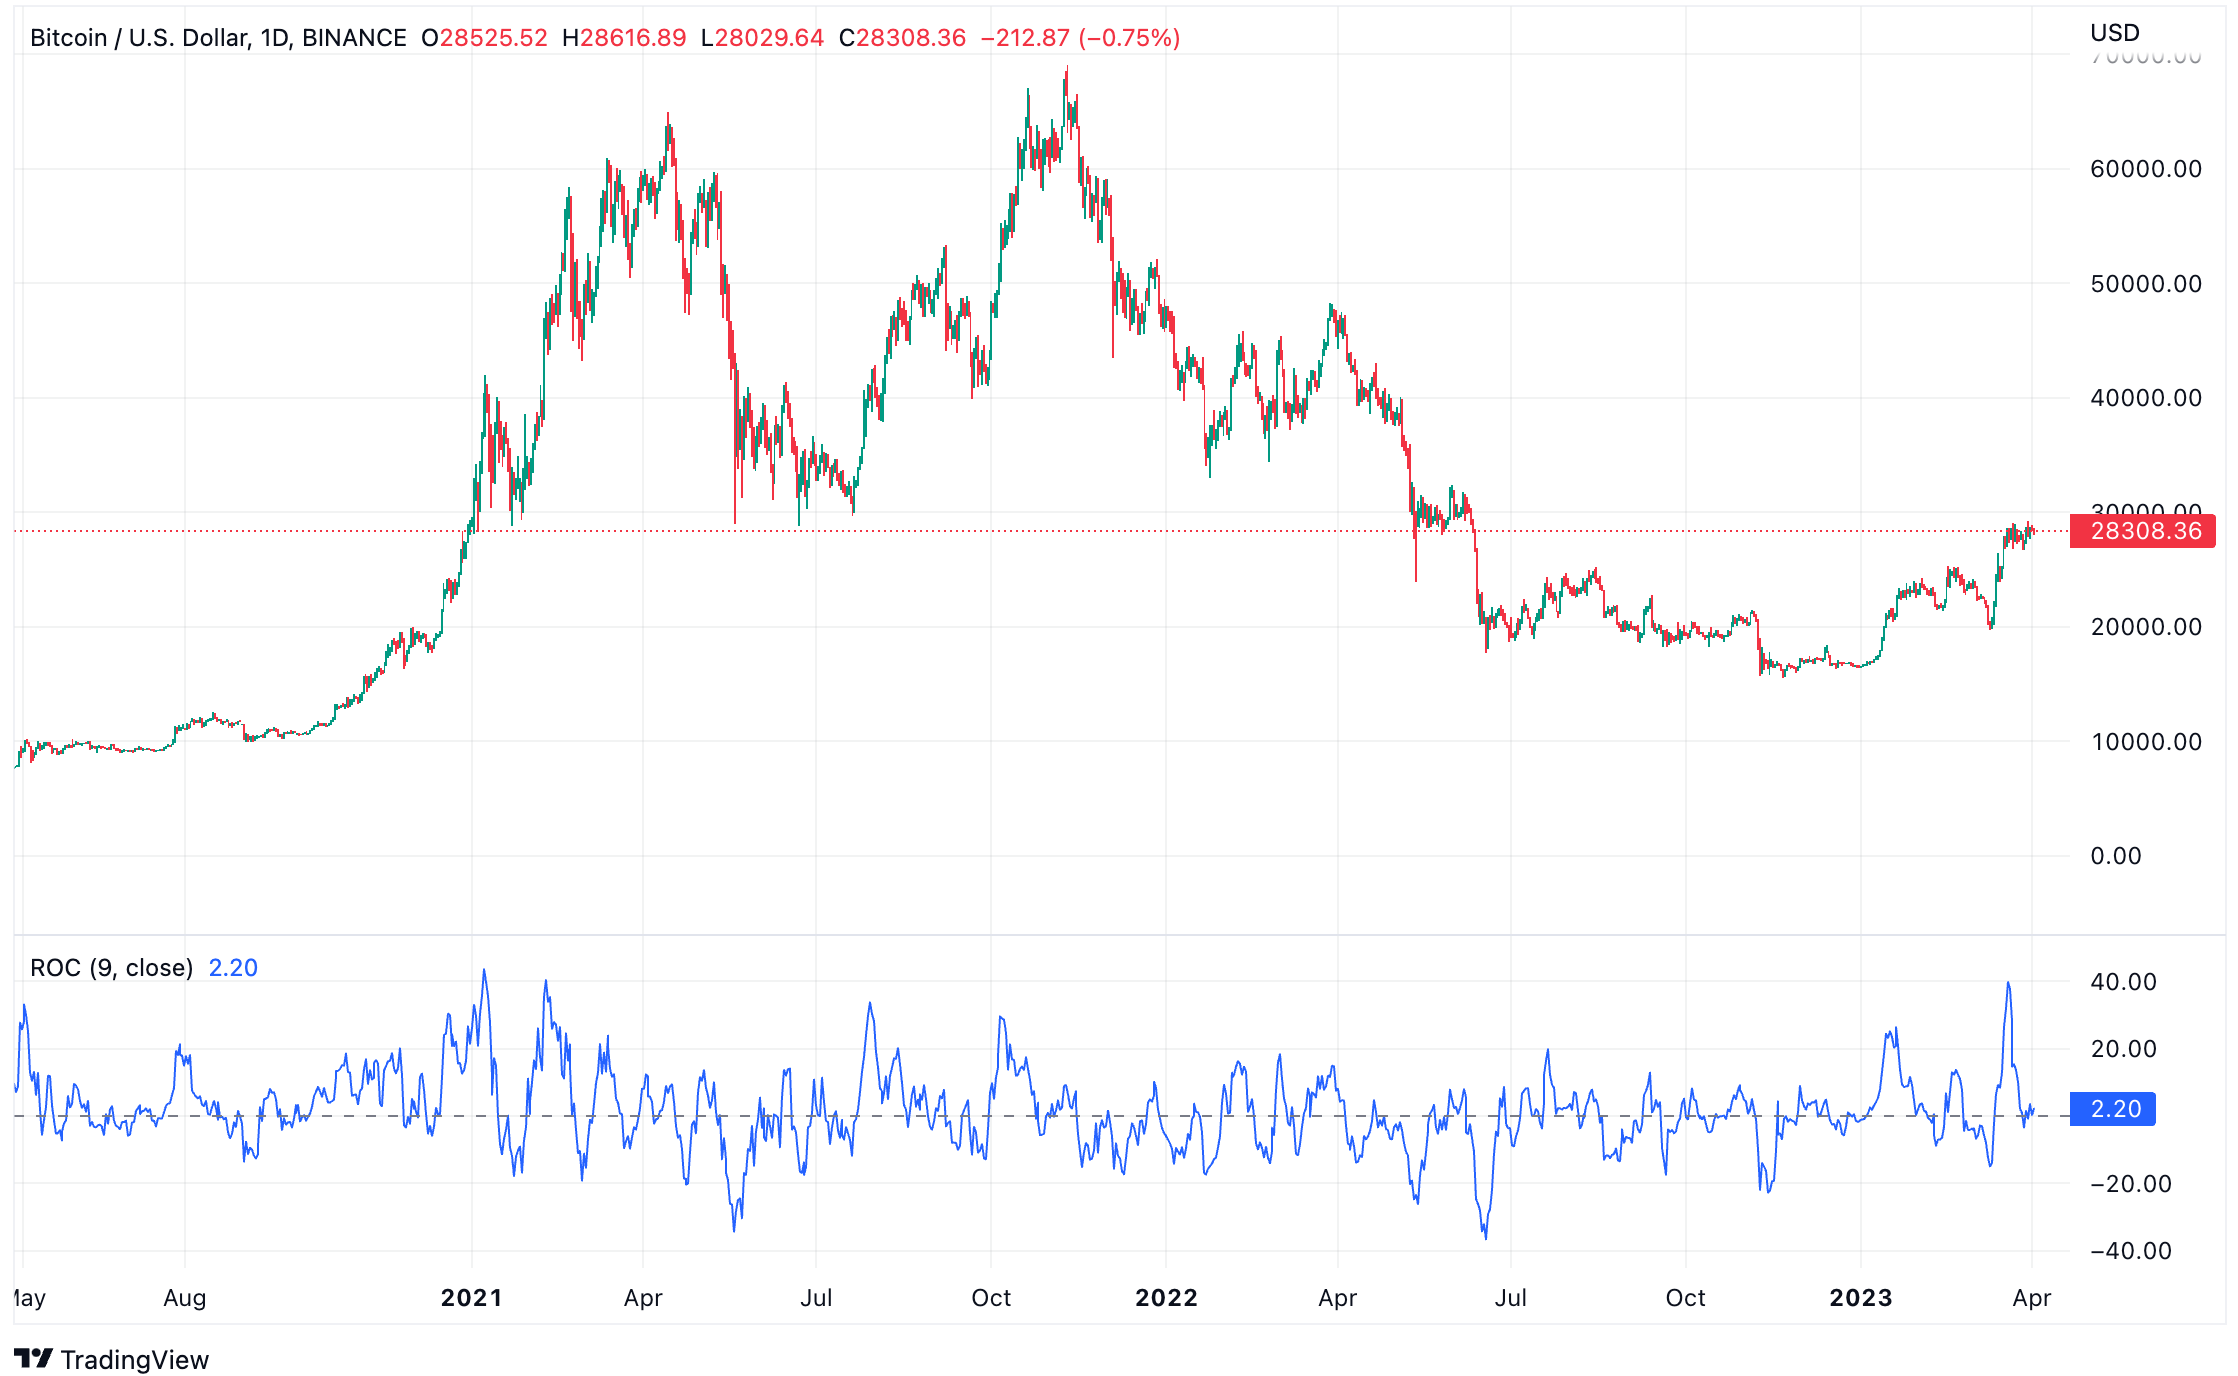
Example: When assessing Bitcoin’s price using ROC, if the indicator moves above a certain threshold (e.g., 10%), it could indicate overbought conditions, signaling that a price correction may be imminent. Conversely, if the ROC falls below a specific level (e.g., -10%), it might suggest oversold conditions, presenting a potential buying opportunity.
Commodity Channel Index (CCI) For Bitcoin Price Prediction
The Commodity Channel Index (CCI), developed by Donald Lambert, is an oscillator that measures the deviation of the price from its average price over a specified period.
CCI is typically used to identify overbought and oversold conditions, as well as potential trend reversals.
High CCI values indicate overbought conditions, while low values suggest oversold conditions.
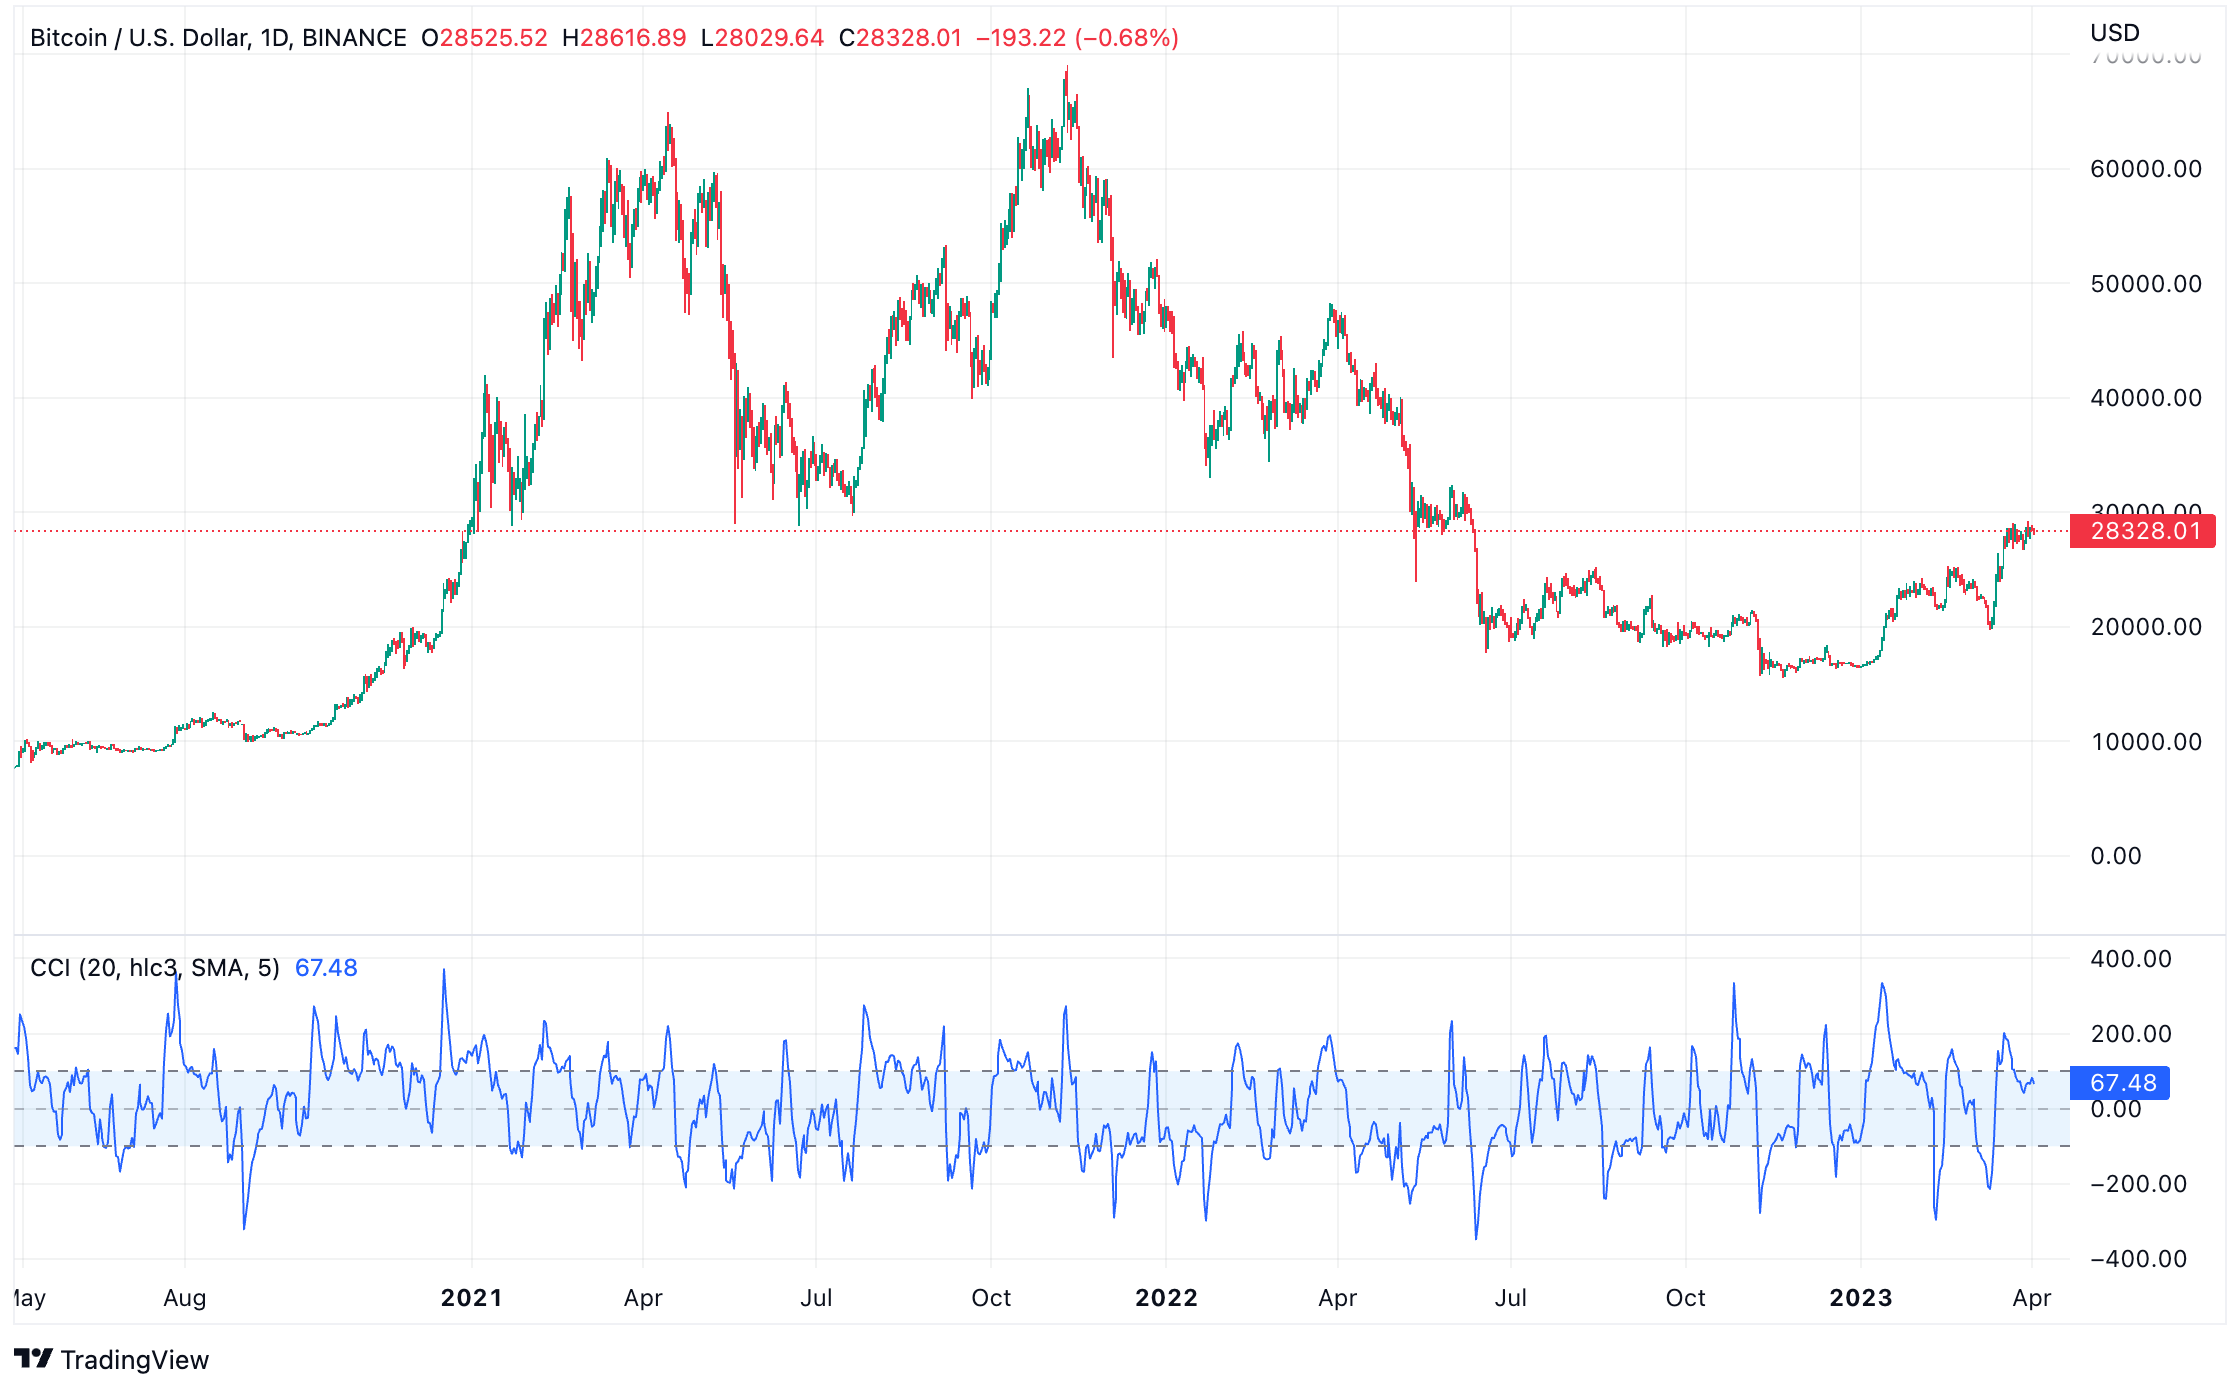
Example: When using CCI to predict Bitcoin’s price, if the indicator moves above the +100 level, it could signal overbought conditions, and you might consider taking profits or entering a short position. If the CCI drops below the -100 level, it might indicate oversold conditions, providing a potential buying opportunity.
Accumulation/Distribution Line (A/D Line) For Bitcoin Price Prediction
The Accumulation/Distribution Line (A/D Line) is a volume-based indicator that measures the flow of money into and out of an asset.
Developed by Marc Chaikin, the A/D Line aims to identify whether an asset is being accumulated (bought) or distributed (sold) by comparing its price and volume.
A rising A/D Line indicates buying pressure and suggests that the asset is being accumulated, while a falling A/D Line signals selling pressure and possible distribution.
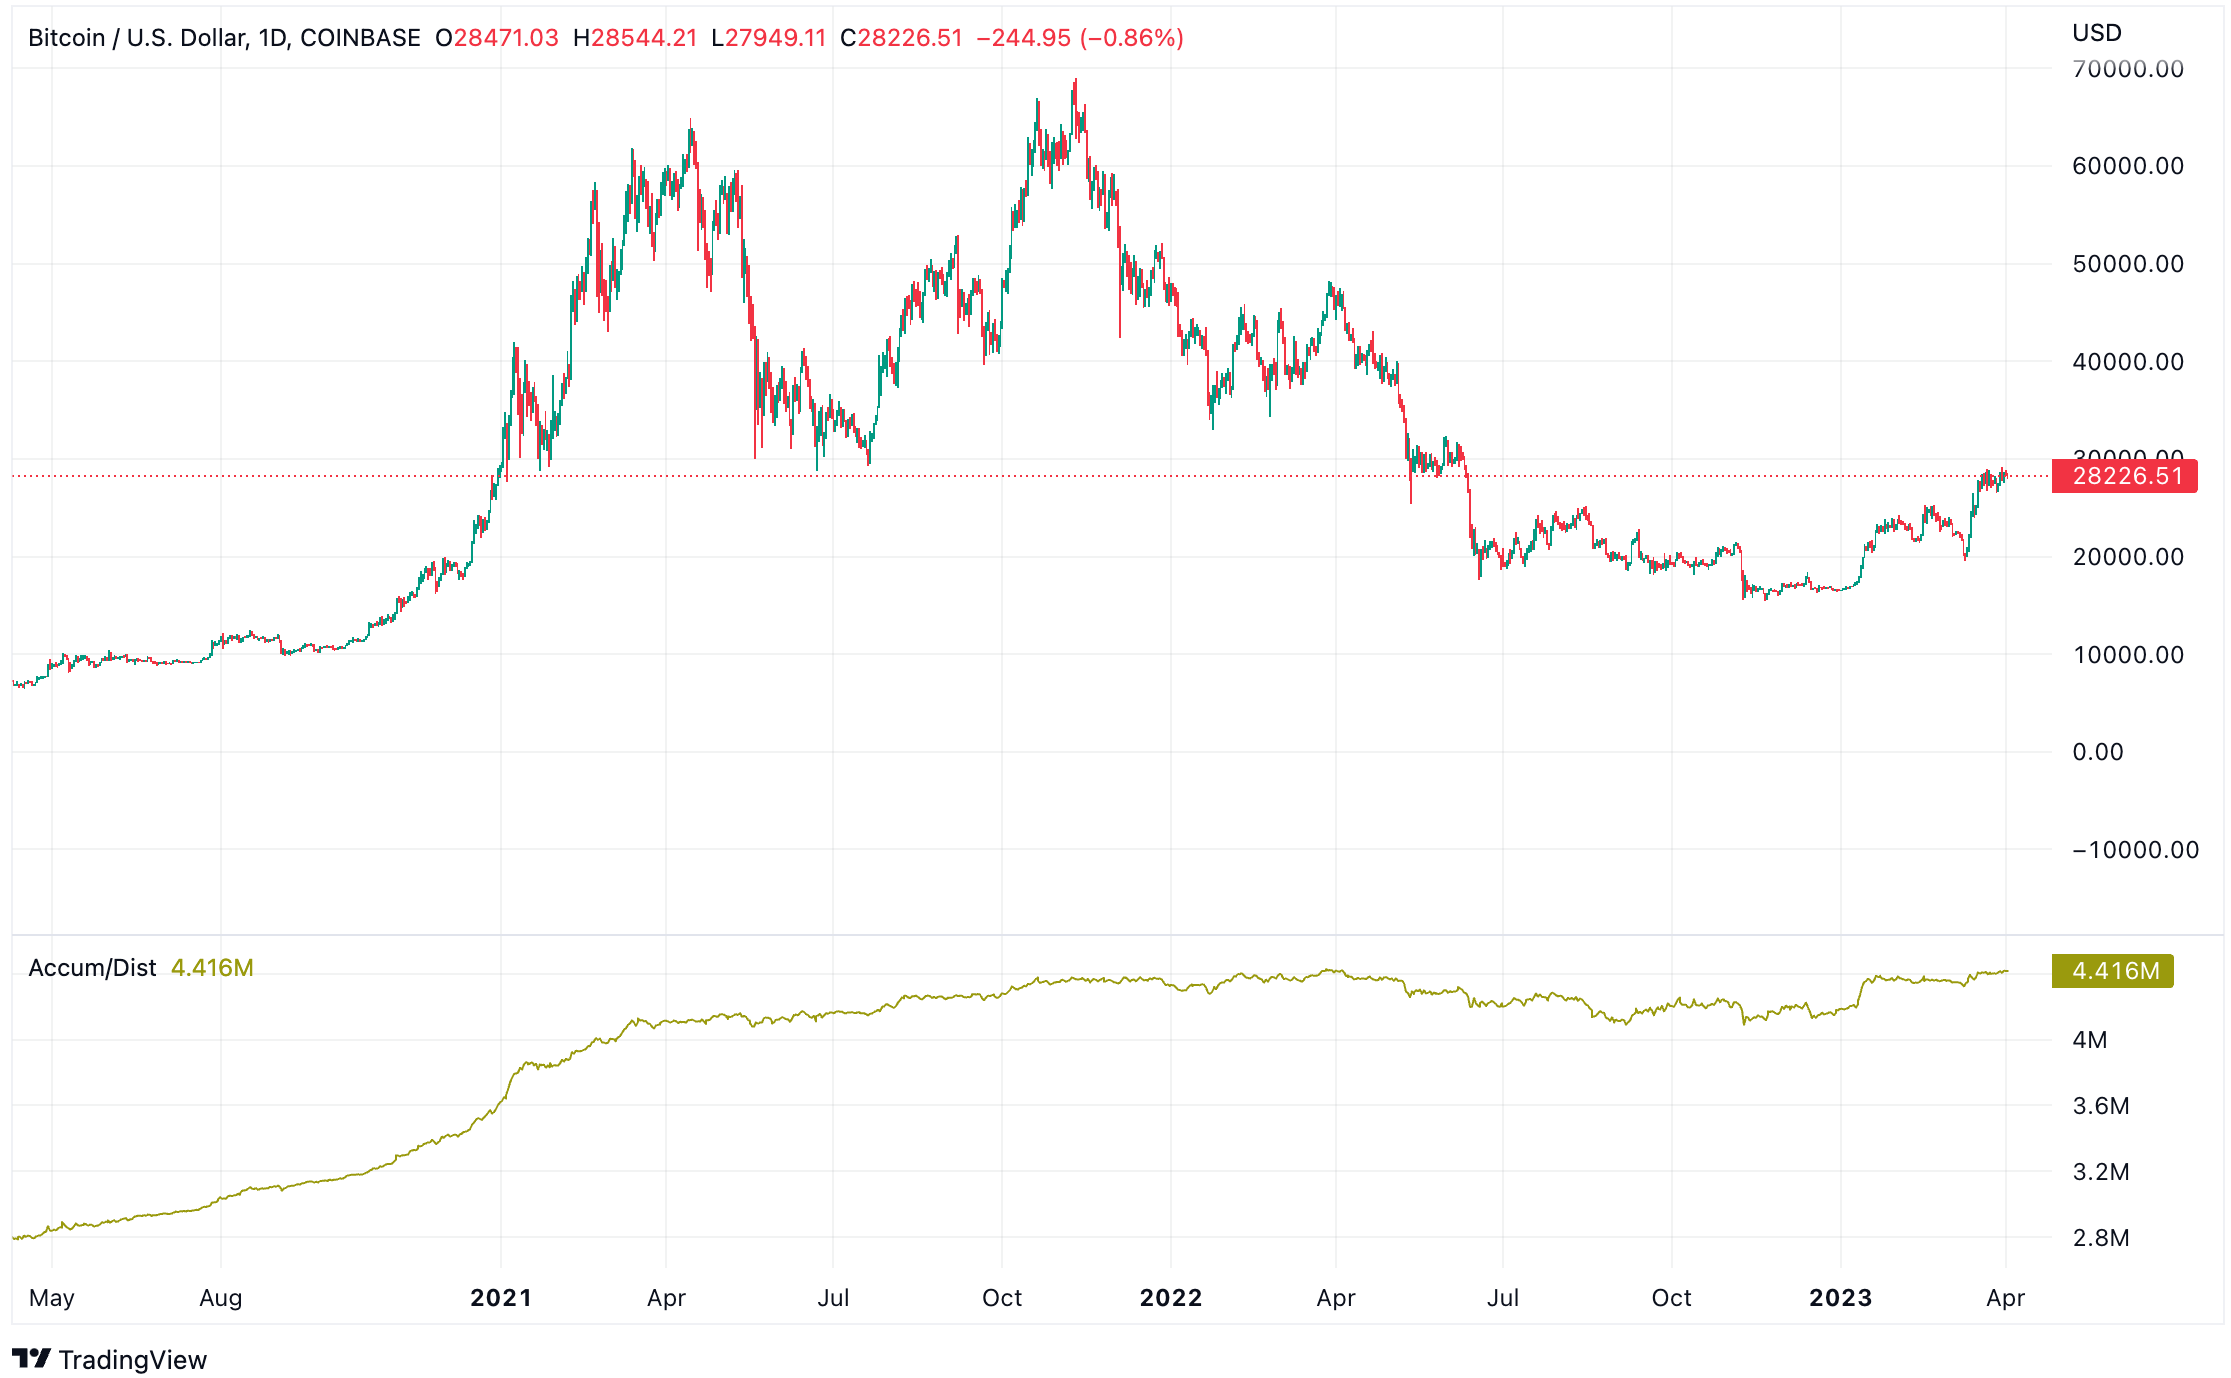
Example: When predicting Bitcoin’s price using the A/D Line, if you notice a divergence between the price and the A/D Line, it could signal a potential price reversal. For instance, if Bitcoin’s price is making higher highs while the A/D Line is making lower highs, this bearish divergence may hint at an upcoming price decrease, and you might consider taking profits or entering a short position.
Pivot Points For Bitcoin Price Prediction
Pivot Points are a popular technical analysis tool used by traders to identify potential support and resistance levels.
They are calculated based on the previous day’s high, low, and closing prices, and can help determine intraday trend direction and potential reversal points.
There are various types of pivot points, including classic, Woodie’s, Camarilla, and Fibonacci pivot points, each with its unique calculation method.
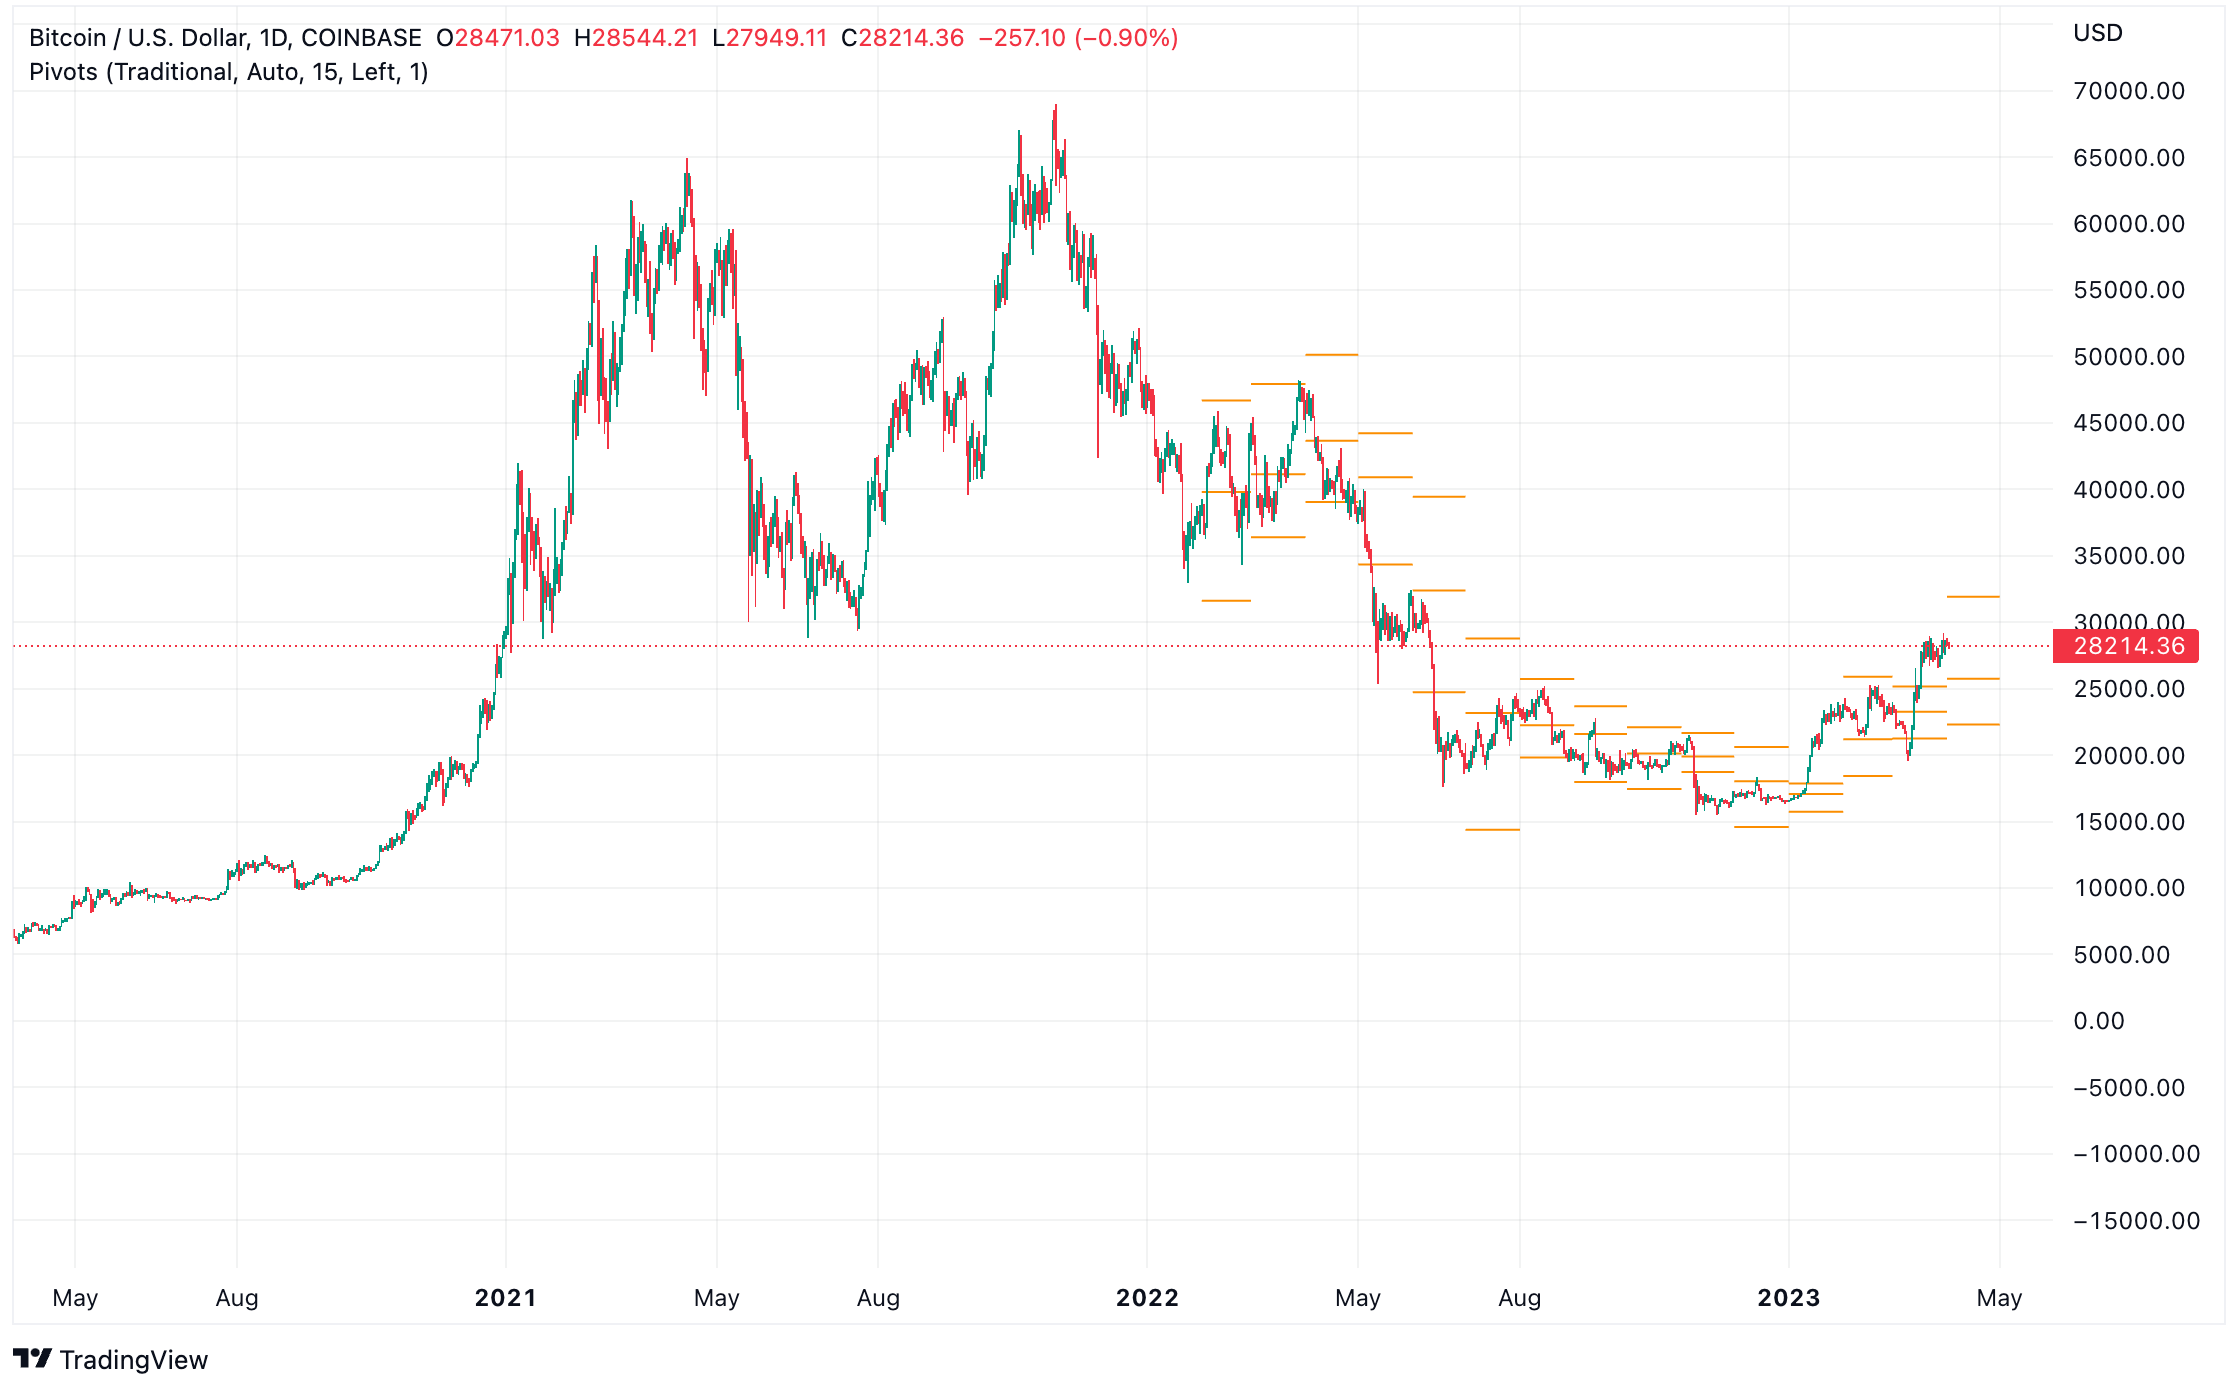
Example: When using pivot points for price prediction, you can identify potential entry and exit points based on the support and resistance levels.
For instance, if Bitcoin’s price is trading above the central pivot point, it could indicate a bullish trend, and you might consider buying if the price retraces to a support level.
Conversely, if the price is trades below the central pivot point, it could signal a bearish trend, and you might look for selling opportunities if the price approaches a resistance level.
Chaikin Money Flow (CMF) For Bitcoin Price Prediction
The Chaikin Money Flow (CMF), also developed by Marc Chaikin, is an oscillator that measures the buying and selling pressure in an asset by combining price and volume data.
CMF oscillates between -1 and 1, with positive values indicating buying pressure and negative values suggesting selling pressure.
The indicator can be used to confirm trends, identify divergences, and detect potential trend reversals.
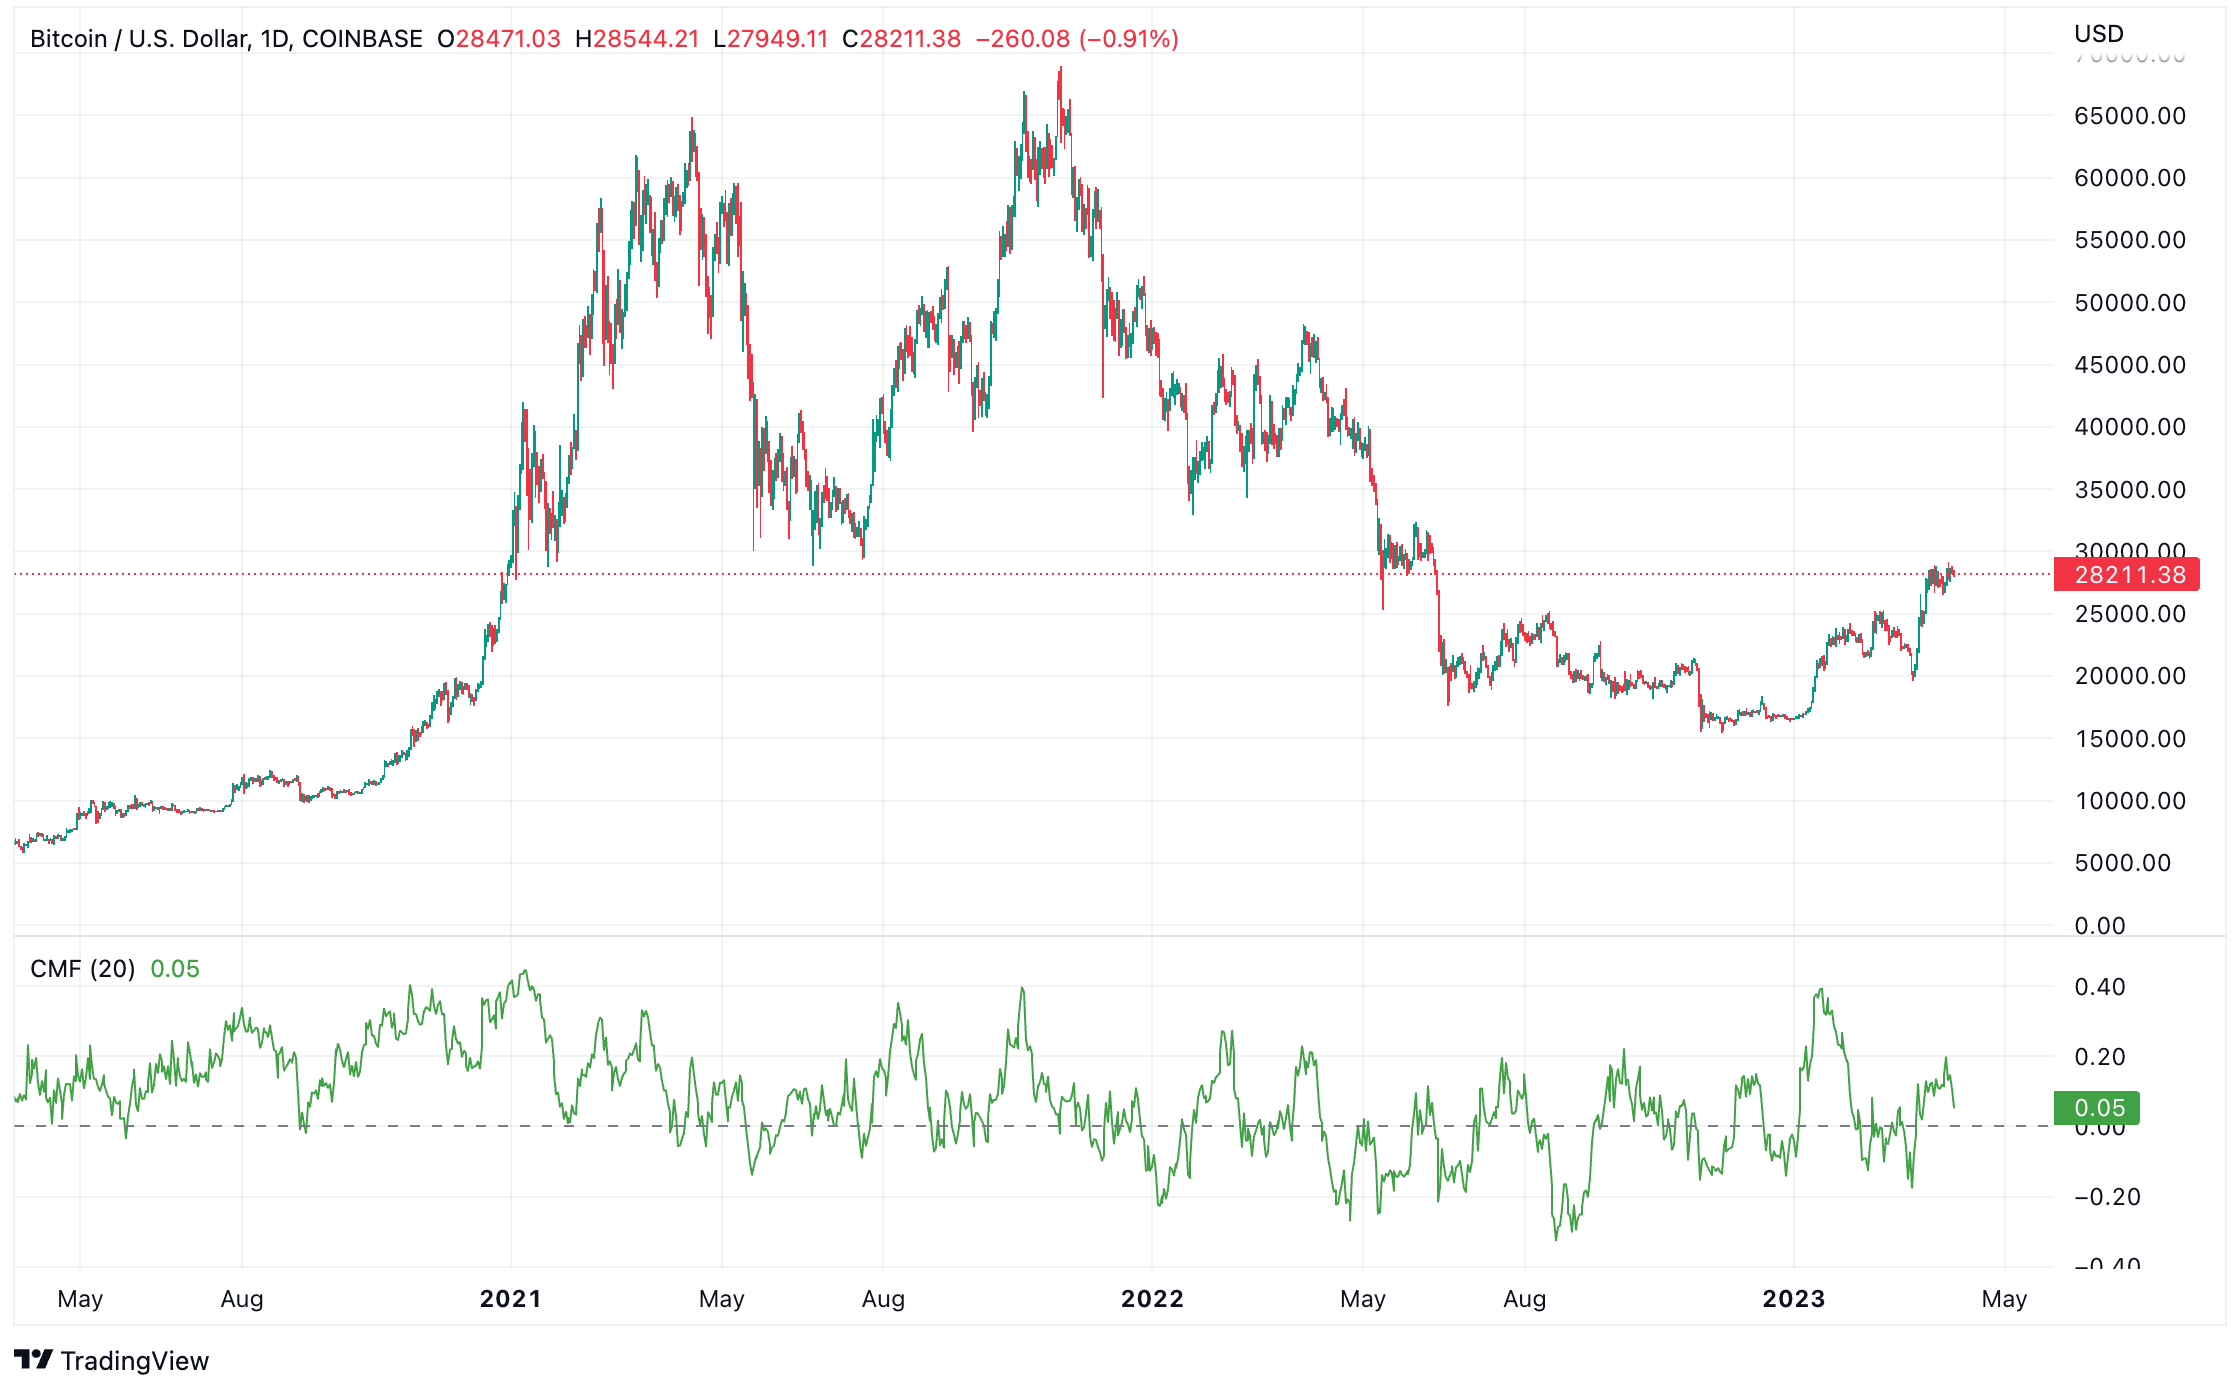
Example: When predicting Bitcoin’s price using CMF, if the indicator is above 0 and rising, it could suggest increased buying pressure and a potential price increase. If the CMF is below 0 and falling, it might indicate increased selling pressure and a potential price drop. Additionally, if you spot a divergence between Bitcoin’s price and the CMF, it could signal a potential price reversal.
Aroon Indicator For Bitcoin Price Prediction
The Aroon Indicator, developed by Tushar Chande, is a trend-following oscillator designed to determine the strength of a trend and potential trend reversals.
The indicator consists of two lines, the Aroon Up and Aroon Down, which measure the number of periods since the highest high and the lowest low, respectively, within a specified time frame.
The Aroon Indicator can help identify emerging trends, consolidation periods, and potential reversals.
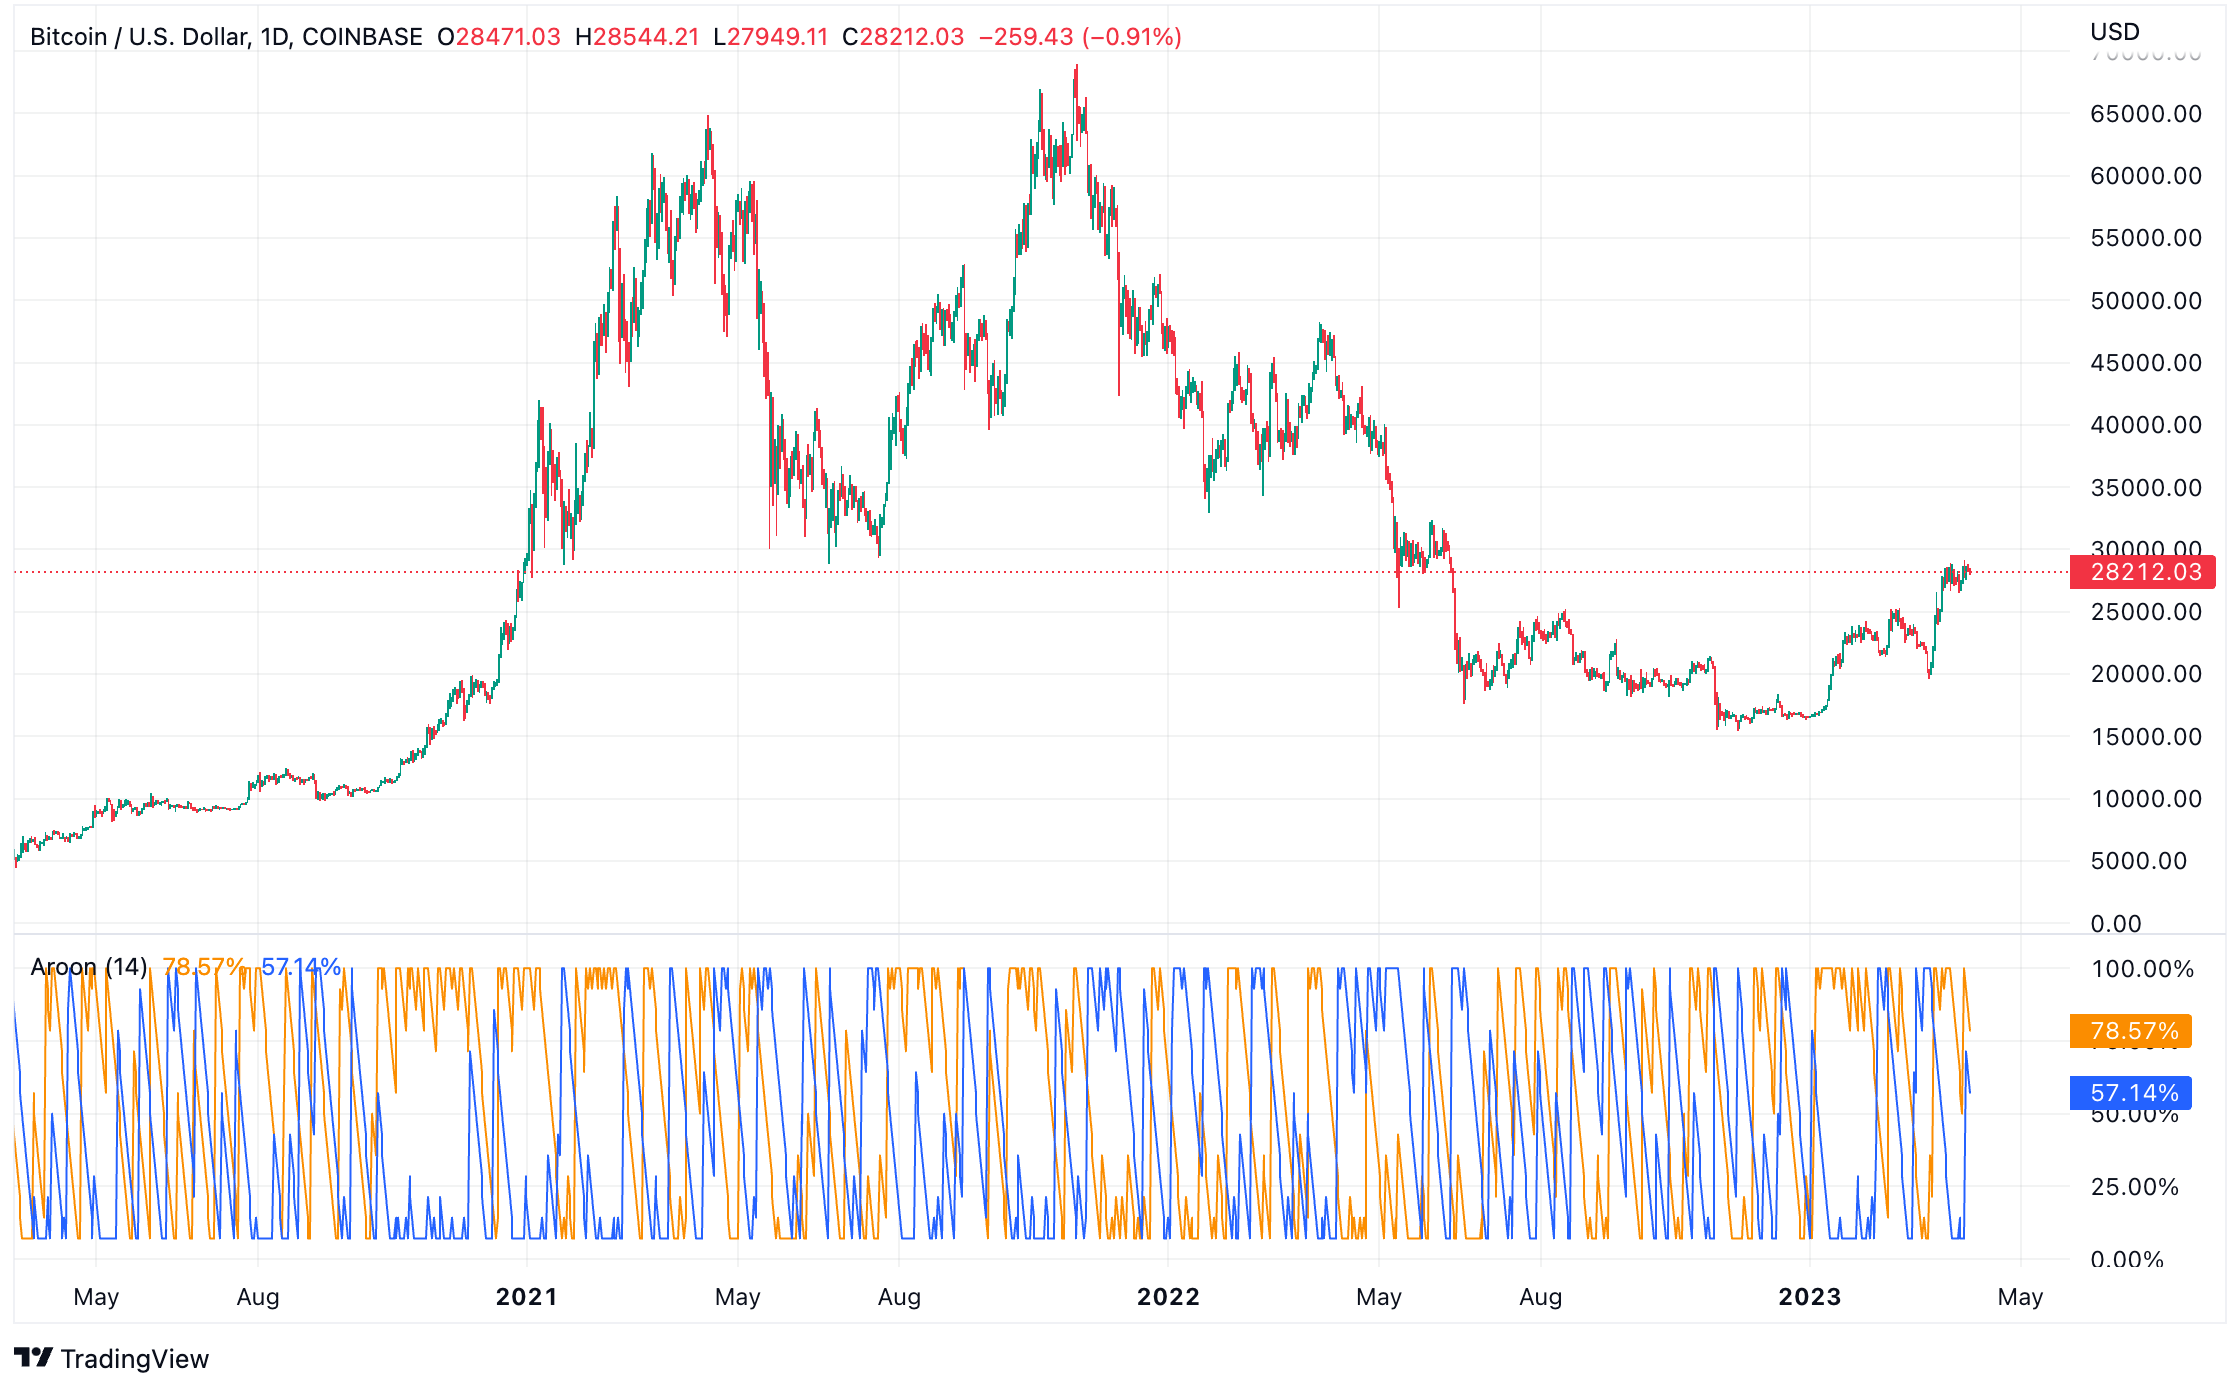
Example: When predicting Bitcoin’s price using the Aroon Indicator, if the Aroon Up line crosses above the Aroon Down line, it could signal the start of a bullish trend, and you might consider buying BTC. Conversely, if the Aroon Down line crosses above the Aroon Up line, it could suggest the beginning of a bearish trend, and you might look for selling opportunities.
Gann Fan For Bitcoin Price Prediction
The Gann Fan, created by legendary trader W.D. Gann, is a technical analysis tool that uses geometric angles to predict potential support and resistance levels, as well as trend direction and strength.
The Gann Fan consists of multiple lines (usually nine) drawn from a single starting point, each representing a specific angle.
The most critical angle is the 1:1 line, which signifies a 45-degree angle and represents an ideal balance between price and time.
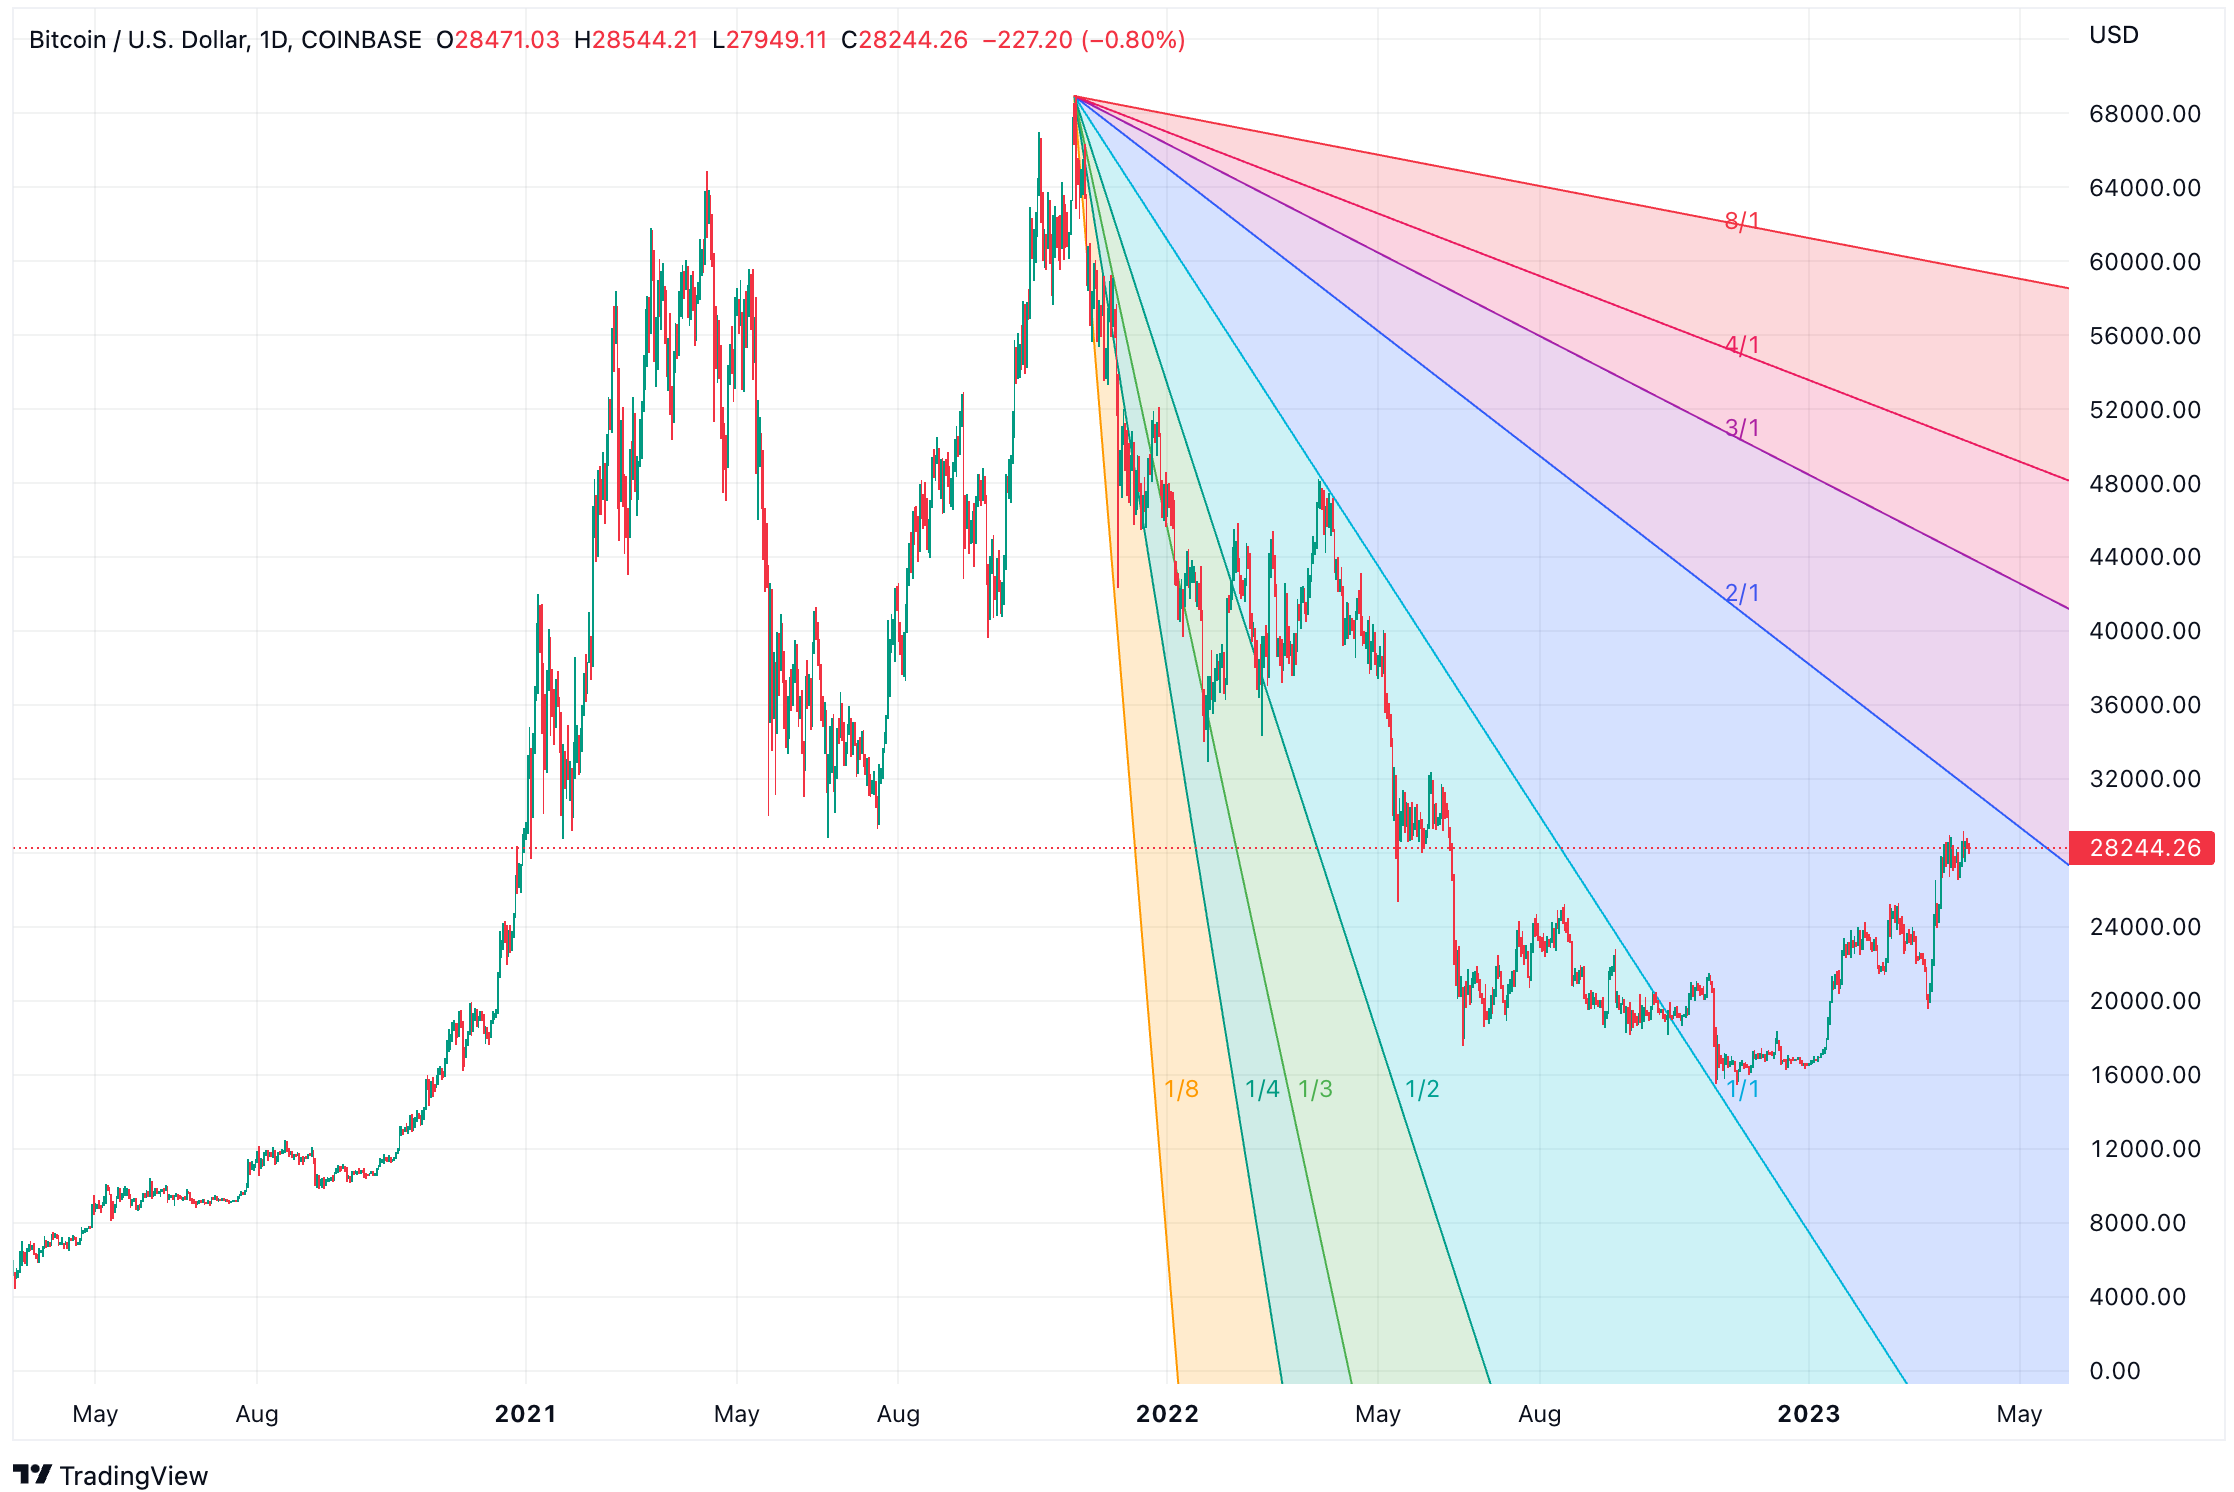
Example: When using the Gann Fan for Bitcoin price prediction, you can observe how the price interacts with the various angle lines. If Bitcoin’s price breaks above a specific angle line, it could indicate a bullish trend, and you might consider buying. If the price breaks below an angle line, it could signal a bearish trend, and you might look for selling opportunities. Additionally, the angle lines can act as support and resistance levels, helping you identify potential entry and exit points.
Keltner Channel For Bitcoin Price Prediction
The Keltner Channel, developed by Chester Keltner, is a volatility-based indicator that measures price movements relative to an exponential moving average (EMA) and the Average True Range (ATR).
The Keltner Channel consists of three lines: the centerline, which is the EMA, and the upper and lower bands, which are calculated by adding and subtracting a multiple of the ATR from the centerline.
The Keltner Channel can help identify overbought and oversold conditions, as well as potential trend reversals.
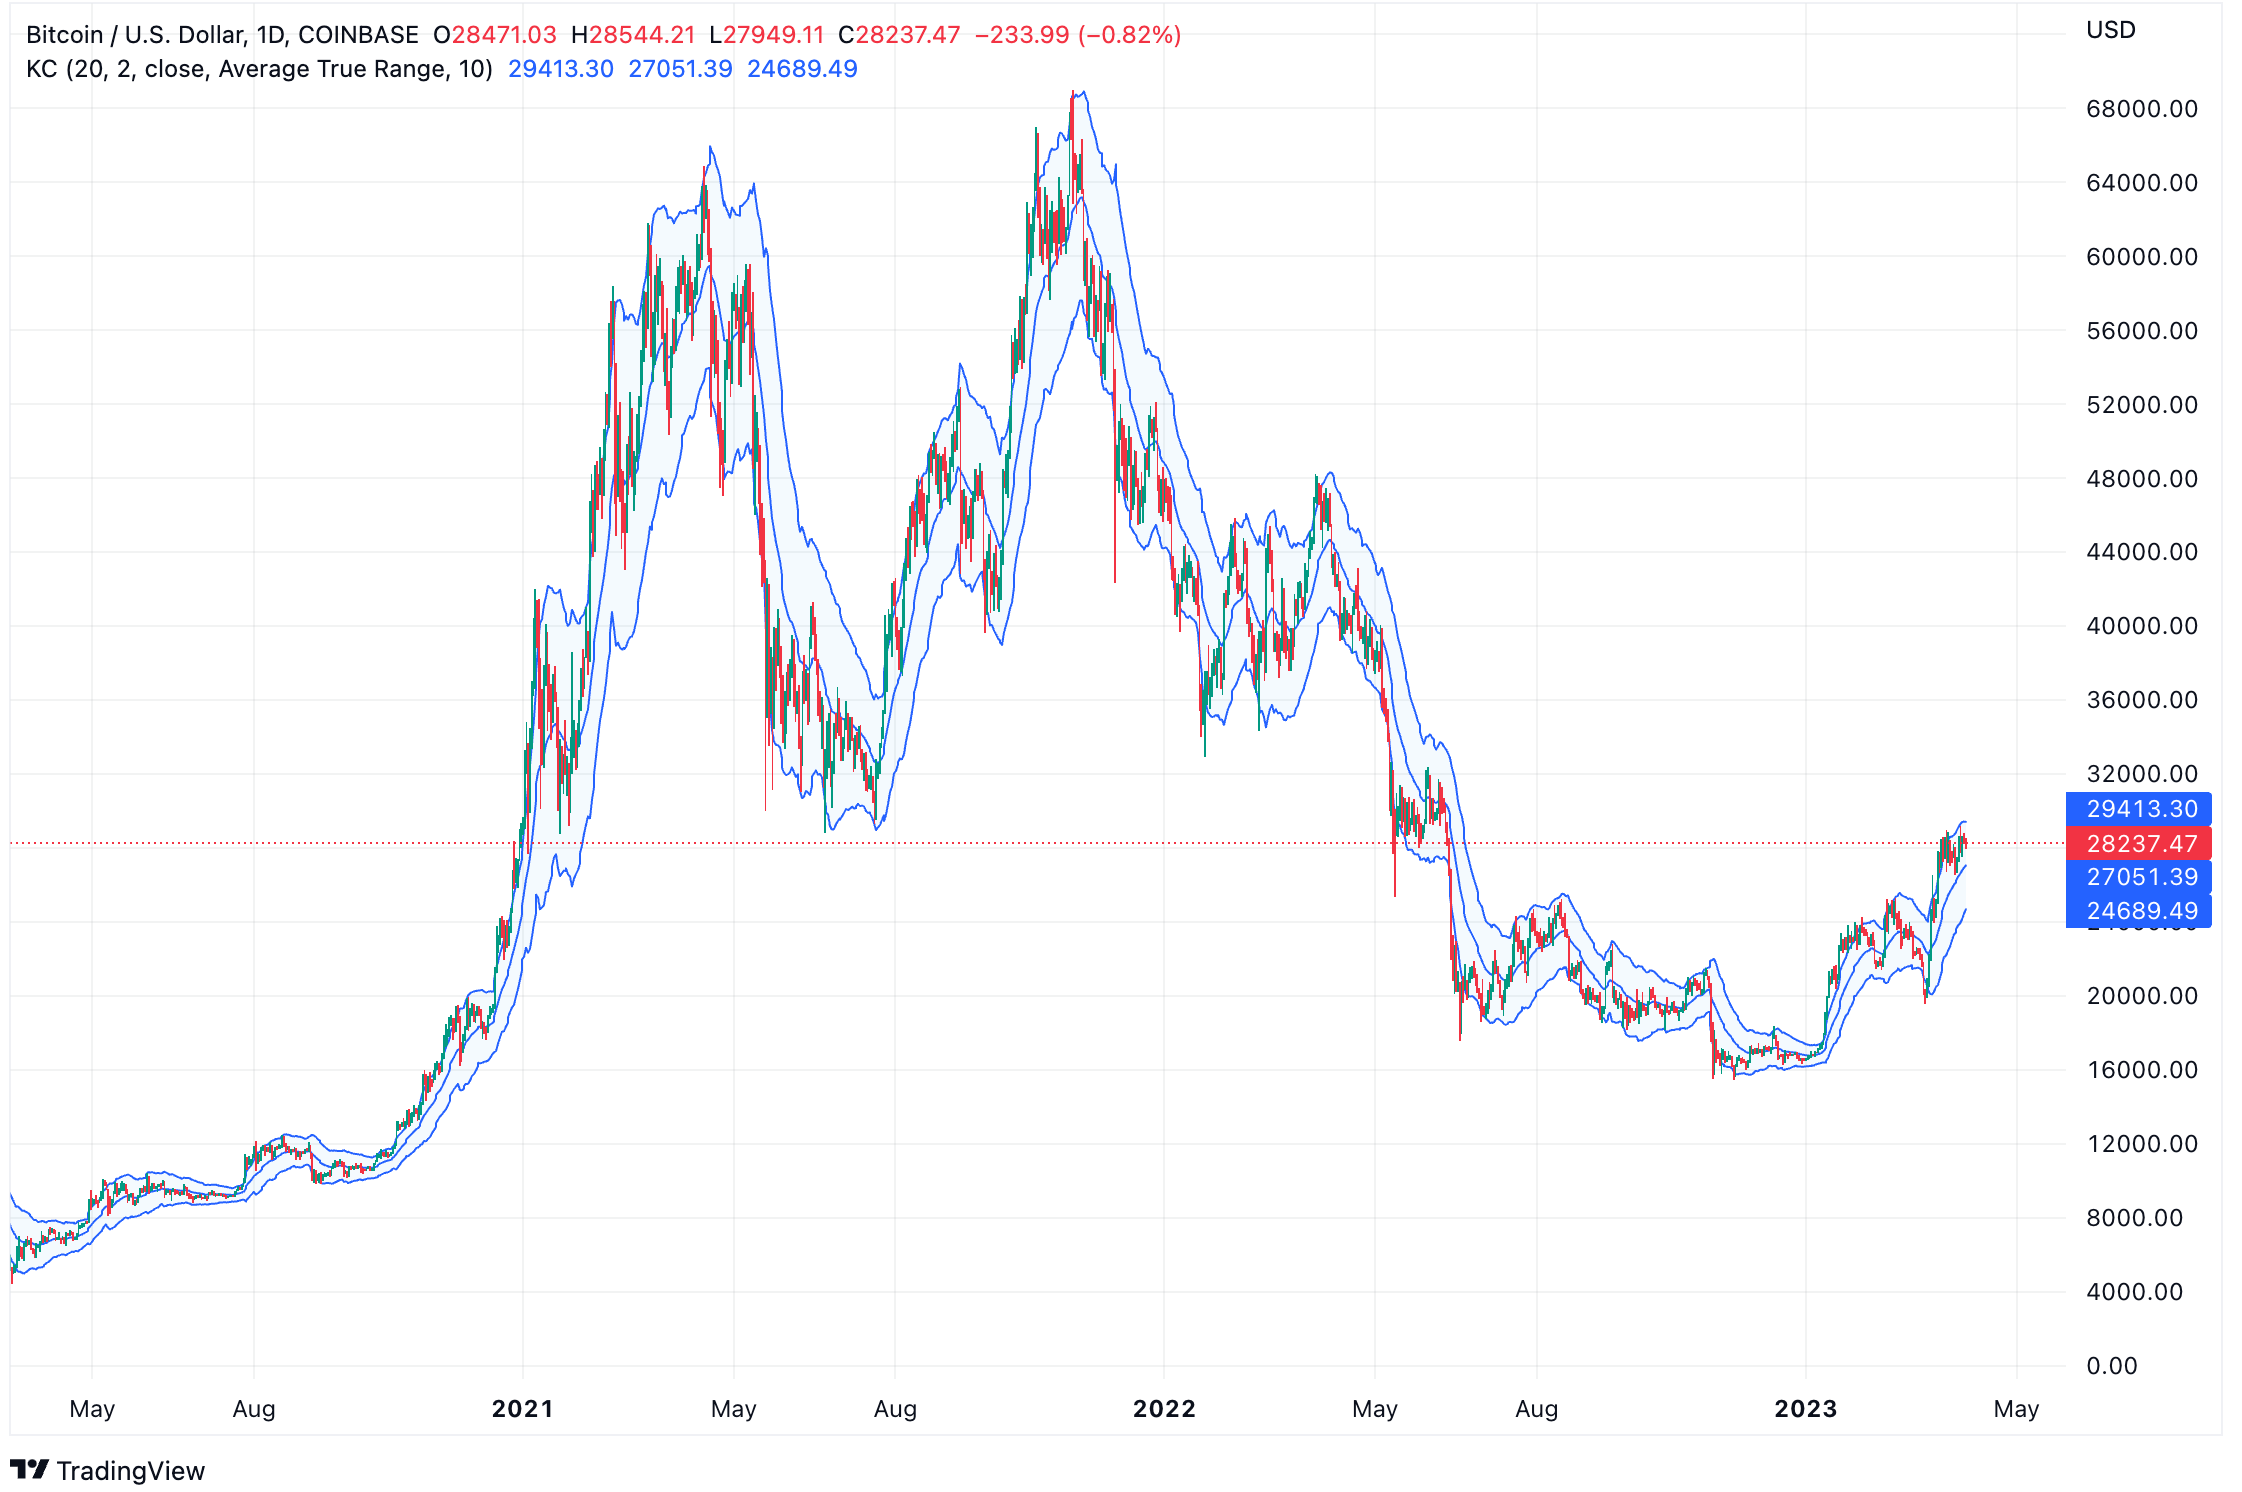
Example: When predicting Bitcoin’s price using the Keltner Channel, if the price is trading near the upper band, it could signal an overbought condition, and you might consider taking profits or entering a short position. If the price is trading near the lower band, it could indicate an oversold condition, and you might look for buying opportunities. Additionally, if the price breaks out of the channel, it could signal a potential trend reversal, providing further trade opportunities.
Money Flow Index (MFI) For Bitcoin Price Prediction
The Money Flow Index (MFI) is a momentum-based oscillator that measures the flow of money into and out of an asset, such as BTC, over a specified period.
By combining price and volume data, the MFI can help identify overbought and oversold market conditions, as well as potential trend reversals.
The MFI ranges from 0 to 100, with values above 80 generally indicating overbought conditions and values below 20 suggesting oversold conditions.
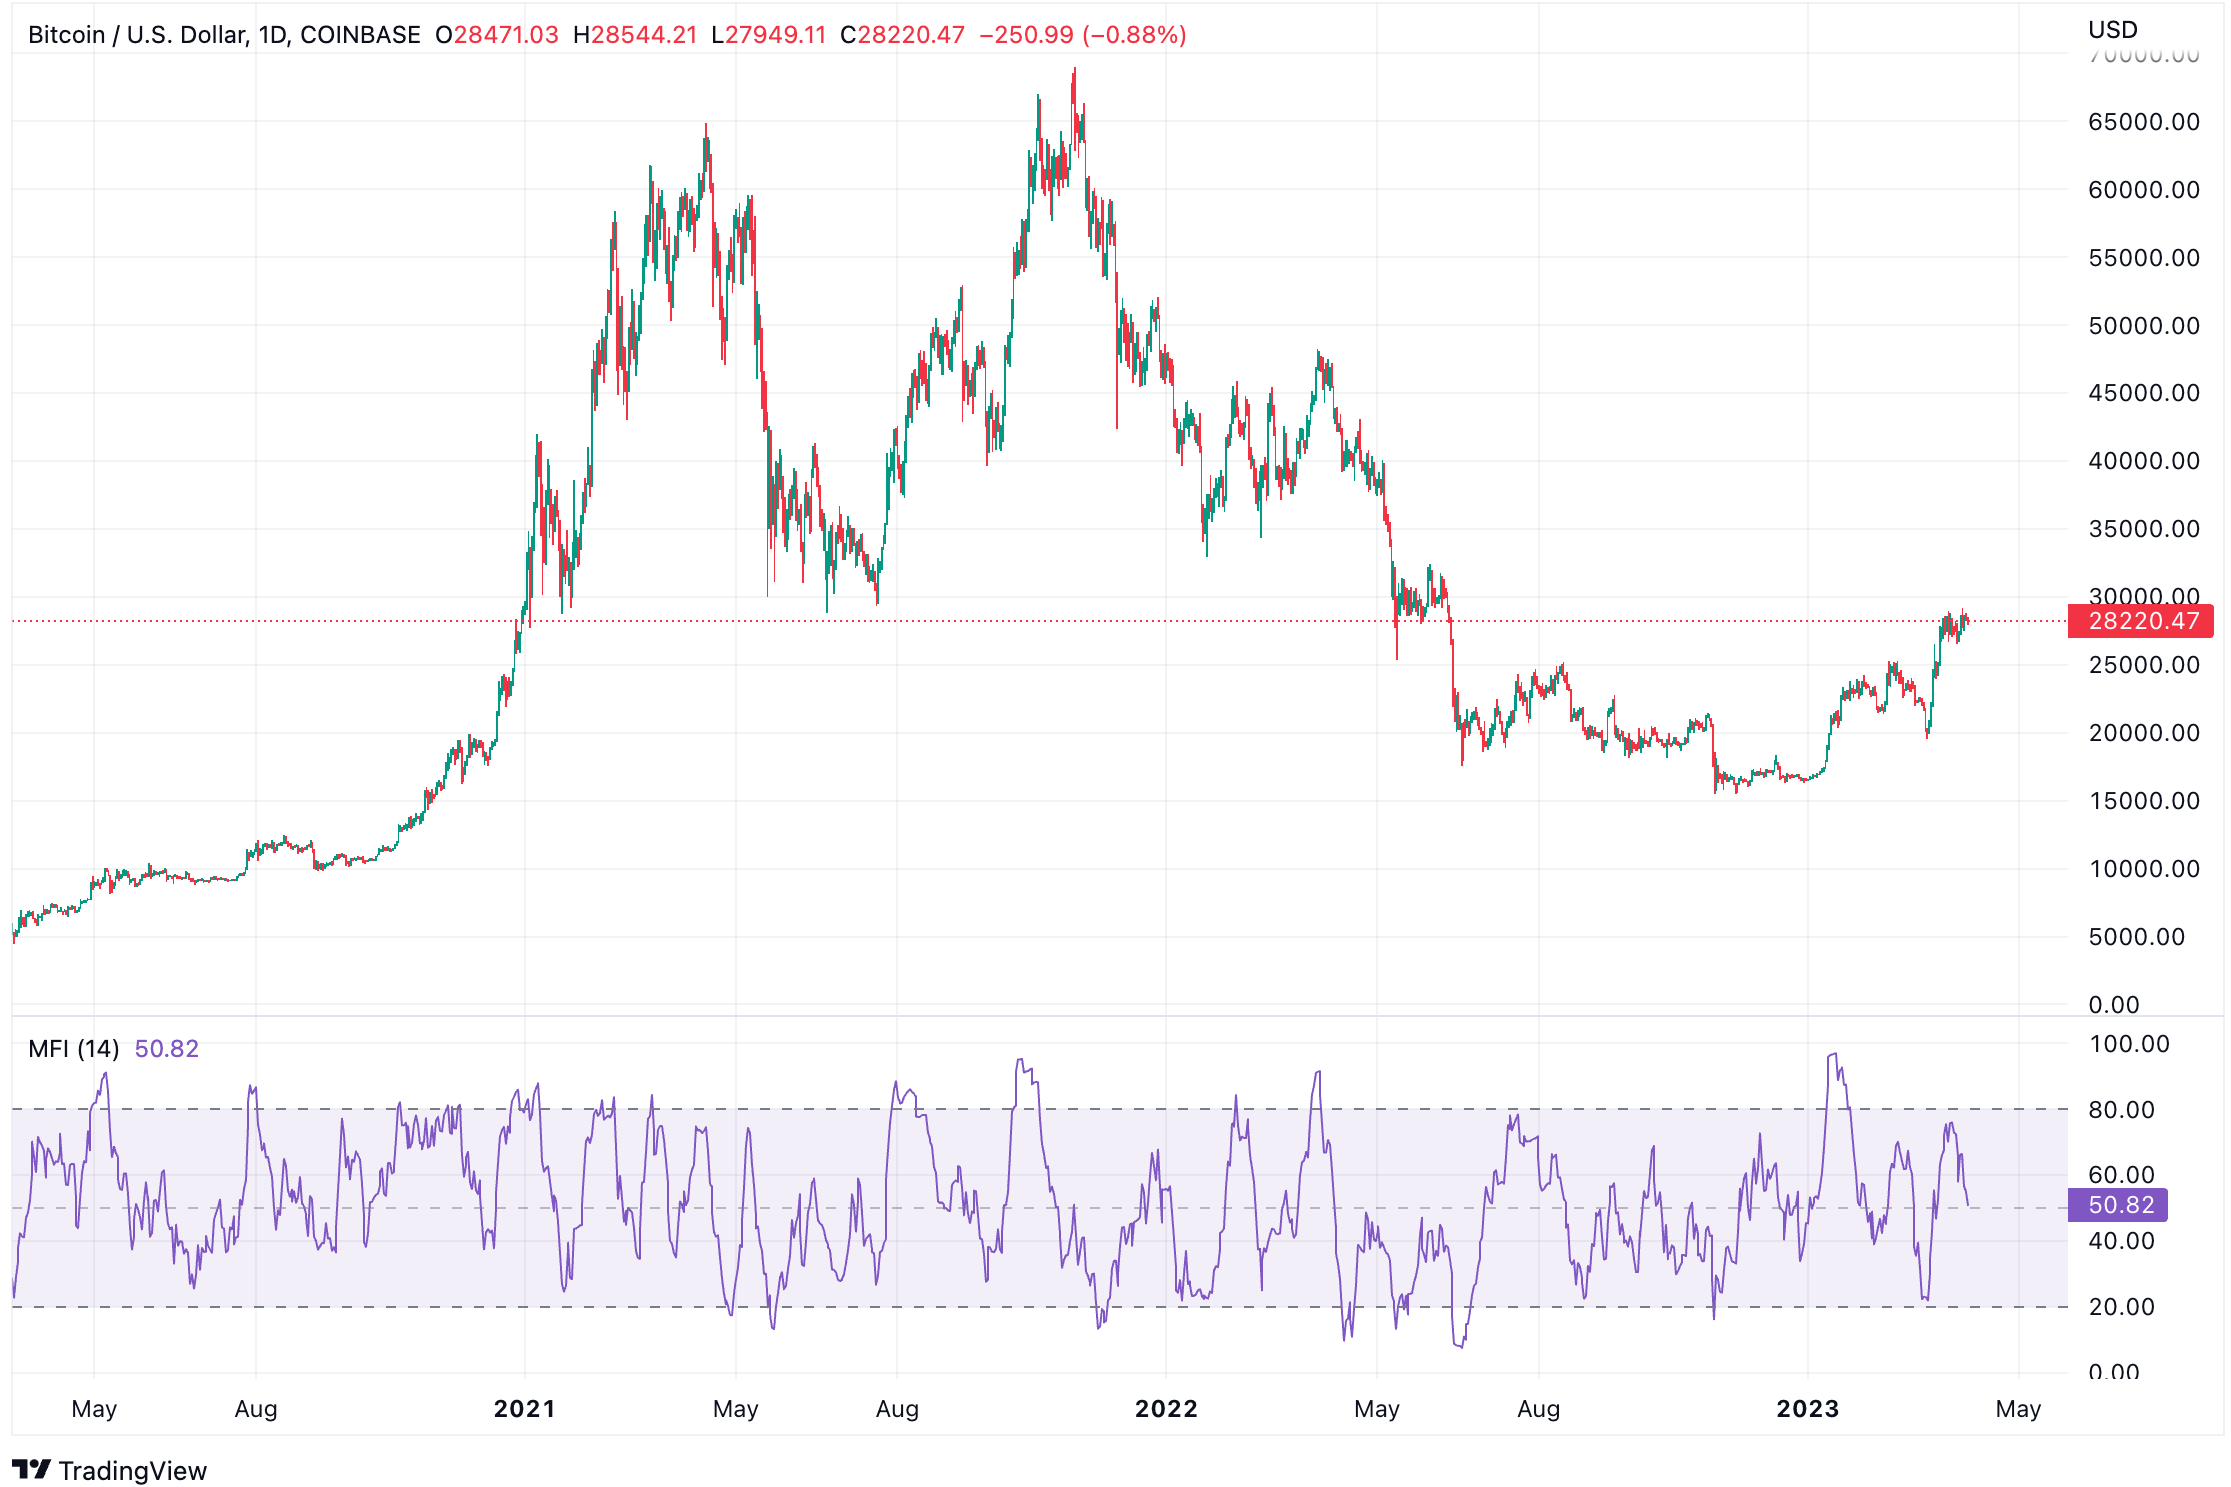
Example: When predicting Bitcoin’s price using the MFI, you could look for potential buying opportunities when the indicator falls below 20, signaling an oversold market. Conversely, when the MFI rises above 80, it could suggest overbought conditions, and you might consider taking profits or shorting BTC. Additionally, divergences between the MFI and price can help identify potential trend reversals.
TRIX For Bitcoin Price Prediction
The TRIX is a momentum-based oscillator that measures the rate of change of a triple exponentially smoothed moving average (TEMA) of an asset’s price, such as BTC.
By smoothing price fluctuations, the TRIX can help filter out market noise and identify potential trend reversals.
The TRIX oscillates around a zero line, with positive values indicating upward momentum and negative values signaling downward momentum.
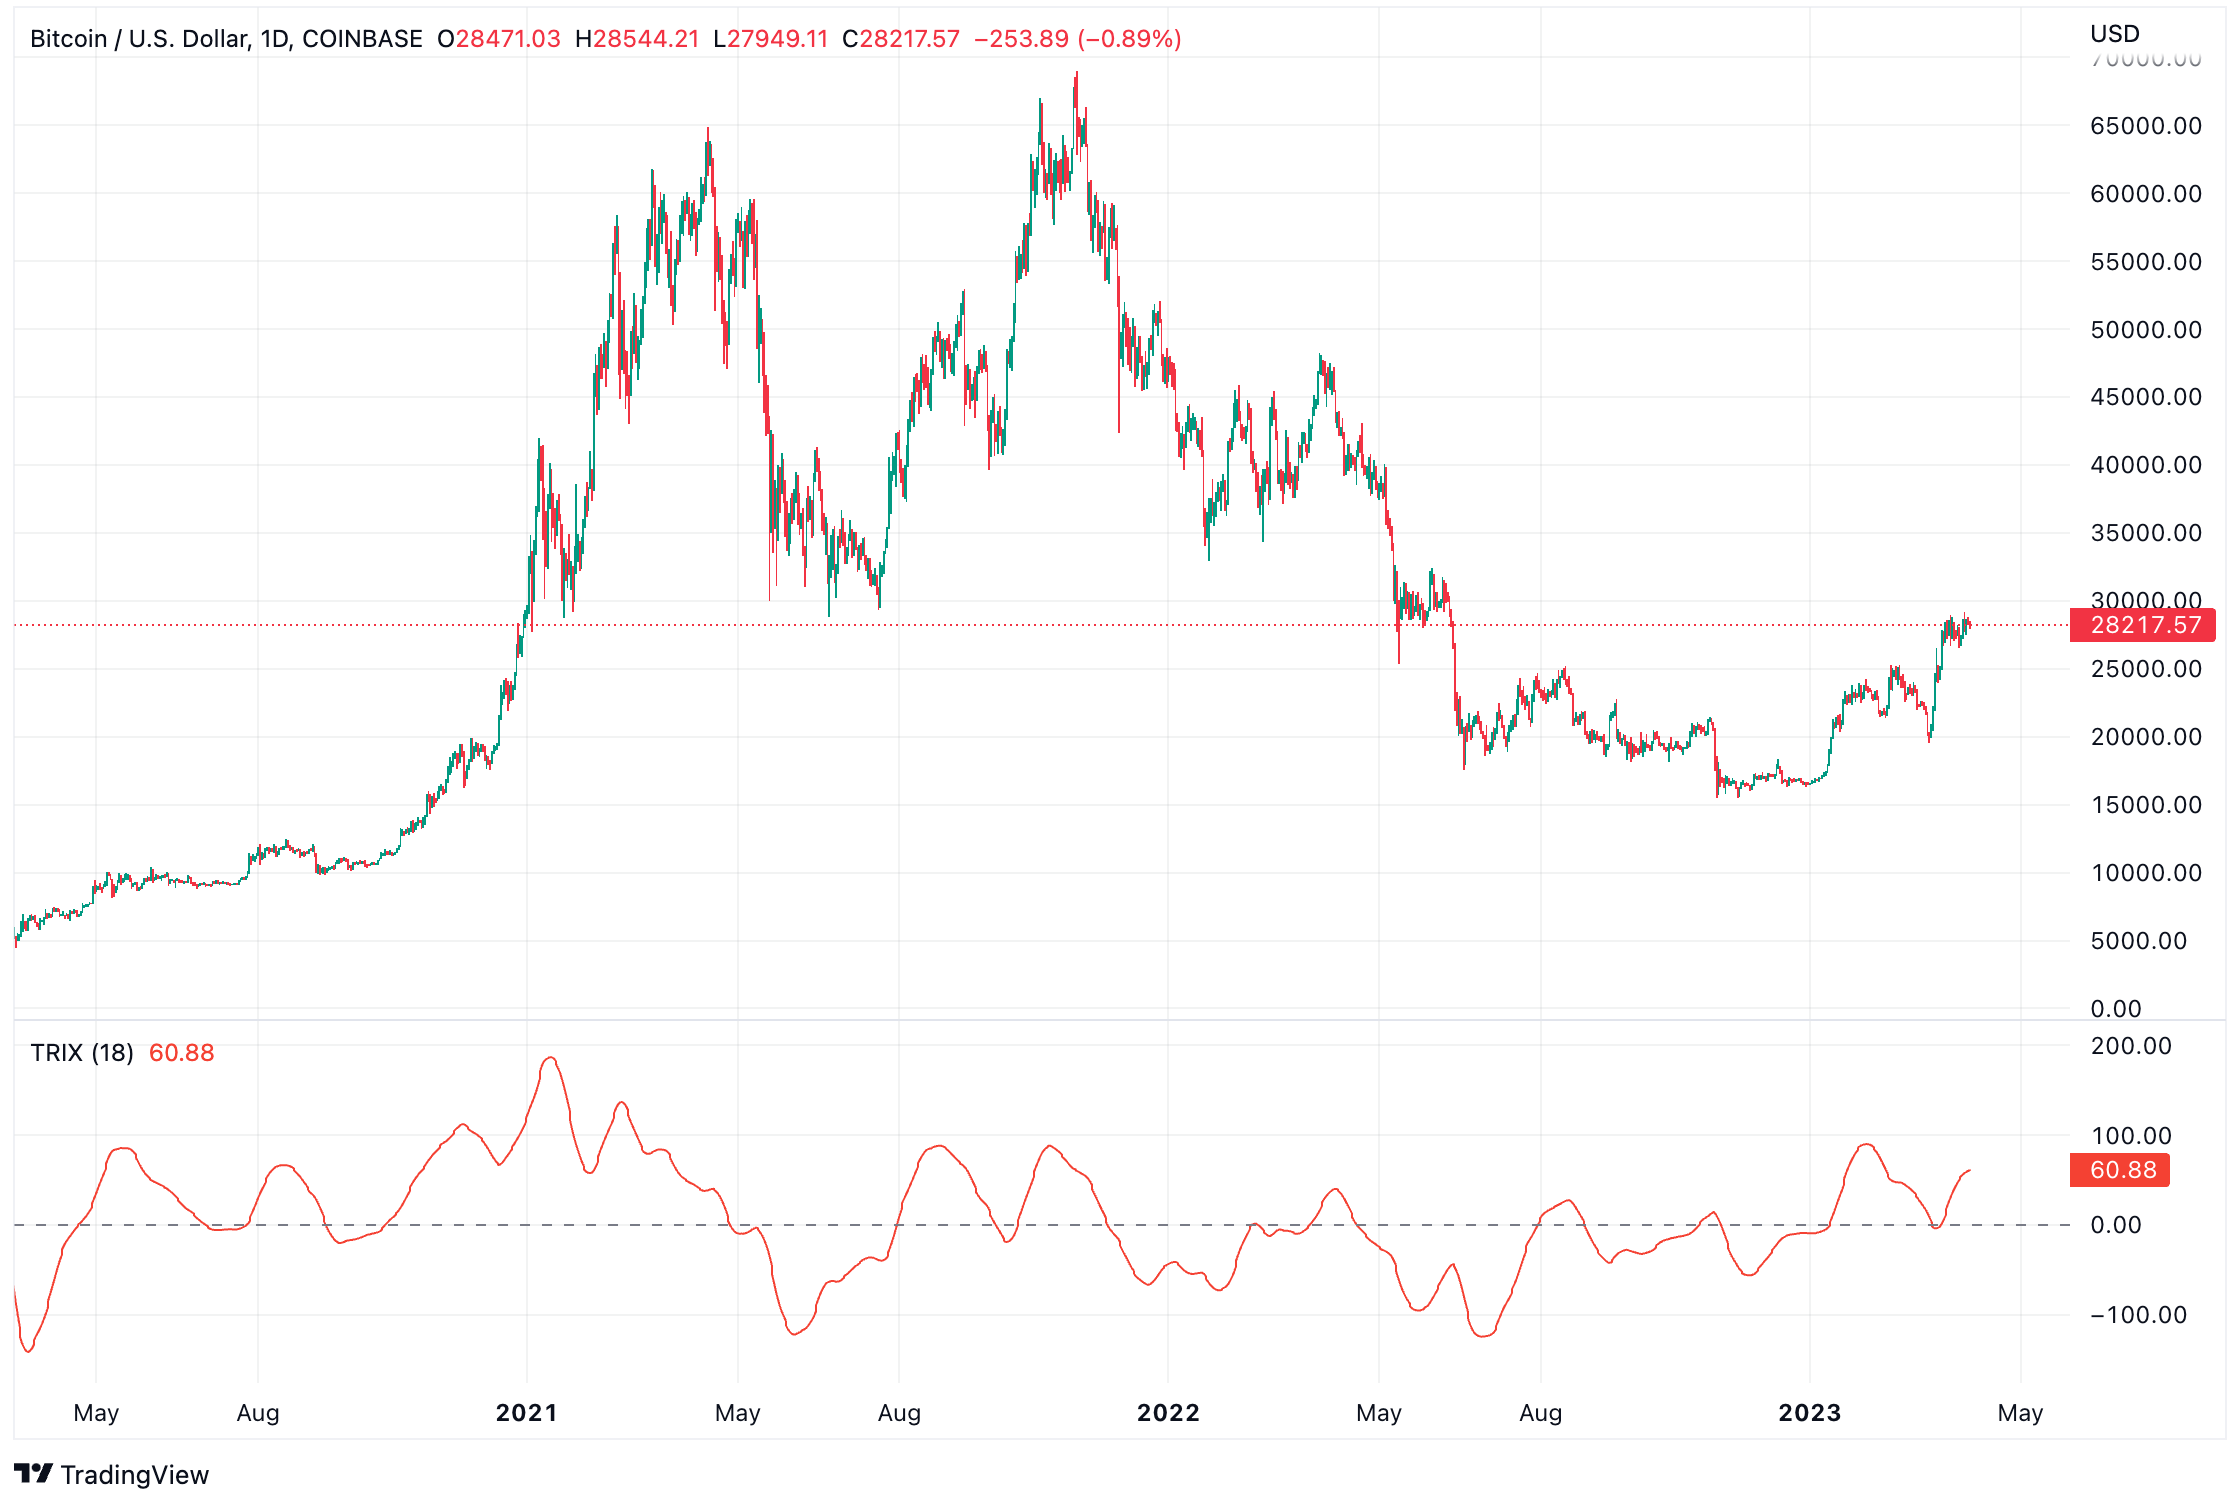
Example: When using the TRIX for For Bitcoin price prediction, you could look for potential buying opportunities when the TRIX crosses above the zero line, signaling a bullish trend. Conversely, when the TRIX crosses below the zero line, it could suggest a bearish trend, and you might consider selling or shorting BTC. Additionally, divergences between the TRIX and price can help confirm trend reversals.
The Zig Zag Indicator For Bitcoin Price Prediction
The Zig Zag Indicator is a chart overlay that helps identify significant price movements by connecting swing highs and swing lows with straight lines.
The Zig Zag Indicator does not predict price movements but rather highlights historical price trends, making it a valuable tool for visualizing market structure and identifying potential support and resistance levels.
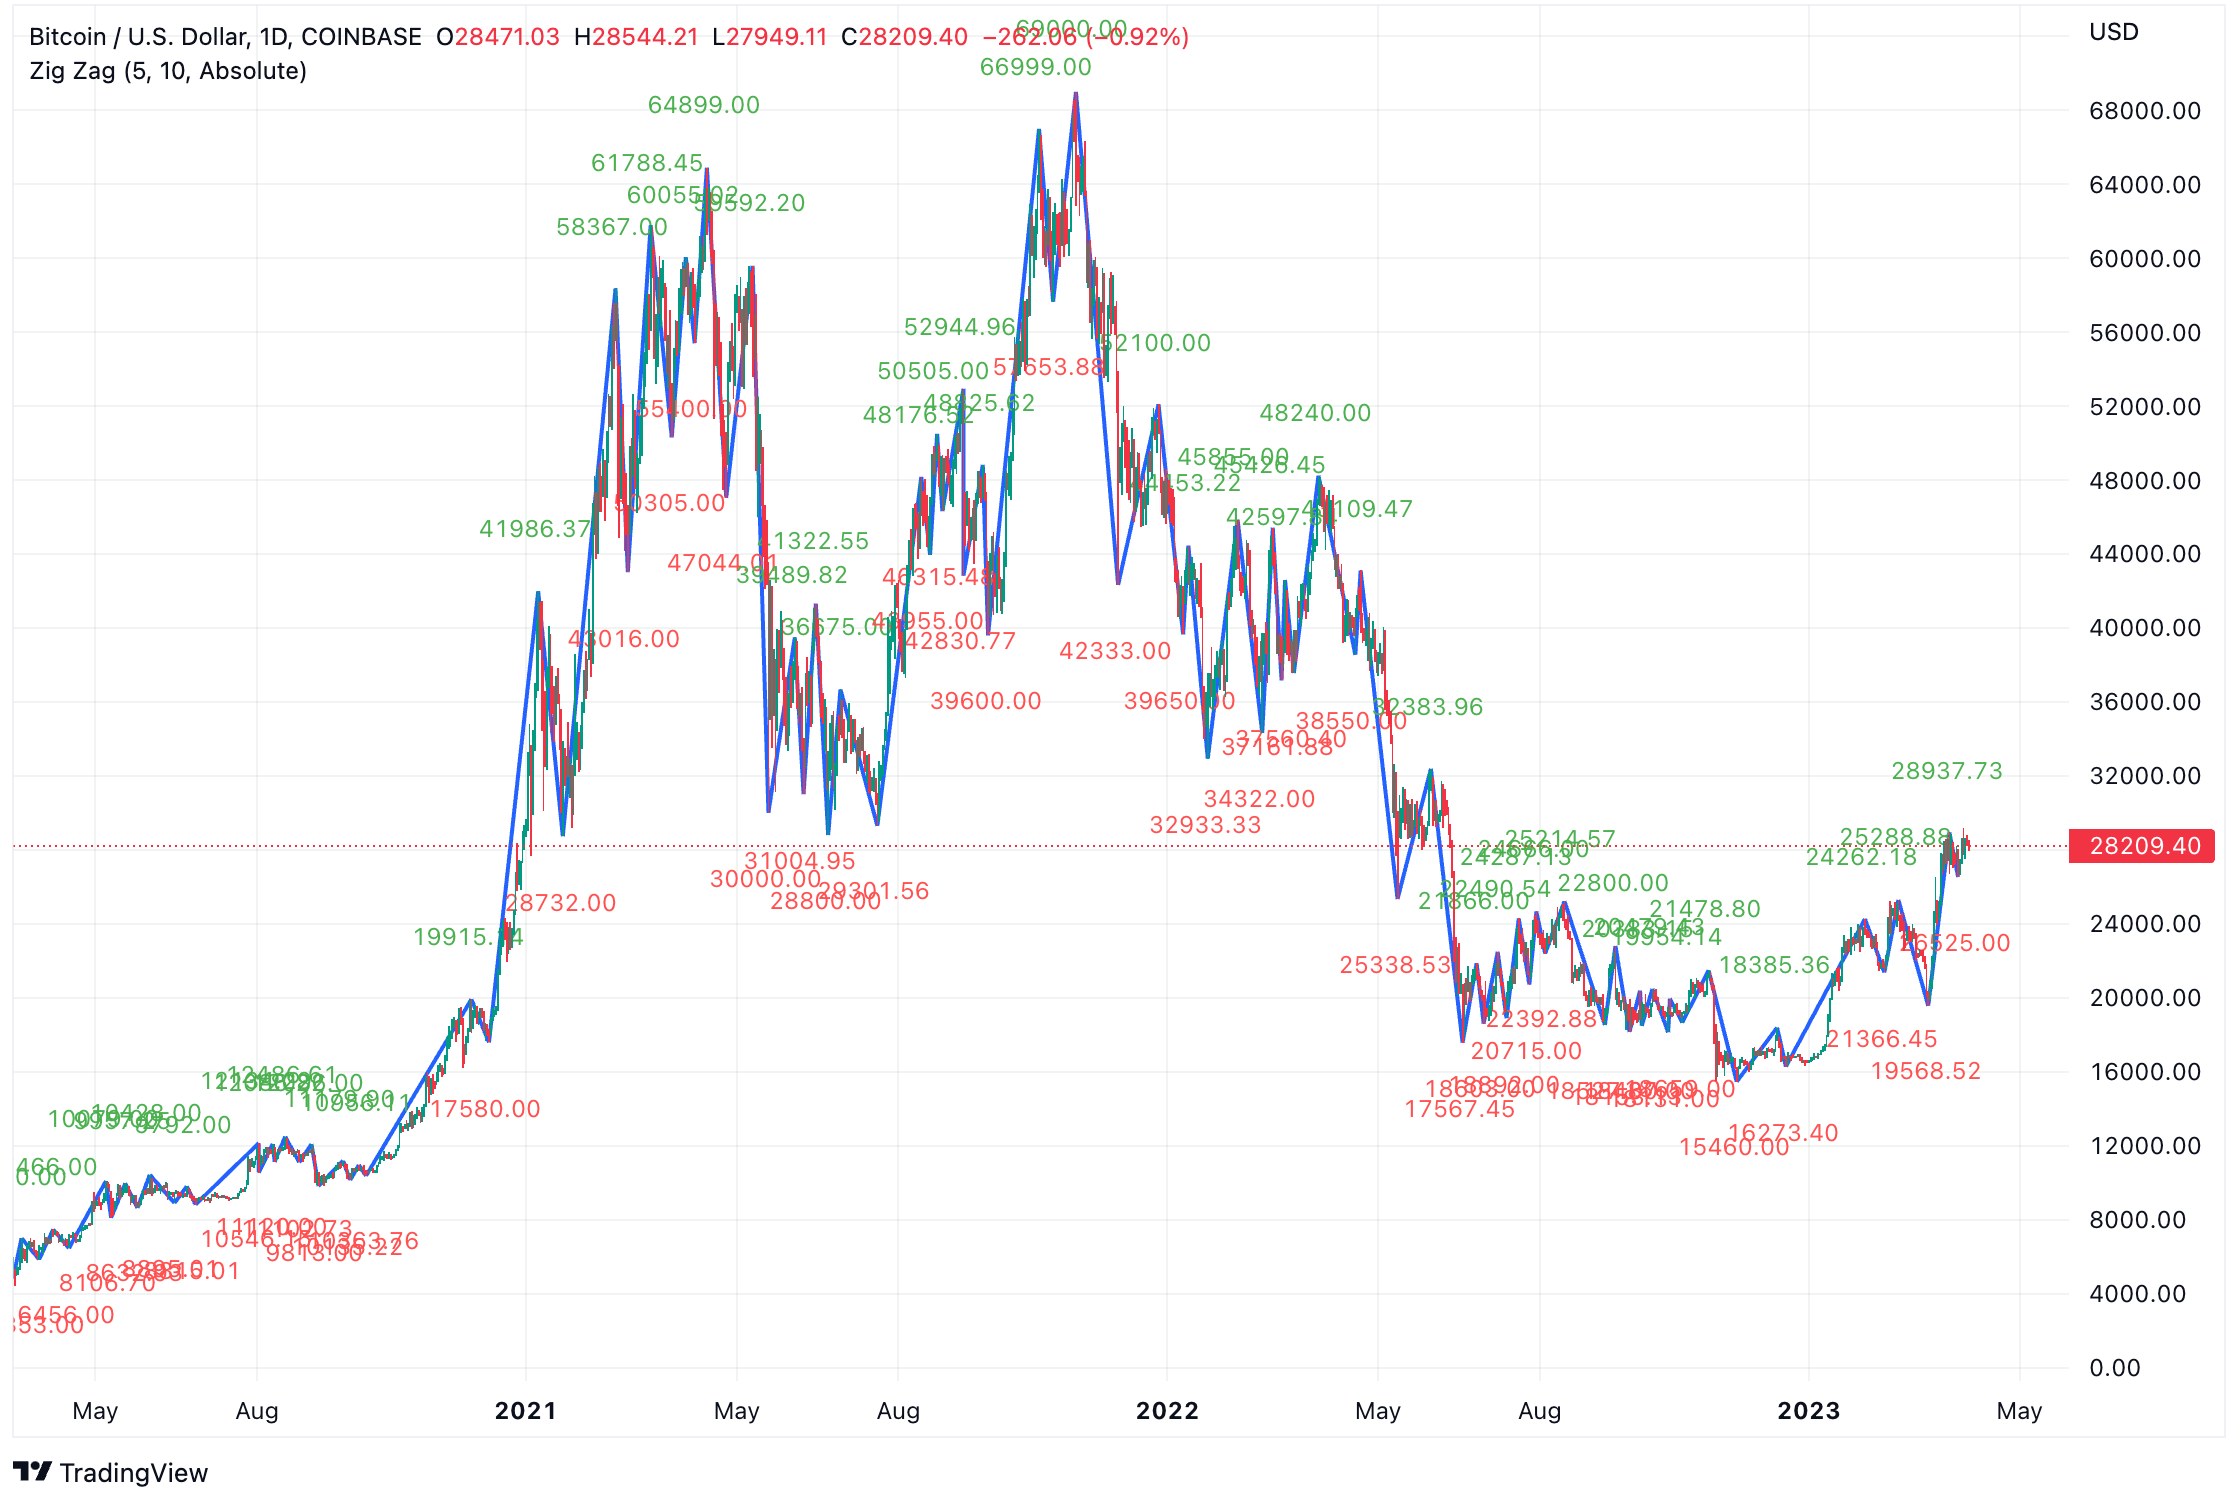
Example: When using the Zig Zag Indicator for Bitcoin price prediction, you can observe the historical price swings to identify critical support and resistance levels. These levels can help you determine potential entry and exit points for your trades. Additionally, the Zig Zag Indicator can help you identify chart patterns, such as double tops or bottoms, which can provide further insight into potential trend reversals.
Detrended Price Oscillator (DPO) For Bitcoin Price Prediction
The Detrended Price Oscillator (DPO) is a momentum-based indicator that compares the current price of an asset, such as BTC, to its past price over a specific period.
By removing the trend from the price data, the DPO helps identify potential cycles and overbought or oversold conditions.
The DPO oscillates around a zero line, with positive values suggesting upward momentum and negative values indicating downward momentum.
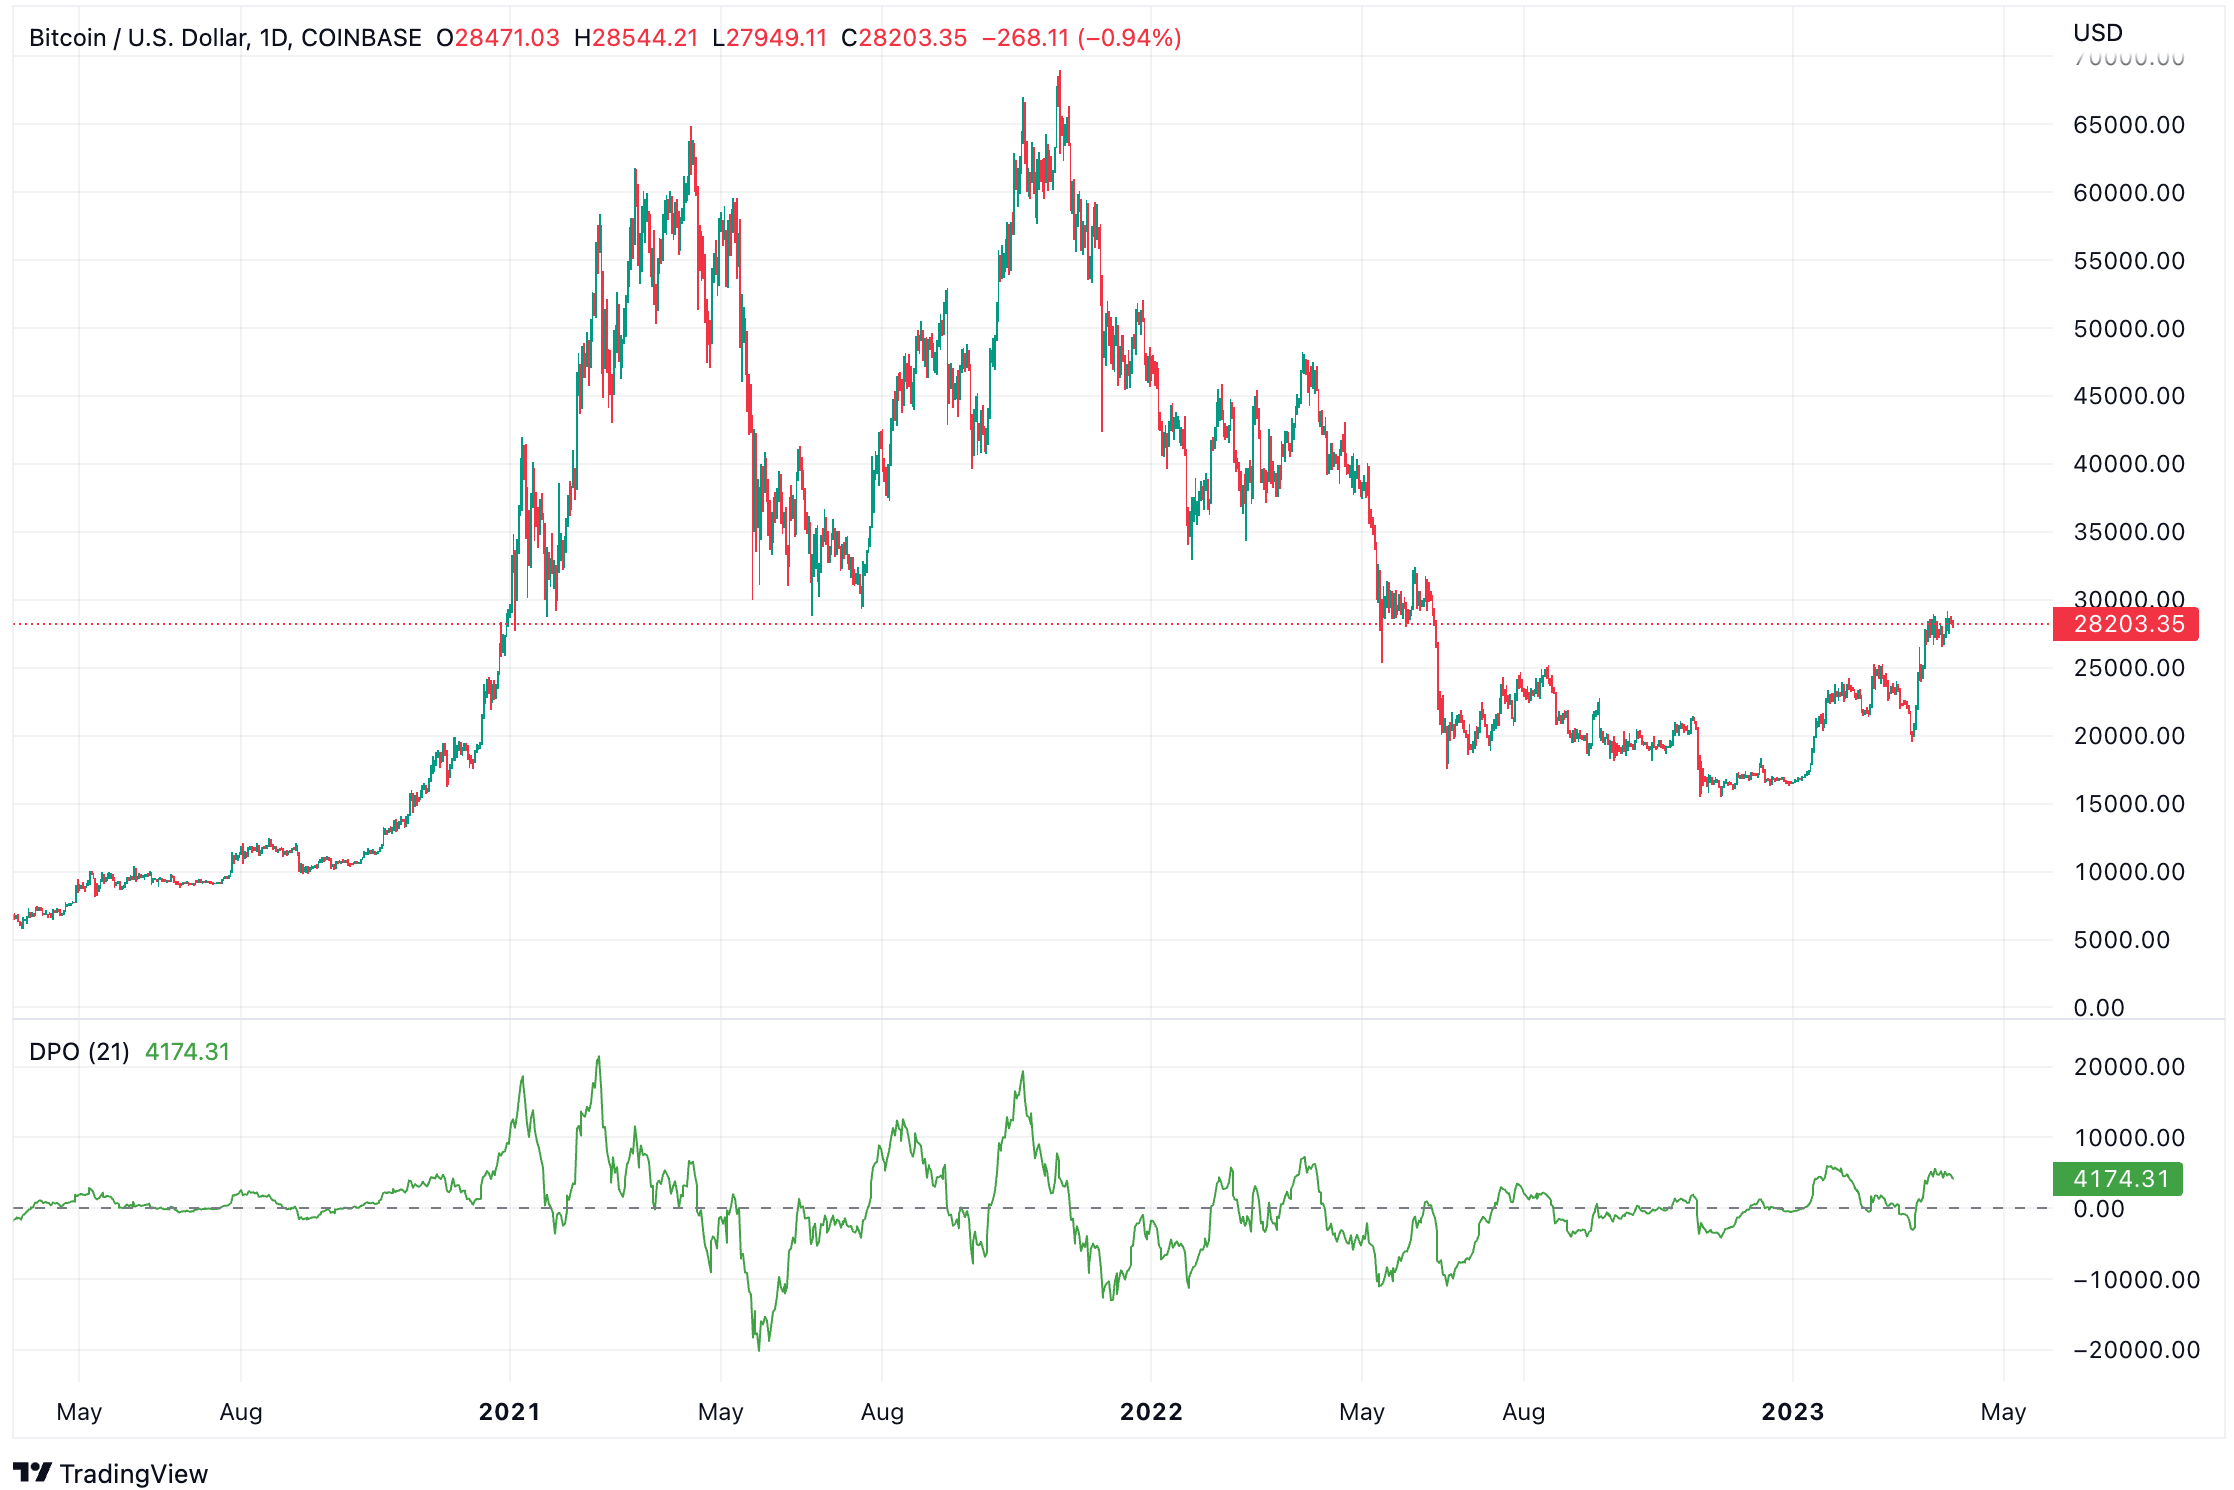
Example: When using the DPO for Bitcoin price prediction, you could look for potential buying opportunities when the DPO crosses above the zero line, signaling a bullish momentum. Conversely, when the DPO crosses below the zero line, it could suggest a bearish momentum, and you might consider selling or shorting Bitcoin. Additionally, extreme DPO values can help identify overbought or oversold conditions, providing further insight into potential market reversals.
Vortex Indicator (VI) For Bitcoin Price Prediction
The Vortex Indicator (VI) is a technical analysis tool that measures trend strength and direction by comparing the current high and low prices to previous high and low prices.
The VI consists of two oscillating lines – one measuring upward trend strength (VI+), and the other measuring downward trend strength (VI-).
When the VI+ line crosses above the VI- line, it can signal a bullish trend, while a cross below the VI- line can indicate a bearish trend.
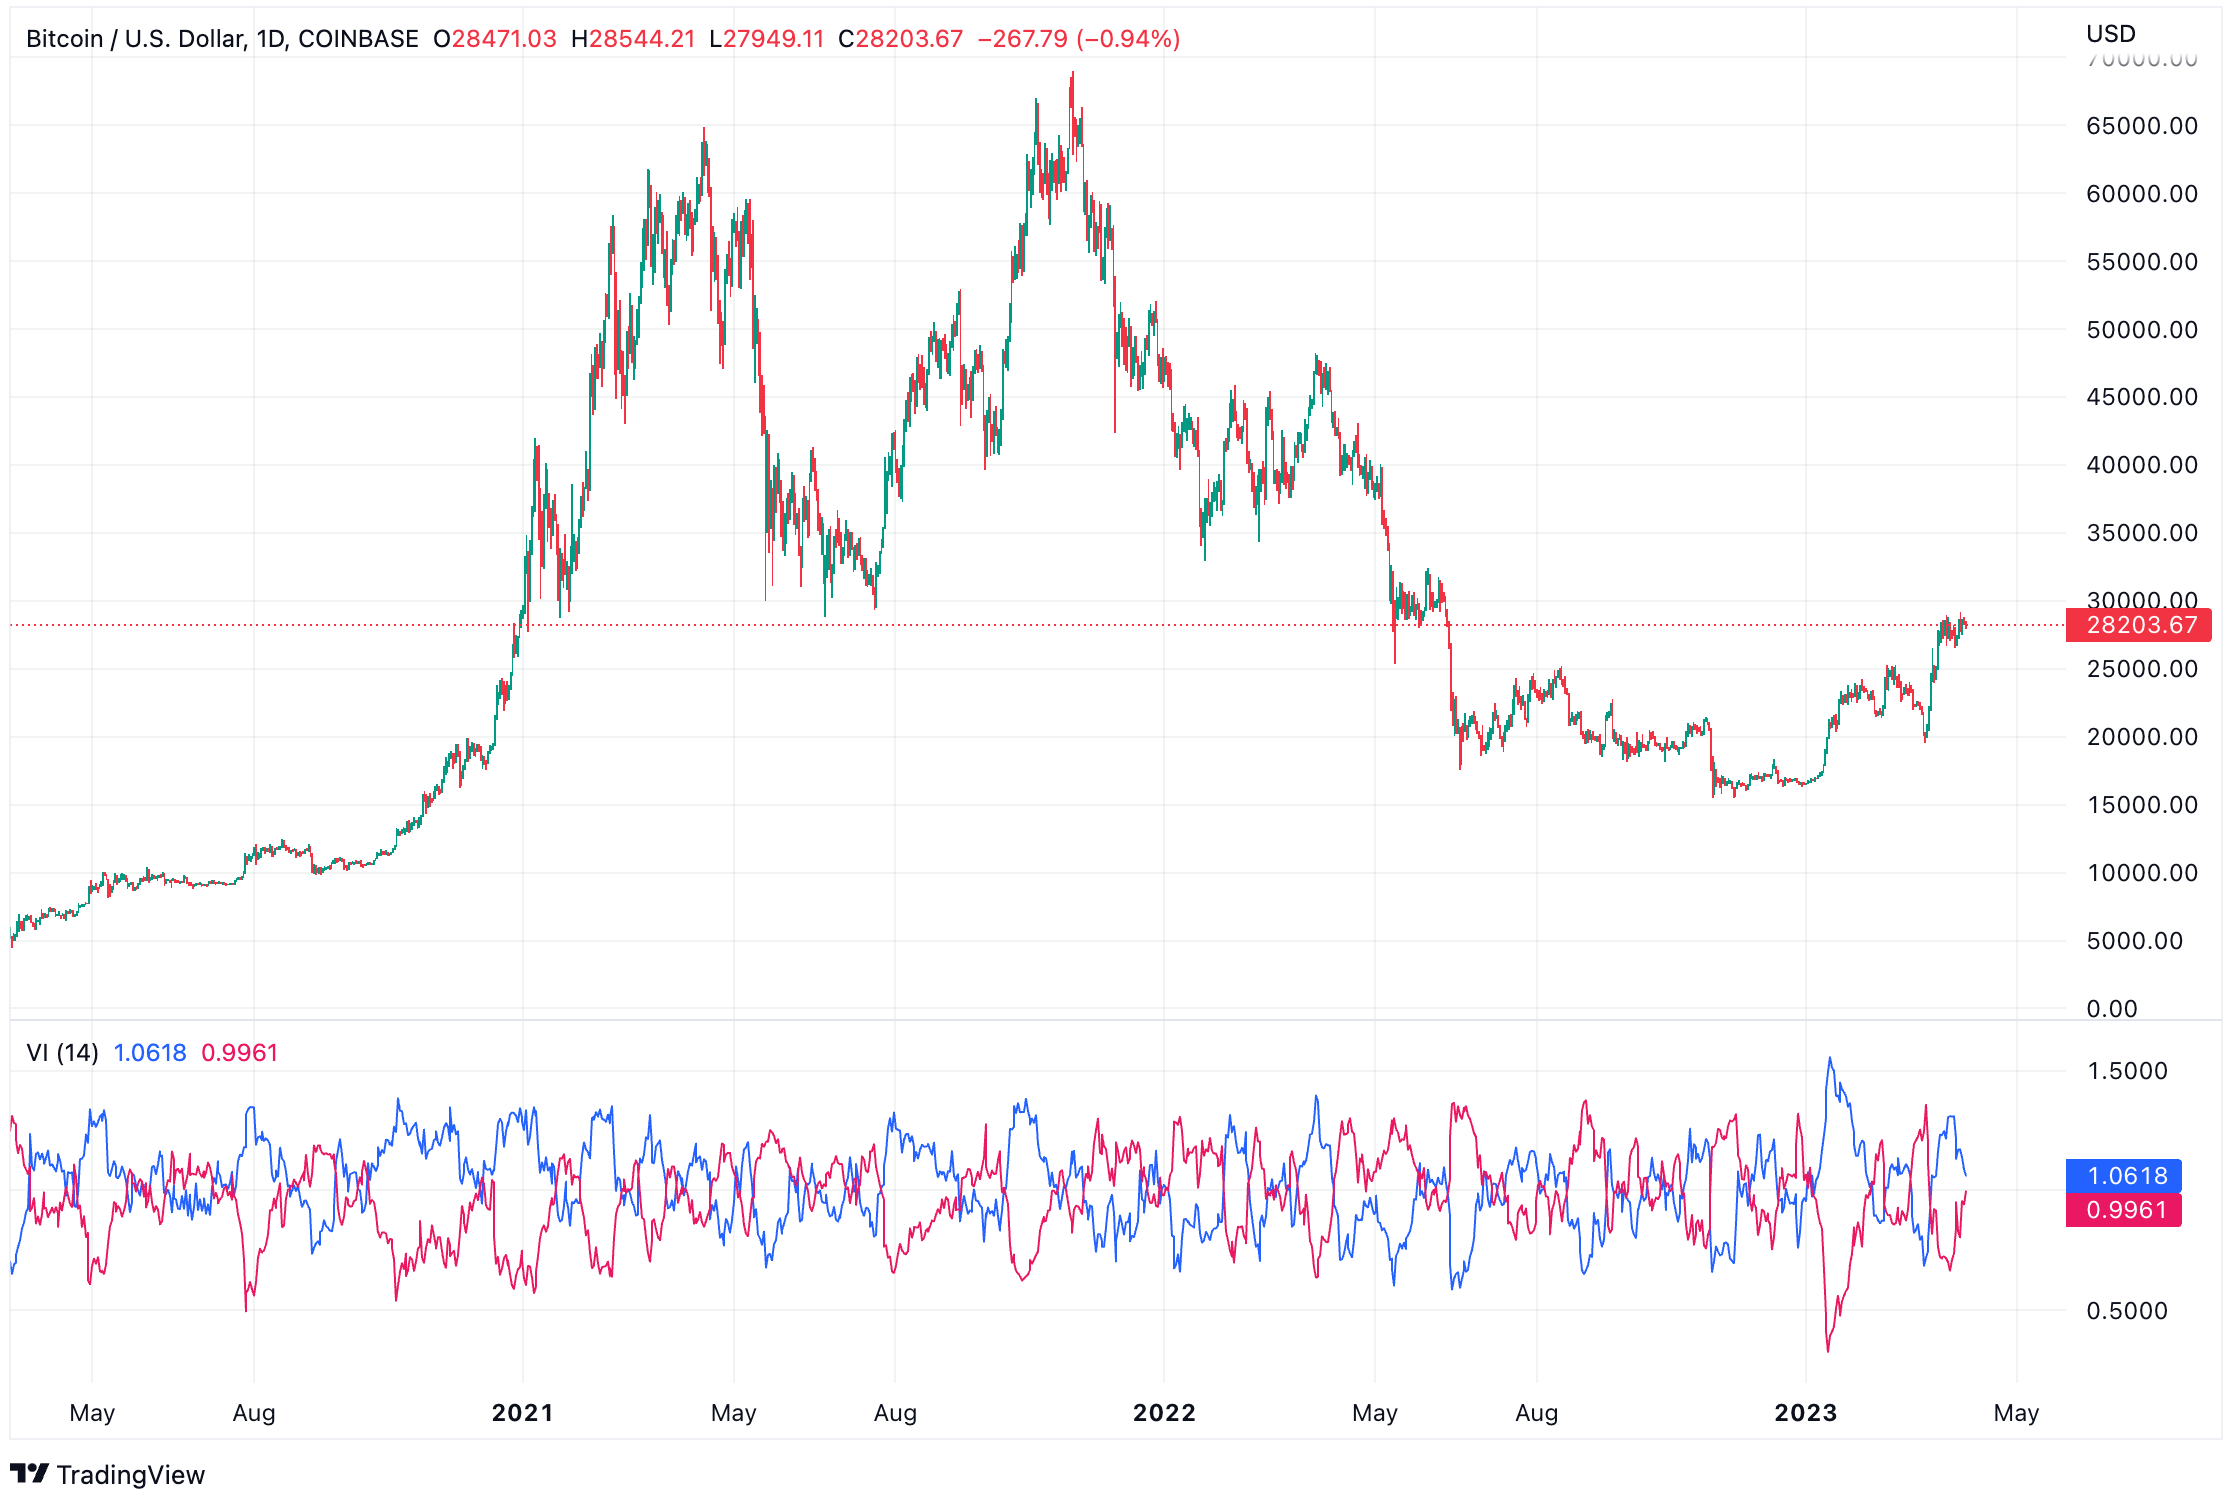
Example: When applying the Vortex Indicator to Bitcoin prediction, you could look for potential buying opportunities when the VI+ line crosses above the VI- line, suggesting a bullish trend. On the other hand, when the VI+ line crosses below the VI- line, it may indicate a bearish trend, and you might consider selling or shorting BTC.
Elder’s Force Index (EFI) – For Bitcoin Price Prediction
The Elder’s Force Index (EFI) is a momentum indicator that combines price and volume data to measure the force behind an asset’s price movement, such as BTC.
By comparing the current price to the previous price and multiplying the result by the trade volume, the EFI helps identify potential trend reversals and overbought or oversold market conditions.
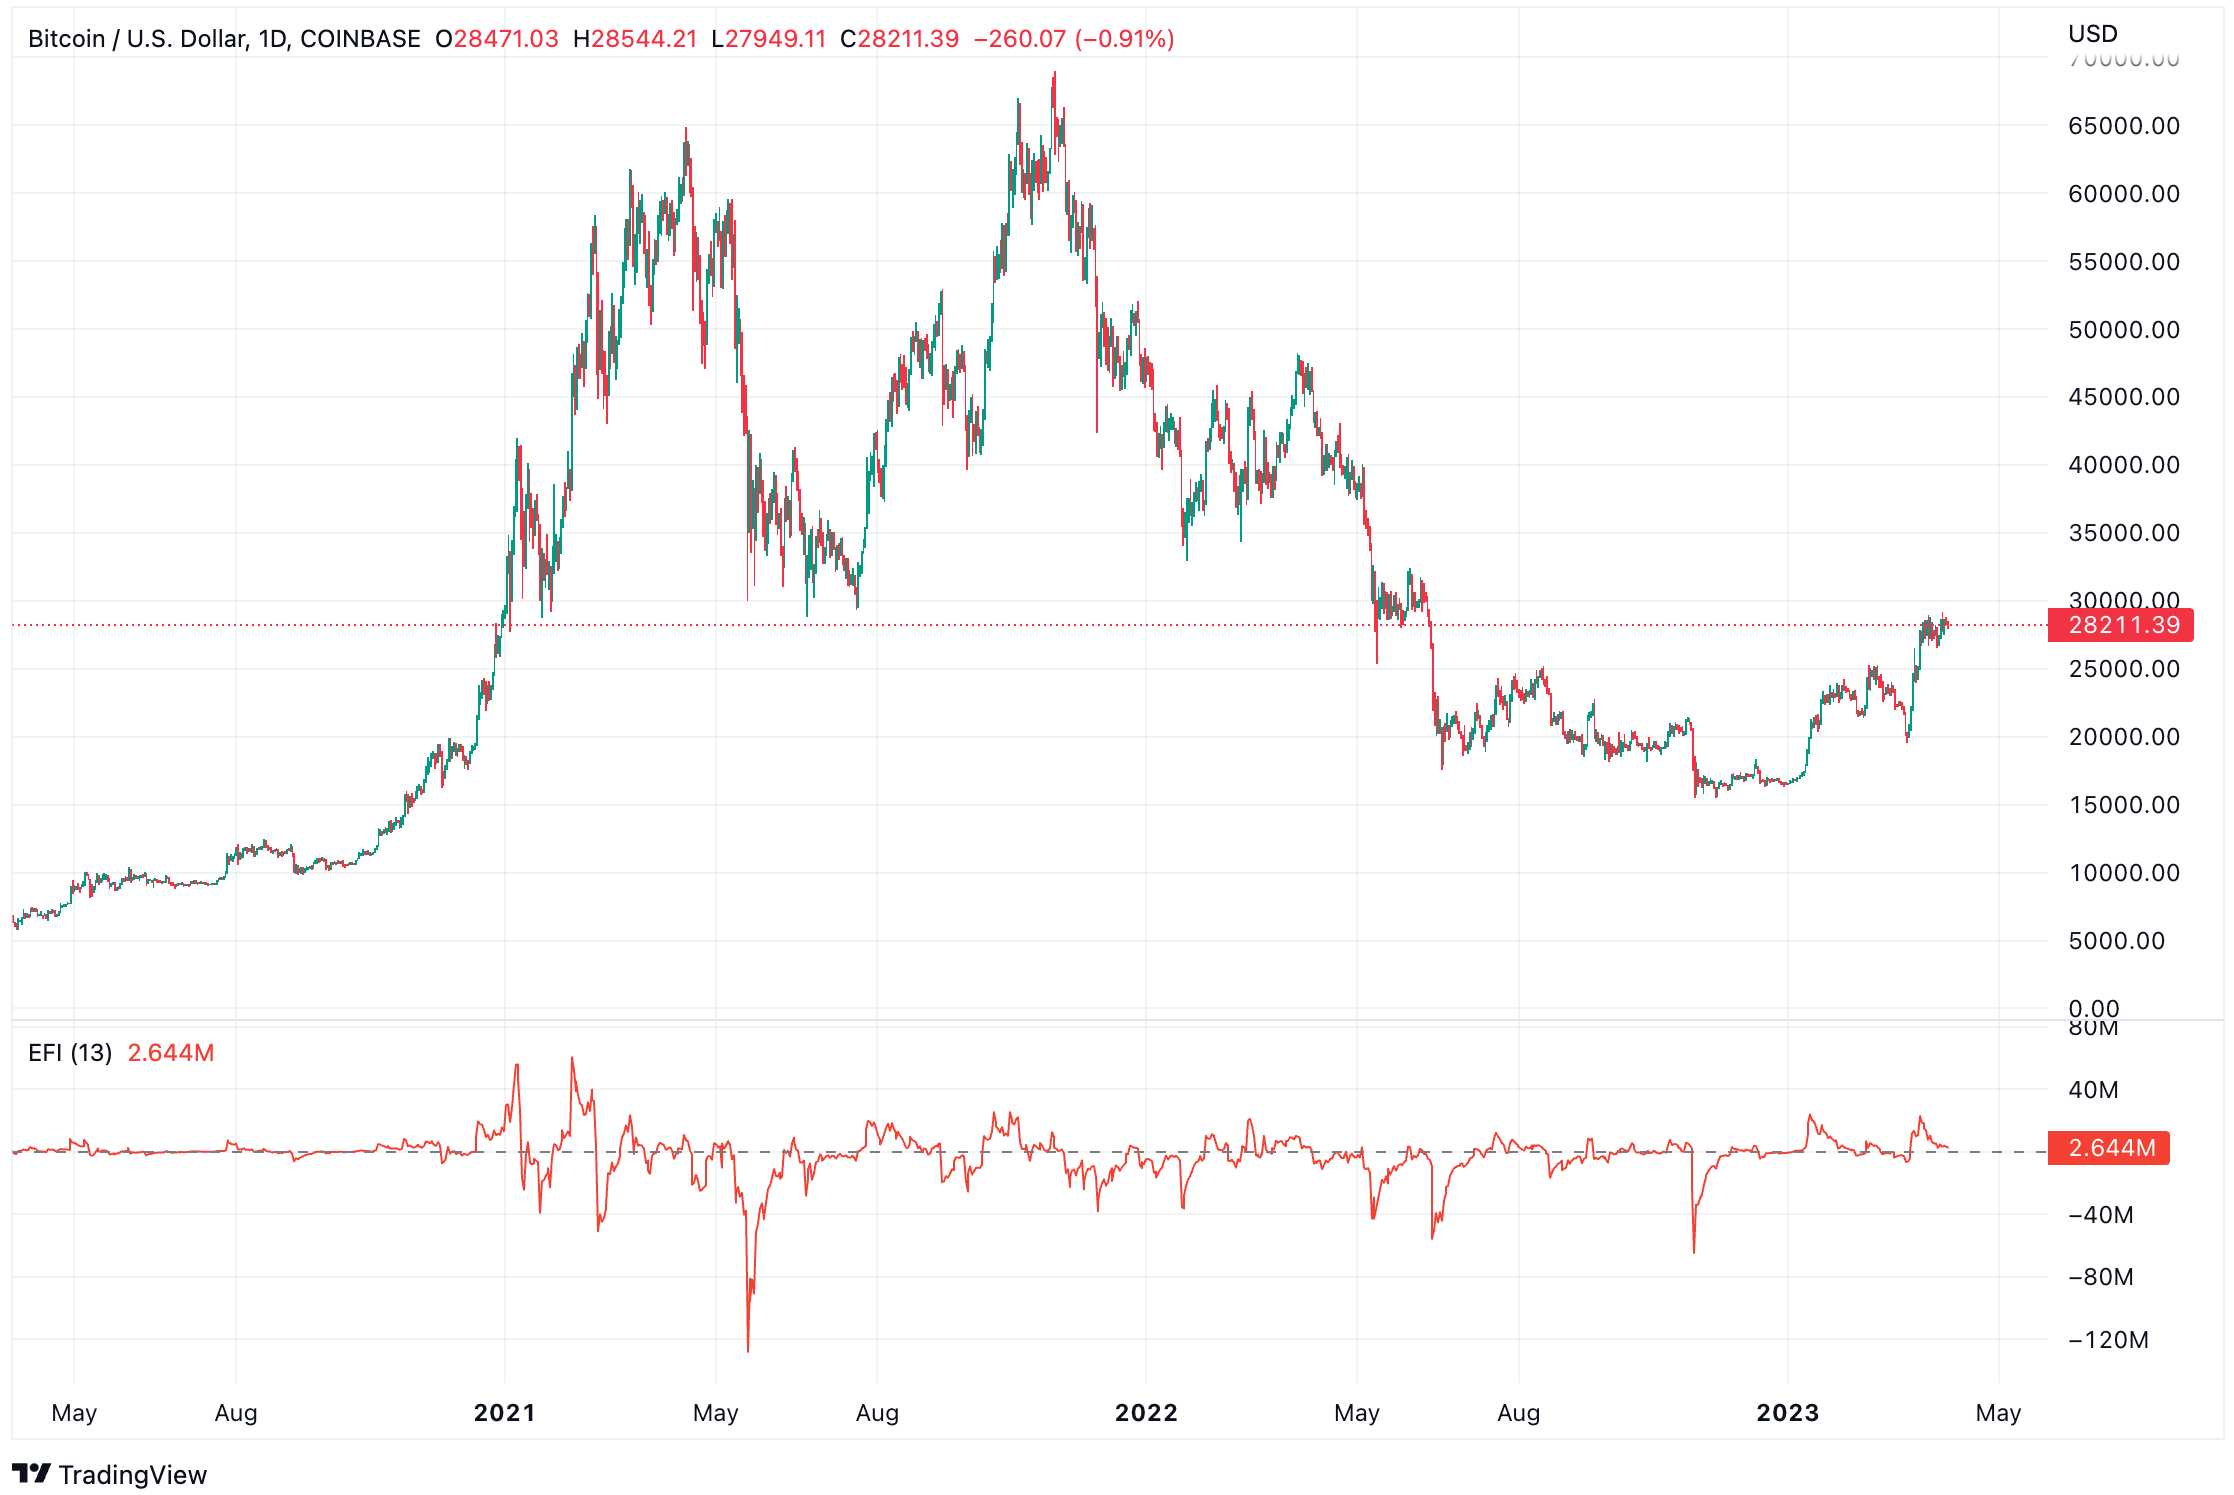
Example: When using the EFI for Bitcoin price prediction, you could look for potential buying opportunities when the EFI is negative and starts to rise, signaling a potential bullish reversal. Conversely, when the EFI is positive and begins to decline, it could suggest a bearish reversal, and you might consider selling or shorting BTC. Additionally, divergences between the EFI and price can help confirm potential trend reversals.
Williams %R For Bitcoin Price Prediction
The Williams %R is a momentum-based oscillator that measures the price of an asset, such as Bitcoin, relative to its highest and lowest prices over a specified period.
The Williams %R ranges from -100 to 0, with values below -80 generally indicating oversold conditions and values above -20 suggesting overbought conditions.
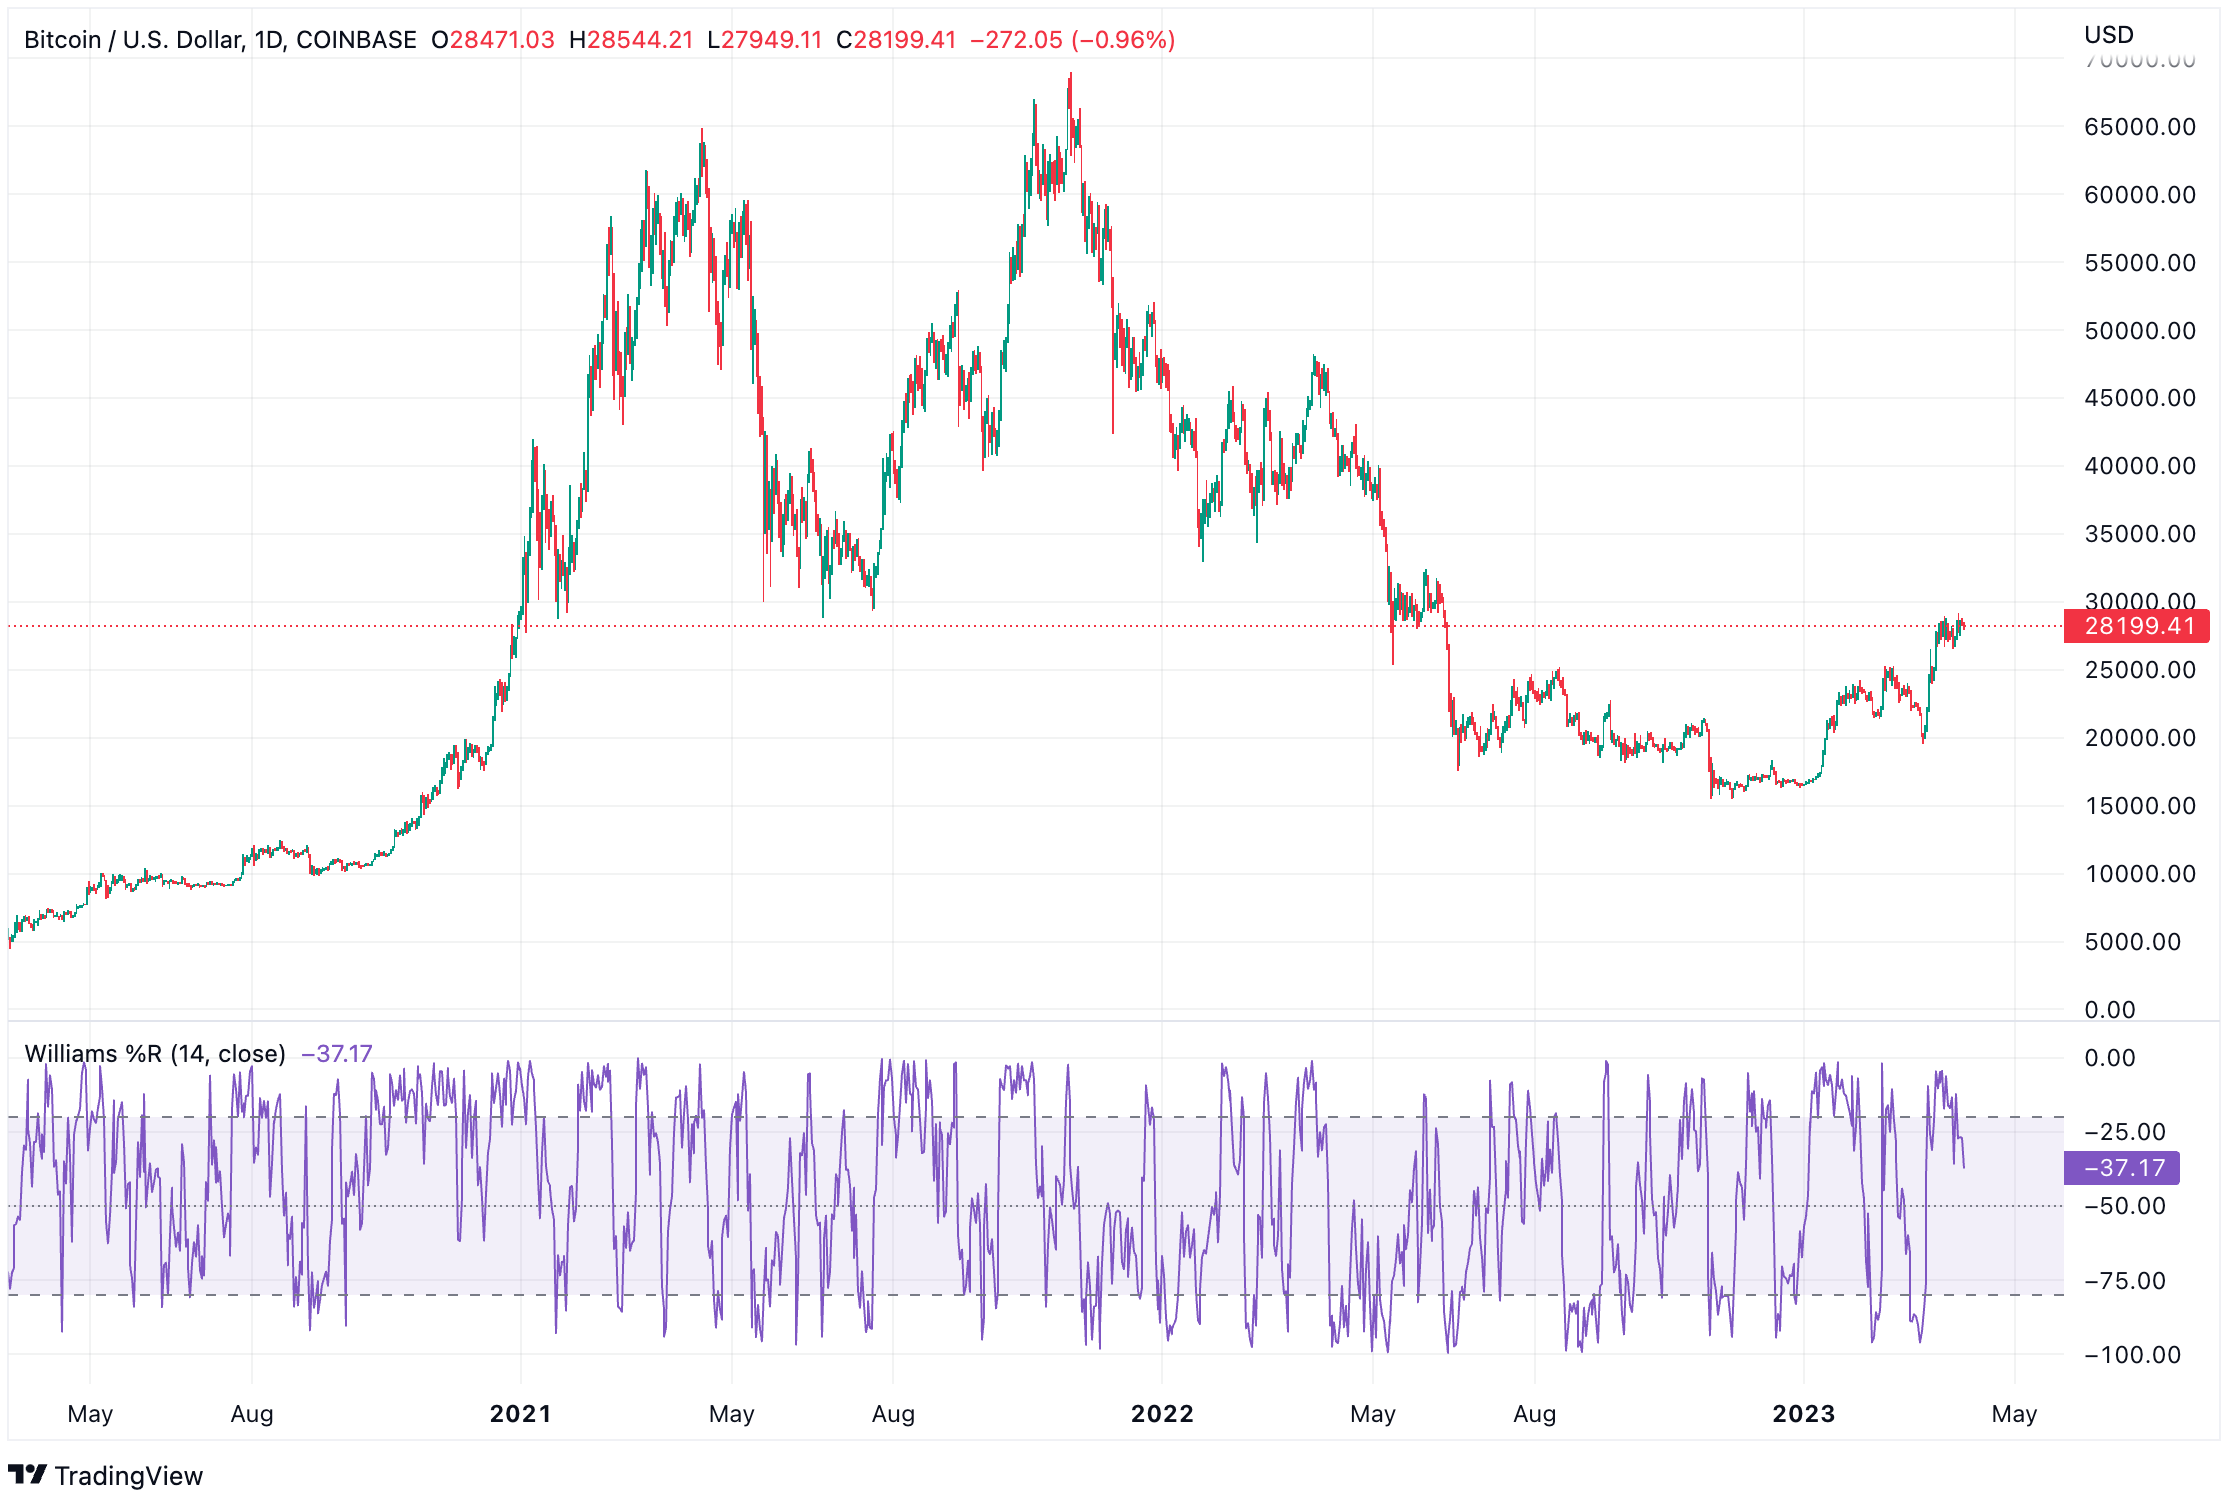
Example: When predicting Bitcoin’s price using the Williams %R, you could look for potential buying opportunities when the indicator falls below -80, signaling an oversold market. Conversely, when the Williams %R rises above -20, it could suggest overbought conditions, and you might consider taking profits or shorting BTC.
By incorporating these technical indicators into your Bitcoin price prediction strategy, you can gain valuable insights into market dynamics and make better-informed trading decisions.
Remember to use multiple indicators and continuously adapt your approach based on the ever-changing conditions of the crypto market.
Combining Technical Indicators for Accurate Bitcoin Price Prediction
As a savvy trader or investor, you already know that relying on a single technical indicator to predict Bitcoin’s price can be a risky strategy.
To make well-informed investment decisions, in the dynamic world of cryptocurrencies, it’s essential to understand the importance of using multiple technical indicators and how to combine them for a comprehensive analysis.
The Importance of Using Multiple Technical Indicators
While individual technical indicators can provide valuable insights, they’re not infallible. By using multiple indicators, you increase the likelihood of making accurate price predictions and minimize the high risk of false signals.
Combining indicators from different categories, such as trend, momentum, and volatility, can help you gain a more holistic view of the market.
Example: Relying solely on a momentum indicator like the RSI could lead to premature buying or selling decisions. However, by combining the RSI with a trend indicator like the Moving Average Convergence Divergence (MACD) and a volatility indicator like Bollinger Bands, you can better confirm potential market reversals and entry/exit points.
How to Combine Various Indicators for a Comprehensive Analysis
When combining technical indicators for Bitcoin price prediction, it’s crucial to find the right balance. Using too few indicators might not provide enough information, while using too many can lead to analysis paralysis. Here are some tips on how to combine indicators effectively:
- Choose complementary indicators: Select indicators that complement each other and provide different types of information. For example, combine trend indicators (e.g., Moving Averages) with momentum indicators (e.g., RSI) and volatility indicators (e.g., Bollinger Bands) to get a well-rounded view of the market.
- Look for confirmation: Use multiple indicators to confirm potential trade signals. For instance, if the RSI indicates an oversold condition and the MACD shows a bullish crossover, it could strengthen the case for a potential upward price movement.
- Be mindful of divergences: Pay attention to instances when the price action diverges from the indicator’s signals. Divergences can be early warning signs of potential trend reversals and can help you make better-informed trading decisions.
- Keep it simple: While it’s essential to use multiple indicators, avoid overcomplicating your analysis. Stick to a few key indicators that you understand well and can interpret confidently.
By combining various technical indicators, you can increase the accuracy of your BTC price predictions and make more informed decisions and own research in the fast-paced world of cryptocurrency.
Always remember that no indicator is perfect, and it’s crucial to stay flexible and adapt to the ever-changing market conditions. Happy trading!
The Pillars of Bitcoin Prediction: Fundamental Factors
As a crypto aficionado, I always take fundamental analysis into account when it comes to Bitcoin price projection. This method involves examining factors such as:
Adoption Rate
Adoption Rate: The more people and businesses that embrace and use BTC, the higher its demand, which can, in turn, drive up its price.
Bitcoin’s adoption rate has been steadily growing, but it’s challenging to provide an exact figure. The adoption of Bitcoin can be gauged by several metrics, including the number of users, transactions, businesses accepting Bitcoin, and volume.
- Number of users: It’s estimated that there are over 100 million cryptocurrency users worldwide, with BTC being the most widely recognized and used digital currency. This number has been growing rapidly, especially in the last few years.
- Transactions: The number of daily Bitcoin transactions has fluctuated over time, but it has generally shown an upward trend. As of September 2021, there were around 300,000 to 400,000 daily Bitcoin transactions on average.
- Businesses accepting Bitcoin: Many businesses, both large and small, have started accepting BTC as a payment method. This includes well-known companies like Microsoft, AT&T, and Overstock.com, as well as smaller online and brick-and-mortar shops.
- Trading volume: Bitcoin’s daily trading volume has grown significantly over the years, reflecting increased interest and adoption. In 2021, daily trading volume often exceeded $50 billion, with occasional spikes above $100 billion during periods of high volatility.
- Institutional adoption: Investors, such as hedge funds, pension funds, and corporations, have shown increased interest in BTC as an investment and store of value. This has led to the development of various investment vehicles, like Bitcoin futures and exchange-traded funds (ETFs), which facilitate institutional investment in the asset.
Regulatory Developments
Regulatory Developments: Changes in regulations across different countries can have a significant impact on Bitcoin’s price. A ban or restriction, for example, could result in reduced demand and a lower price.
Regulatory changes in different countries can have a significant impact on Bitcoin’s price, as they can influence market sentiment, adoption rates, and the overall perception of the cryptocurrency. Here are some examples of regulatory changes and their potential impact on Bitcoin’s price:
- Bans or restrictions: If a country bans or restricts the use of Bitcoin or other cryptocurrencies, it can create negative sentiment in the market, leading to a drop in the price. For instance, when China announced crackdowns on cryptocurrency mining and trading in 2021, it led to a substantial decline in Bitcoin’s price.
- Taxation and reporting requirements: Changes in tax laws or reporting requirements related to cryptocurrencies can influence investor sentiment and market dynamics. For example, in the United States, the IRS has classified cryptocurrencies as property for tax purposes, meaning that every transaction involving cryptocurrencies could be subject to capital gains tax. Such regulations may affect trading behavior and price volatility.
- Regulatory clarity: The introduction of clear and supportive regulatory frameworks can have a positive impact on Bitcoin’s price, as it can boost investor confidence and facilitate wider adoption. For instance, Japan’s recognition of BTC as a legal form of payment in 2017 helped spur its adoption and contributed to the price rally that year.
- Anti-money laundering (AML) and Know Your Customer (KYC) regulations: Strict AML and KYC requirements can impact the price of Bitcoin by affecting the ease of trading and investing in cryptocurrencies. While such regulations are essential for preventing illicit activities, they can also create barriers for some market participants, potentially affecting liquidity and price.
- Institutional adoption: Regulations that enable institutional investors to participate in the crypto market can lead to increased demand and higher prices. The approval of Bitcoin futures contracts by the U.S. Commodity Futures Trading Commission (CFTC) in 2017 and the ongoing pursuit of BTC ETF approvals are examples of regulatory developments that can influence institutional adoption and the price of Bitcoin.
Utility
Cryptocurrencies, such as Bitcoin, have been gaining traction and evolving since their inception.
They offer several real-world use cases that are contributing to their increasing acceptance and integration with existing financial systems. Here are some key real-world use cases of cryptocurrencies:
- Digital payments: Cryptocurrencies enable fast, secure, and low-cost transactions across borders, making them an appealing alternative to traditional payment methods. Many businesses, both online and offline, have started to accept cryptocurrencies as a form of payment. This trend is expected to grow as more people become familiar with digital currencies and their benefits.
- Remittances: International remittances can be expensive and slow due to fees and intermediary involvement. Cryptocurrencies can provide a more efficient alternative for sending money across borders, especially in regions with limited access to traditional banking services.
- Financial inclusion: Cryptocurrencies have the potential to promote financial inclusion by providing access to financial services for unbanked and underbanked populations. Individuals can store, send, and receive money using cryptocurrencies without the need for a traditional bank account.
- Decentralized finance (DeFi): DeFi is an emerging sector that aims to provide decentralized financial services, such as lending, borrowing, and trading, by leveraging blockchain technology and smart contracts. Cryptocurrencies play a crucial role in this ecosystem, as they are used as collateral, liquidity, and payment tokens.
- Tokenization of digital assets: Blockchain technology enables the tokenization of various digital assets, such as real estate, art, and commodities, by creating digital representations of these risky assets on a blockchain. These tokenized assets can be traded and managed using cryptocurrencies, opening up new investment opportunities and increasing liquidity.
- Smart contracts: Cryptocurrencies like Ethereum enable the creation of smart contracts, which are self-executing contracts with the terms directly written into code. This allows for trustless, automated transactions and agreements without the need for intermediaries, reducing costs and increasing efficiency.
- Privacy and security: Some cryptocurrencies, such as Monero and Zcash, focus on providing enhanced privacy and security features. These cryptocurrencies can be used for transactions where users prefer to maintain a higher degree of anonymity.
- Digital identity: Cryptocurrencies can be integrated with digital identity solutions to improve the security and efficiency of online authentication and authorization processes. Blockchain-based digital identity systems can provide secure, decentralized, and user-controlled identity management.
Market Sentiment: How Bitcoin News Prediction Wors?
Market sentiment, also known as investor sentiment or market psychology, refers to the overall attitude and feelings of investors and traders towards a particular financial market, asset, or security.
It plays a crucial role in driving price movements and can influence the behavior of market participants.
Market sentiment can be bullish (positive) when investors expect prices to rise or bearish (negative) when they expect prices to fall.
Here are some factors and tools used to gauge market sentiment:
- News and media: Financial news, analyst reports, and media coverage can significantly impact market sentiment. Positive news stories about a specific asset or market can create optimism and drive prices up, while negative news can generate fear and pessimism, causing prices to drop.
- Social media and forums: Analyzing discussions on social media platforms, such as Twitter, Reddit, or Telegram, can provide insights into the prevailing sentiment among retail investors and traders. Sentiment analysis tools can help gauge the overall tone of these conversations.
- Market surveys: Some organizations conduct regular surveys of investor sentiment, such as the American Association of Individual Investors (AAII) Sentiment Survey or the CNN Fear & Greed Index. These surveys can provide a snapshot of investor sentiment at a given time.
- Commitments of Traders (COT) report: The COT report, published by the Commodity Futures Trading Commission (CFTC), provides insights into the positions held by various market participants in futures markets. This data can be used to analyze sentiment among institutional traders and large speculators.
- Volatility indices: Volatility indices, such as the CBOE Volatility Index (VIX), measure market expectations of future volatility. High volatility often indicates increased fear and uncertainty, while low volatility suggests a more complacent and optimistic market sentiment.
- Market breadth indicators: Market breadth indicators, such as the advance/decline line or the new highs/new lows ratio, can provide insights into the overall strength or weakness of a market. A strong market breadth indicates positive sentiment, while a weak market breadth may suggest negative sentiment.
The Bottom Line: Making Your Own Bitcoin’s Price Predictions
Alright, we’ve covered a lot of ground here. By now, you should have a better understanding of the factors that influence Bitcoin’s price and how to use that knowledge to make your own predictions.
Remember, though, that predicting the price of BTC (or any asset, for that matter) is never a surefire thing. There’s always a degree of uncertainty and risk involv
FAQ
When will Bitcoin go up?
There isn’t a specific timeline for bitcoin price predictions when Bitcoin will go up.
Many of the financial experts here have made bitcoin price predictions, with different timeframes, some of which have already passed without the predicted price being reached.
However, these experts generally maintain a long-term bullish outlook on Bitcoin.
It’s important to understand that these are opinions and not guarantees. The cryptocurrency market is volatile and influenced by various factors.
Always conduct thorough own research and consider the risks involved before making any investment decisions.
Should I Buy Bitcoin?
As a person who keeps an eye on crypto experts own research, expert opinions, and their investment advice, I understand that the decision to purchase Bitcoin can be a tricky one.
Many financial experts do have a bullish outlook on Bitcoin’s near future, citing factors like limited supply, increasing demand, and growing adoption.
However, it’s crucial to remember that I am not a financial advisor, and these opinions aren’t guarantees.
The cryptocurrency market is notoriously volatile, and your investment can be impacted by various factors.
My advice would be to conduct thorough own research for good investment, assess your high risk tolerance, and consider seeking professional investment advice before making any decisions.
Ultimately, the choice to buy Bitcoin is yours to make, based on your own judgment and circumstances.
How High Can Bitcoin Go?
As an avid follower of cryptocurrency experts, I’ve observed a wide range of predictions about how much bitcoin be worth how high Bitcoin can go.
Some, like Raoul Pal and Chamath Palihapitiya, foresee bitcoin rise be worth a staggering $1 million per coin in the long run.
Others, such as Anthony Pompliano and Arthur Hayes, are more conservative with estimates around $100,000.
Will Bitcoin Crash Again in 2024?
Predicting Bitcoin’s near future, especially regarding potential crypto winter, is quite challenging.
While many financial experts still have a positive bull run outlook for Bitcoin, it’s important to remember that the market is highly volatile and can be influenced by various other factors too, such as regulatory changes or macroeconomic events.
I’m not a financial or good investment advisor, and I can’t predict with certainty whether the Bitcoin bubble will crash in 2024.
What I suggest is to keep a close eye on market trends, stay informed, and be prepared for both ups and downs in the market.
As always, do your own research and consider seeking professional advice before making any investment decisions. Remember, the market can be unpredictable, so proceed any financial or trading or financial situation, with caution.
average price average price average price average price average price average price average price average price average price average price average price average price average price average price
