Hello there, fellow crypto explorers! I’m thrilled to share an exciting journey with you today. We’re about to delve into a topic that has been creating quite a buzz lately: Binance Coin price prediction. As we all know, predicting the future of any cryptocurrency is like trying to catch the wind. It’s elusive but with the right tools and insights, not entirely impossible.
Indeed, the world of crypto forecasting is as fascinating as it is complex. That’s why we’re going to roll up our sleeves today and dive into the captivating realm of Binance Coin (BNB) price prediction. We’ll navigate through Binance Coin’s price history, discuss its purpose, and decipher the techniques and tools that seasoned traders utilize to make educated predictions about its future value.
Now, you may wonder: why all this fuss about predicting BNB cost? Well, understanding its potential future value is crucial for many reasons. It could inform your investment strategies, help you seize opportunities, and most importantly, prepare you for potential market swings.
So, are you ready to embark on this exhilarating journey with me? I assure you, it’s going to be an insightful ride. Let’s delve deeper, arm ourselves with knowledge, and together, unravel the future of Binance Coin. Keep reading – you won’t want to miss what’s coming next!
Binance Coin (BNB) Overview
| BNB Price | $724.25 |
| BNB Price Change 24h | 1.29% |
| BNB Price Change 7d | 5.34% |
| BNB Market Cap | $100,879,803,116.21 |
| BNB Circulating Supply | 139,289,099.55 |
| BNB Trading Volume 24h | $2,866,670,978.19 |
| BNB All-Time High (ATH) | $690.93 |
| BNB All-Time Low (ATL) | $0.09611 |
A Brief History: Binance Coin and Its Purpose
Launched into the crypto-verse in July 2017 by the Binance exchange, BNB initially took its first steps on the Ethereum blockchain. However, in April 2019, it transitioned to its own native blockchain, the Binance Chain. This marked a key milestone in BNB’s story, amplifying its capabilities and widening its sphere of application.
Now, you’re probably pondering, ‘What role does Binance Coin play?’ Initially, BNB was conceived to function as the native utility token on the Binance exchange. Users could wield BNB for a variety of purposes, including paying for transaction fees, participating in token sales, and even for in-app purchases.
But BNB’s role extends beyond these functionalities. Possessing BNB in your crypto arsenal could confer some added perks on the Binance platform, like potentially slashing your trading fees and enhancing your chances of getting into Binance’s highly sought-after Launchpad sales.
The reach of BNB has continued to broaden over time. Today, you can utilize BNB for travel bookings, online shopping, and even to settle your coffee bill at some cafes!
Let’s shift our focus to the financial journey of Binance Coin. BNB’s price trajectory has seen numerous peaks and troughs. Here are some of the most striking price transformations:
- July 2017: BNB coin enters the trading scene at around $0.10 post its Initial Coin Offering (ICO).
- January 2018: BNB tokens ascend to an impressive peak of about $24 amidst the grand crypto bull run.
- March 2018: Binance Coin experiences a significant downturn, plummeting to nearly $8.
- June 2019: BNB coin sets a new record, reaching a high of roughly $39.
- March 2020: Amidst the global market crash triggered by the COVID-19 pandemic, BNB’s value dips to around $10.
- May 2021: BNB tokens scale an incredible all-time high of nearly $690 during the 2021 crypto bull run.
- June 2021: BNB coin witnesses a steep descent, trading near $250 as the cryptocurrency market transitions into a bear phase.
In our pursuit of accurate Binance Coin price prediction, understanding BNB’s past and the purpose it serves is paramount. The broader the coin’s utility, the higher the potential demand, which in turn could steer its price.
Binance Coin – BNB Price Prediction For Today, Tomorrow, This Week, and Next 30 Days
| Date | Price | Change |
|---|---|---|
| July 19, 2025 | 717.01 | -1.00% |
| July 20, 2025 | 721.52 | 0.63% |
| July 21, 2025 | 725.28 | 0.52% |
| July 22, 2025 | 726.36 | 0.15% |
| July 23, 2025 | 720.26 | -0.84% |
| July 24, 2025 | 719.04 | -0.17% |
| July 25, 2025 | 724.65 | 0.78% |
| July 26, 2025 | 717.69 | -0.96% |
| July 27, 2025 | 718.41 | 0.10% |
| July 28, 2025 | 724.66 | 0.87% |
| July 29, 2025 | 728.79 | 0.57% |
| July 30, 2025 | 733.16 | 0.60% |
| July 31, 2025 | 729.06 | -0.56% |
| August 01, 2025 | 724.83 | -0.58% |
| August 02, 2025 | 721.28 | -0.49% |
| August 03, 2025 | 727.70 | 0.89% |
| August 04, 2025 | 734.32 | 0.91% |
| August 05, 2025 | 736.30 | 0.27% |
| August 06, 2025 | 730.92 | -0.73% |
| August 07, 2025 | 729.90 | -0.14% |
| August 08, 2025 | 731.14 | 0.17% |
| August 09, 2025 | 731.14 | 0.00% |
| August 10, 2025 | 737.50 | 0.87% |
| August 11, 2025 | 742.15 | 0.63% |
| August 12, 2025 | 742.82 | 0.09% |
| August 13, 2025 | 736.58 | -0.84% |
| August 14, 2025 | 734.66 | -0.26% |
| August 15, 2025 | 735.91 | 0.17% |
| August 16, 2025 | 735.18 | -0.10% |
| August 17, 2025 | 732.97 | -0.30% |
Binance Coin Price Prediction 2024
After analyzing Binance Coin’s future price data for 2024, we found that the projected minimum price is $651.82, while the average and maximum prices are $760.46 and $869.10, respectively.
Our assessment of future returns based on this data suggests that BNB price prediction 2024 is relatively stable, with moderate growth expected.
The narrow price range implies that the market may not anticipate significant fluctuations in value, but there is still potential for substantial returns for those willing to take on high risks associated with investing in Binance Coin.
Nonetheless, cryptocurrency investors must be cautious and carry out thorough research before making any investment decisions in this space due to the historical volatility of cryptocurrencies and the continuously evolving market landscape.
| Month | Minimum Price | Average Price | Maximum Price |
|---|---|---|---|
| February 2024 | 314.50 | 326.59 | 339.98 |
| March 2024 | 322.99 | 335.40 | 349.16 |
| April 2024 | 331.71 | 344.46 | 358.58 |
| May 2024 | 340.67 | 353.76 | 368.26 |
| June 2024 | 349.87 | 363.31 | 378.21 |
| July 2024 | 359.32 | 373.12 | 388.42 |
| August 2024 | 369.02 | 383.20 | 398.91 |
| September 2024 | 378.98 | 393.54 | 409.68 |
| October 2024 | 389.21 | 404.17 | 420.74 |
| November 2024 | 399.72 | 415.08 | 432.10 |
| December 2024 | 410.51 | 426.29 | 443.76 |
| January 2025 | 421.60 | 437.80 | 455.75 |
January 2024: Binance Coin Price Forecast
Our team of trading experts, after thorough research and analysis, predicts a vibrant start to 2024 for Binance Coin. The January forecast shows a minimum price of $312.50, an average hovering around $318.59, and a potential peak at $327.98. This signals a robust market presence, suggesting an opportune moment for strategic investments.
BNB Price Forecast for February 2024
Delving into February’s data, Binance Coin displays promising stability. We foresee the price ranging from a minimum of $314.50 to a maximum of $326.59, with an average price settling at $339.98. This gradual increase is indicative of growing investor confidence, making it a favorable month for long-term portfolio adjustments.
March 2024: Binance Coin Price Forecast
As we approach March, Binance Coin’s trajectory continues to ascend. The minimum price is expected to be around $322.99, with an average of $335.40, and the potential to reach a maximum of $349.16. This upward trend reflects a market ripe with opportunities for both seasoned and new investors.
BNB Price Forecast for April 2024
April’s forecast for Binance Coin paints a picture of steady growth. Anticipating a minimum price of $331.71 and a maximum of $358.58, the average price is likely to hover around $344.46. This consistent increase could be a signal for investors to consider bolstering their positions in BNB.
May 2024: Binance Coin Price Forecast
Heading into May, our analysis suggests a continued positive momentum for Binance Coin. With a minimum price projection of $340.67, an average at $353.76, and a maximum reaching up to $368.26, this month might be ideal for strategizing mid-year investment goals.
BNB Price Forecast for June 2024
June’s data for Binance Coin shows no signs of slowing down. We predict a minimum price of $349.87, an average of $363.31, and a maximum that could soar up to $378.21. This robust growth trajectory indicates a healthy market environment, beneficial for diversifying investment portfolios.
July 2024: Binance Coin Price Forecast
As we enter the second half of 2024, July’s Binance Coin forecast remains optimistic. Expectations set the minimum price at $359.32, the average at $373.12, and the maximum at $388.42. This upward trend underscores the coin’s strong market performance, suggesting a favorable period for both holding and acquiring BNB.
BNB Price Forecast for August 2024
In August, Binance Coin’s growth trajectory appears unwavering. The predicted minimum price stands at $369.02, with an average of $383.20 and a maximum of $398.91. Such a steady climb indicates a resilient and thriving market, ideal for strategic investment decisions.
September 2024: Binance Coin Price Forecast
Come September, Binance Coin is poised to maintain its upward trend. The forecast suggests a minimum price of $378.98, an average of $393.54, and a maximum reaching $409.68. This consistent growth could be a great opportunity for investors looking to capitalize on the positive market sentiment.
BNB Price Forecast for October 2024
October’s forecast for Binance Coin indicates a sustained positive momentum. We expect the prices to range between a minimum of $389.21 and a maximum of $420.74, with an average around $404.17. This steady increase reflects a robust and dynamic market, ideal for thoughtful investment strategies.
November 2024: Binance Coin Price Forecast
As November rolls in, Binance Coin continues to showcase promising growth. Our experts predict a minimum price of $399.72, an average of $415.08, and a maximum peak at $432.10. This trend signifies the potential for significant returns, making it an opportune time for strategic investments in BNB.
BNB Price Forecast for December 2024
Closing the year, December’s forecast for Binance Coin remains bullish. We anticipate a minimum price of $410.51, with an average of $426.29 and a maximum potential of $443.76. This sustained growth trajectory provides a positive outlook for year-end financial planning and investment in Binance Coin.
Binance Coin Price Prediction 2025
Looking ahead to 2025, our forecast suggests another solid year for Binance Coin. The minimum price expected in our BNB price prediction 2025 is slated to be around $495.44, with a possible surge up to $699.07. The average price, interestingly, could hover around $597.25. The growth of the Binance Smart Chain might be a key influencer of these figures.
| Month | Minimum Price | Average Price | Maximum Price |
|---|---|---|---|
| February 2025 | 495.44 | 514.48 | 535.57 |
| March 2025 | 508.82 | 528.37 | 550.03 |
| April 2025 | 522.55 | 542.63 | 564.88 |
| May 2025 | 536.66 | 557.28 | 580.13 |
| June 2025 | 551.15 | 572.33 | 595.80 |
| July 2025 | 566.04 | 587.78 | 611.88 |
| August 2025 | 581.32 | 603.65 | 628.40 |
| September 2025 | 597.01 | 619.95 | 645.37 |
| October 2025 | 613.13 | 636.69 | 662.79 |
| November 2025 | 629.69 | 653.88 | 680.69 |
| December 2025 | 646.69 | 671.54 | 699.07 |
| January 2026 | 664.15 | 689.67 | 717.94 |
Binance Coin Price Prediction 2026
Our team of seasoned traders has crunched the numbers for BNB price prediction 2026. We’re looking at a price range from a low of $656.85 to a high of $926.81, with an average of around $791.83. This projection takes into account factors like market volatility and regulatory developments.
| Month | Minimum Price | Average Price | Maximum Price |
|---|---|---|---|
| February 2026 | 656.85 | 682.08 | 710.05 |
| March 2026 | 674.58 | 700.50 | 729.22 |
| April 2026 | 692.79 | 719.41 | 748.91 |
| May 2026 | 711.50 | 738.84 | 769.13 |
| June 2026 | 730.71 | 758.78 | 789.89 |
| July 2026 | 750.44 | 779.27 | 811.22 |
| August 2026 | 770.70 | 800.31 | 833.12 |
| September 2026 | 791.51 | 821.92 | 855.62 |
| October 2026 | 812.88 | 844.11 | 878.72 |
| November 2026 | 834.83 | 866.90 | 902.45 |
| December 2026 | 857.37 | 890.31 | 926.81 |
| January 2027 | 880.52 | 914.35 | 951.84 |
Binance Coin Price Prediction 2027
Scrutinizing the 2027 price forecast for Binance Coin, we’re seeing a potential minimum price of $870.84 and a maximum level of $1228.75, with the average price projected to be $1049.79. As Binance continues to innovate, these numbers could very well be in reach.
| Month | Minimum Price | Average Price | Maximum Price |
|---|---|---|---|
| February 2027 | 870.84 | 904.29 | 941.37 |
| March 2027 | 894.35 | 928.71 | 966.79 |
| April 2027 | 918.50 | 953.79 | 992.89 |
| May 2027 | 943.29 | 979.54 | 1,019.70 |
| June 2027 | 968.76 | 1,005.98 | 1,047.23 |
| July 2027 | 994.92 | 1,033.15 | 1,075.51 |
| August 2027 | 1,021.78 | 1,061.04 | 1,104.54 |
| September 2027 | 1,049.37 | 1,089.69 | 1,134.37 |
| October 2027 | 1,077.70 | 1,119.11 | 1,164.99 |
| November 2027 | 1,106.80 | 1,149.33 | 1,196.45 |
| December 2027 | 1,136.69 | 1,180.36 | 1,228.75 |
| January 2028 | 1,167.38 | 1,212.23 | 1,261.93 |
Binance Coin Price Prediction 2028
Delving into the 2028 price expectations for Binance Coin, we project a minimum price of $1154.54, an average of $1391.8, and a maximum price that could reach $1629.06. Changes in the global economic landscape could greatly influence these numbers.
| Month | Minimum Price | Average Price | Maximum Price |
|---|---|---|---|
| February 2028 | 1,154.54 | 1,198.90 | 1,248.05 |
| March 2028 | 1,185.71 | 1,231.27 | 1,281.75 |
| April 2028 | 1,217.73 | 1,264.51 | 1,316.36 |
| May 2028 | 1,250.61 | 1,298.66 | 1,351.90 |
| June 2028 | 1,284.37 | 1,333.72 | 1,388.40 |
| July 2028 | 1,319.05 | 1,369.73 | 1,425.89 |
| August 2028 | 1,354.66 | 1,406.71 | 1,464.39 |
| September 2028 | 1,391.24 | 1,444.69 | 1,503.93 |
| October 2028 | 1,428.80 | 1,483.70 | 1,544.53 |
| November 2028 | 1,467.38 | 1,523.76 | 1,586.23 |
| December 2028 | 1,507.00 | 1,564.90 | 1,629.06 |
| January 2029 | 1,547.69 | 1,607.15 | 1,673.05 |
Binance Coin Price Prediction 2029
With eyes on the horizon, we anticipate the 2029 Binance Coin price to fluctuate between $1530.67 and $2159.78, averaging around $1845.22. Binance Coin’s performance will likely be tied to the broader trends in the cryptocurrency market.
| Month | Minimum Price | Average Price | Maximum Price |
|---|---|---|---|
| February 2029 | 1,530.67 | 1,589.48 | 1,654.65 |
| March 2029 | 1,571.99 | 1,632.39 | 1,699.32 |
| April 2029 | 1,614.44 | 1,676.47 | 1,745.20 |
| May 2029 | 1,658.03 | 1,721.73 | 1,792.32 |
| June 2029 | 1,702.80 | 1,768.22 | 1,840.72 |
| July 2029 | 1,748.77 | 1,815.96 | 1,890.42 |
| August 2029 | 1,795.99 | 1,864.99 | 1,941.46 |
| September 2029 | 1,844.48 | 1,915.35 | 1,993.88 |
| October 2029 | 1,894.28 | 1,967.06 | 2,047.71 |
| November 2029 | 1,945.43 | 2,020.17 | 2,103.00 |
| December 2029 | 1,997.95 | 2,074.72 | 2,159.78 |
| January 2030 | 2,051.90 | 2,130.73 | 2,218.09 |
Binance Coin Price Prediction 2030
As we round out the decade, we’re predicting Binance Coin to maintain a strong position. The year 2030 could see a minimum price of $2029.33, an average price of $2446.36, and a maximum price of $2863.4. The continued evolution of blockchain technology will undoubtedly play a role in these numbers.
| Month | Minimum Price | Average Price | Maximum Price |
|---|---|---|---|
| February 2030 | 2,029.33 | 2,107.30 | 2,193.70 |
| March 2030 | 2,084.12 | 2,164.20 | 2,252.93 |
| April 2030 | 2,140.39 | 2,222.63 | 2,313.76 |
| May 2030 | 2,198.19 | 2,282.64 | 2,376.23 |
| June 2030 | 2,257.54 | 2,344.27 | 2,440.39 |
| July 2030 | 2,318.49 | 2,407.57 | 2,506.28 |
| August 2030 | 2,381.09 | 2,472.57 | 2,573.95 |
| September 2030 | 2,445.38 | 2,539.33 | 2,643.45 |
| October 2030 | 2,511.40 | 2,607.90 | 2,714.82 |
| November 2030 | 2,579.21 | 2,678.31 | 2,788.12 |
| December 2030 | 2,648.85 | 2,750.62 | 2,863.40 |
| January 2031 | 2,720.37 | 2,824.89 | 2,940.71 |
Binance Coin Price Prediction 2031
Moving into 2031, our analysis indicates a minimum Binance Coin price of $2690.45, an average of $3243.34, and a maximum price reaching up to $3796.24. These projections reflect both the challenges and opportunities that lie ahead in the crypto sphere.
| Month | Minimum Price | Average Price | Maximum Price |
|---|---|---|---|
| February 2031 | 2,690.45 | 2,793.82 | 2,908.37 |
| March 2031 | 2,763.09 | 2,869.25 | 2,986.89 |
| April 2031 | 2,837.69 | 2,946.72 | 3,067.54 |
| May 2031 | 2,914.31 | 3,026.28 | 3,150.36 |
| June 2031 | 2,993.00 | 3,107.99 | 3,235.42 |
| July 2031 | 3,073.81 | 3,191.91 | 3,322.78 |
| August 2031 | 3,156.80 | 3,278.09 | 3,412.49 |
| September 2031 | 3,242.04 | 3,366.60 | 3,504.63 |
| October 2031 | 3,329.57 | 3,457.50 | 3,599.26 |
| November 2031 | 3,419.47 | 3,550.85 | 3,696.44 |
| December 2031 | 3,511.79 | 3,646.72 | 3,796.24 |
| January 2032 | 3,606.61 | 3,745.19 | 3,898.74 |
Binance Coin Price Prediction 2032
As we wrap up this Binance Coin forecast, our team anticipates the 2032 Binance Coin price to range from a low of $3566.94, an average of $4299.96, to a high of $5032.98. This outlook is based on our comprehensive understanding of the crypto market trends and the potential trajectory of Binance Coin.
| Month | Minimum Price | Average Price | Maximum Price |
|---|---|---|---|
| February 2032 | 3,566.94 | 3,703.99 | 3,855.85 |
| March 2032 | 3,663.25 | 3,804.00 | 3,959.96 |
| April 2032 | 3,762.16 | 3,906.70 | 4,066.88 |
| May 2032 | 3,863.73 | 4,012.19 | 4,176.68 |
| June 2032 | 3,968.06 | 4,120.51 | 4,289.46 |
| July 2032 | 4,075.19 | 4,231.77 | 4,405.27 |
| August 2032 | 4,185.22 | 4,346.03 | 4,524.21 |
| September 2032 | 4,298.22 | 4,463.37 | 4,646.37 |
| October 2032 | 4,414.28 | 4,583.88 | 4,771.82 |
| November 2032 | 4,533.46 | 4,707.64 | 4,900.66 |
| December 2032 | 4,655.86 | 4,834.75 | 5,032.98 |
| January 2033 | 4,781.57 | 4,965.29 | 5,168.87 |
The Main Questions Of Critical Thinking When We Talk About Binance Coin Price Forecast
Critical thinking questions are designed to engage deeper thought and understanding about the future price of Binance Coin.
Below are three critical thinking questions to deepen your own research and understanding of the price of BNB and the other factors influencing it:
- What factors could significantly impact bullish and bearish opinions on Binance Coin’s future price?
- How could changes in regulatory environment affect Binance Coin’s future price?
- How can market analysis tools help in forming an opinion about Binance Coin’s future price?
I hope this deep dive into each question helps you think critically about the future price of Binance Coin. Remember, the crypto market is highly volatile and unpredictable, so it’s always important to do your own research and consider multiple perspectives.
Binance Coin (BNB) Price Predictions by Experts
When it comes to Binance Coin price forecasts, it’s always fascinating to hear the perspectives of well-known financial experts and crypto experts too.
- Wallet Investor: Based on Wallet Investor’s BNB price prediction, this token is a good long-term investment. By 2024 year-end, they predict that the price may reach around $391. While, in 5 years, the price may have reached $612.
- DigitalCoinPrice: DigitalCoinPrice’s BNB price prediction for 2024 suggests the minimum price of BNB may trade around $289.13, with a potential high of $710.21 by December 2024.
- Gov Capital: BNB price prediction of GOV Capital suggests that the maximum trading price may reach 778.05 by 2024 year-end and $1014.70 by 2027 year-end.
- TradingBeasts: According to TradingBeasts, the BNB price is forecasted to reach $276.845 by the beginning of June 2024. The expected maximum price is $346.057, minimum price is $235.319.
Decoding the Charts for BNB Price Prediction: Technical Price Analysis
The realm of cryptocurrencies is vast and ever-evolving, and with the consistent rise of Binance Coin (BNB), technical price analysis has never been more crucial. In this section, we will delve into the world of BNB price prediction and the significant role technical indicators play in the financial market.
Technical analysis is a method used by traders and investors to forecast the price movements of financial assets, such as stocks, commodities, or cryptocurrencies, by analyzing historical price data and patterns.
Unlike fundamental analysis, which focuses on the intrinsic value of an asset, technical analysis is based on the assumption that historical price movements can provide insights into future price behavior.
Here are some key concepts and tools used in technical analysis:
- Price charts: Technical analysts use various types of price charts, such as line charts, bar charts, and candlestick charts, to visualize historical price data and identify patterns or trends.
- Trend analysis: Identifying the overall trend is a critical aspect of technical analysis. Traders look for uptrends (a series of higher highs and higher lows) or downtrends (a series of lower highs and lower lows) to determine the market’s direction.
- Support and resistance levels: Support levels are price points where an asset’s price has historically had difficulty falling below, while resistance levels are points where the price has had difficulty rising above. These levels can help traders identify potential entry and exit points for trades.
- Technical indicators: Technical analysts use various mathematical indicators to gain insights into market trends and momentum. Some common indicators include moving averages, (RSI), moving average convergence divergence (MACD), and Bollinger Bands.
- Chart patterns: Technical analysts look for specific chart patterns that may suggest price movements. Examples of chart patterns include head and shoulders, double tops and bottoms, triangles, and flags.
- Volume analysis: Analyzing trade volume can provide insights into the strength or weakness of price movements. High volume during a price increase can signal strong buying interest, while low volume during a price decline may indicate weak selling pressure.
- Timeframes: Technical analysts can apply their methods to various timeframes, from intraday charts to weekly or monthly charts, depending on their trading style and objectives.
Technical Analysis: Navigating the World of Binance Coin’s Price Prediction
Technical analysis, a critical tool in the financial market, is used to forecast future price movements based on past market data, primarily price, and volume. When it comes to Binance Coin, technical analysis can help traders and investors make informed decisions.
Binance Coin, like other cryptocurrencies, exhibits price patterns and trends that can be identified and leveraged for profitable trading and investment opportunities. From the basic support and resistance levels to more complex chart patterns, BNB price chart offers a wealth of information for those who can decode it.
Technical Indicators: Origin and Purpose for Binance Coin’s Price Prediction
Technical indicators are crucial components of technical analysis. They’re mathematical calculations derived from a security’s price, volume, or open interest, and they’re used to forecast future price changes. Technical indicators have been around for centuries, dating back to Japanese candlestick charts, but their utilization exploded with the advent of digital technology and the ability to analyze vast amounts of data quickly.
The purpose of technical analysis is to identify patterns and trends in the market, as well as potential buying and selling opportunities. Technical analysis is based on the idea that historical price and volume data can help predict future price movements.
The Role of Technical Indicators in Financial Markets
In the broader financial markets, technical indicators serve as a compass guiding traders through the tumultuous seas of market volatility. They provide a systematic way to assess market conditions and forecast potential price movements.
Moreover, they help reduce the inherent subjectivity and emotional biases in trading, enabling traders to make more objective and data-driven decisions. While no single technical indicator guarantees success, a well-chosen combination can significantly enhance a trader’s ability to navigate the financial markets, including the dynamic world of Binance Coin.
There are many technical indicators used in crypto trading to predict the price movements of different cryptocurrencies. Here are some of the most popular technical indicators for predicting Binance Coin price:
- Moving Averages (MAs)
- Relative Strength Index (RSI)
- Moving Average Convergence Divergence (MACD)
- Bollinger Bands
- Stochastic Oscillator
- Parabolic SAR (Stop and Reverse)
- Ichimoku Cloud
- Fibonacci Retracement
- Average Directional Index (ADX)
- On Balance Volume (OBV)
- Rate of Change (ROC)
- Commodity Channel Index (CCI)
- Accumulation/Distribution Line (A/D Line)
- Pivot Points
- Chaikin Money Flow (CMF)
- Aroon Indicator
- Gann Fan
- Keltner Channel
- Money Flow Index (MFI)
- TRIX
- The Zig Zag indicator
- Detrended Price Oscillator (DPO)
- Vortex Indicator (VI)
- Elder’s Force Index (EFI)
- Williams %R
I know how important it is to have a solid understanding of the most common technical indicators used for both crypto prices and predicting BNB worth.
In this section, I’ll share with you the essential indicators that I’ve found particularly helpful in my own trade journey, and I’ll provide real-life examples of how to apply them to Binance Coin prediction.
Moving Averages (MAs) – Can We Make BNB Price Forecast?
Moving Averages (MAs) are like the calm observers of the market, smoothing out the often erratic price data to reveal an underlying trend. Various types of MAs exist, such as the Simple Moving Average (SMA) and the Exponential Moving Average (EMA), each with their own strengths.
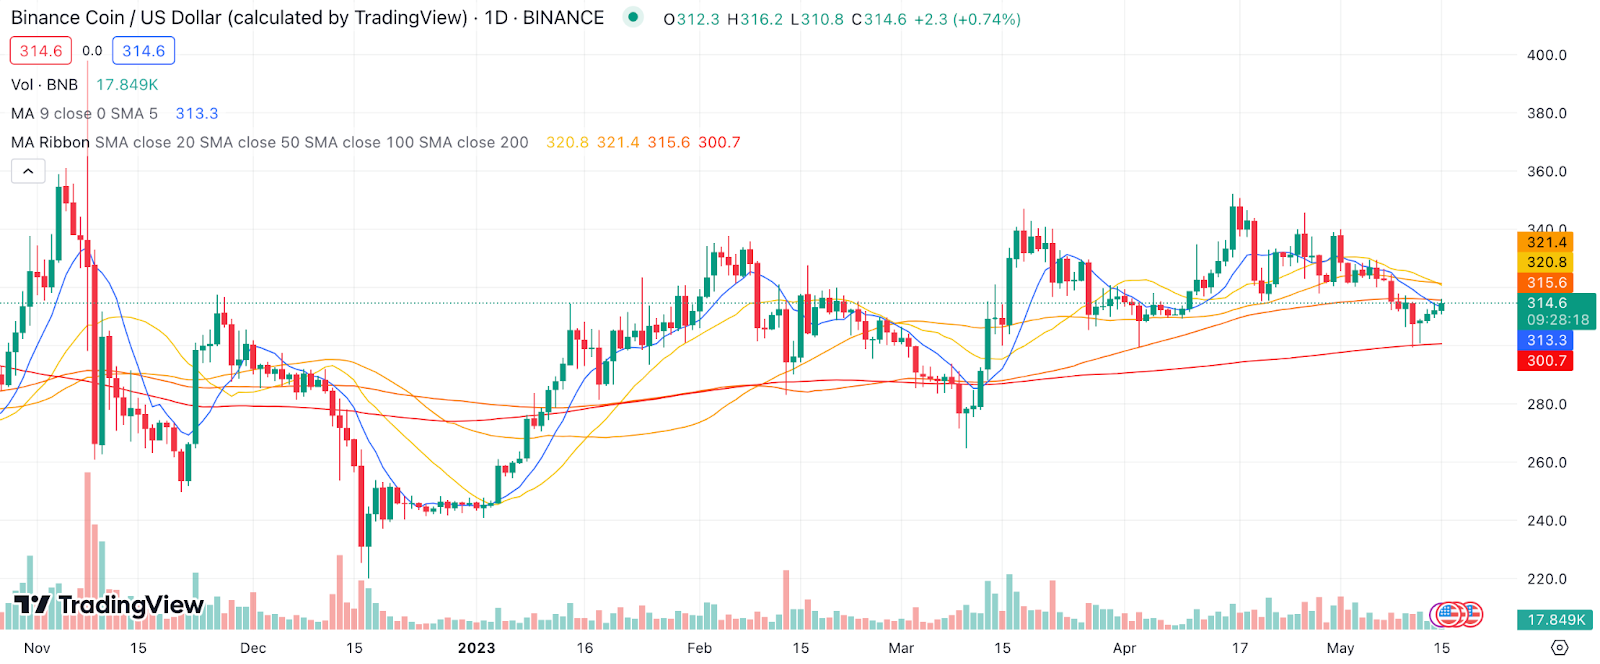
Example: In the context of BNB, if we see the 50-day EMA (which responds more quickly to price changes) cross above the 200-day EMA (which is slower and therefore represents a more long-term trend), this can be viewed as a bullish signal. This crossover might suggest a potential uptrend in BNB price, which could be a cue for investors and traders to consider entering a long position.
Relative Strength Index (RSI) – Binance Coin (BNB) Price Prediction
The RSI is a momentum indicator that compares the magnitude of recent gains to recent losses in an attempt to determine overbought and oversold conditions of an asset. The RSI ranges from 0 to 100 and is typically considered overbought when above 70 and oversold when below 30.
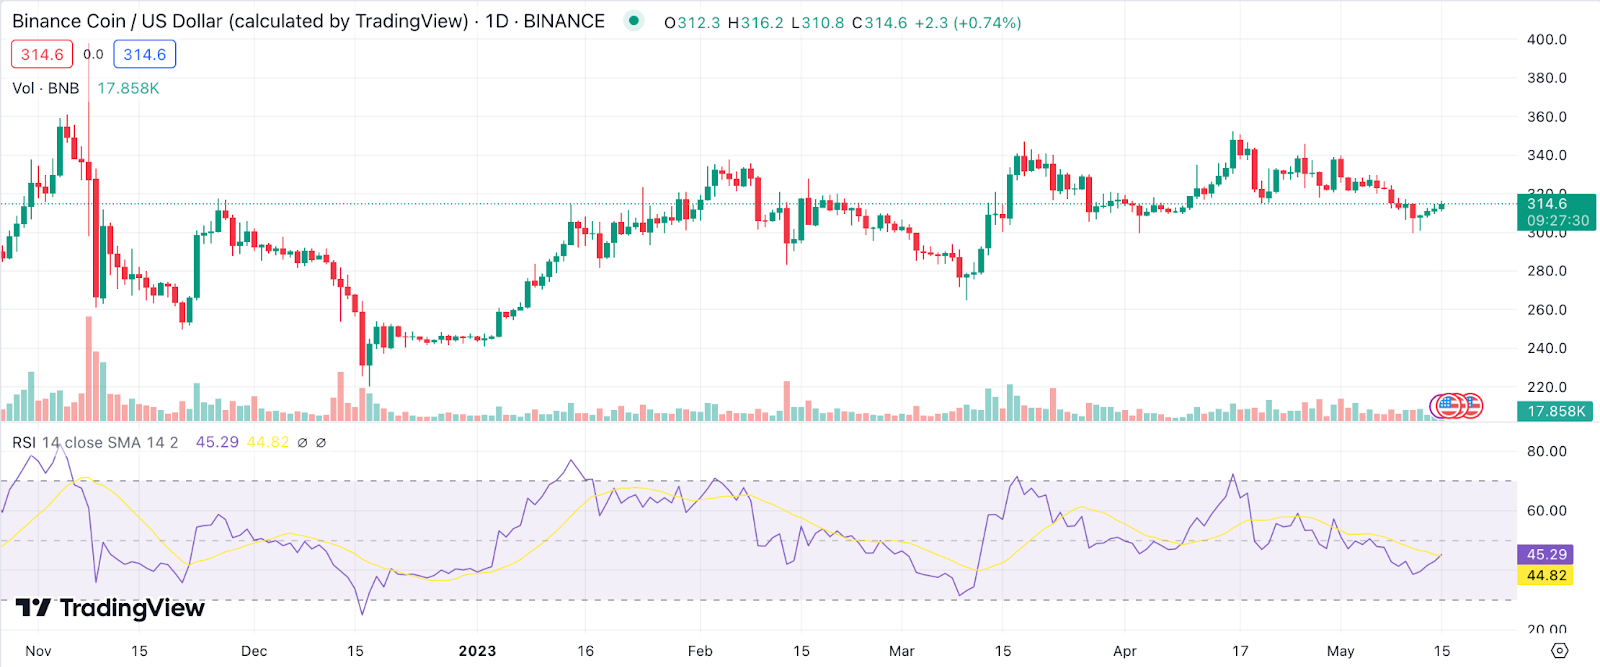
Example: When the RSI of BNB crosses above 70, it’s an indication that the coin might be overbought, suggesting that the bullish momentum could be overextended, and a price correction or reversal might be on the horizon. Conversely, if BNB’s RSI dips below 30, it implies that the coin may be oversold, and a bullish reversal could be imminent.
Moving Average Convergence Divergence (MACD) – Binance Coin (BNB) Price Prediction
The MACD is a trend-following momentum indicator that reveals the relationship between two moving averages of a security’s price. The MACD line (the difference between a 12-period EMA and a 26-period EMA), the signal line (a 9-period EMA of the MACD line), and the histogram (the difference between the MACD line and the signal line) make up the MACD.

Example: When the MACD line crosses above the signal line, it produces a bullish signal, which suggests it might be an optimal time to buy Binance Coin. On the other hand, when the MACD line crosses below the signal line, it generates a bearish signal, implying it might be an ideal time to sell BNB.
Bollinger Bands for Binance Coin Price Prediction
Bollinger Bands are a unique tool that adapts to market volatility. Named after their creator, John Bollinger, these bands comprise a middle band (a 20-day SMA) and two outer bands that are two standard deviations away from the middle band. These bands expand and contract with volatility.
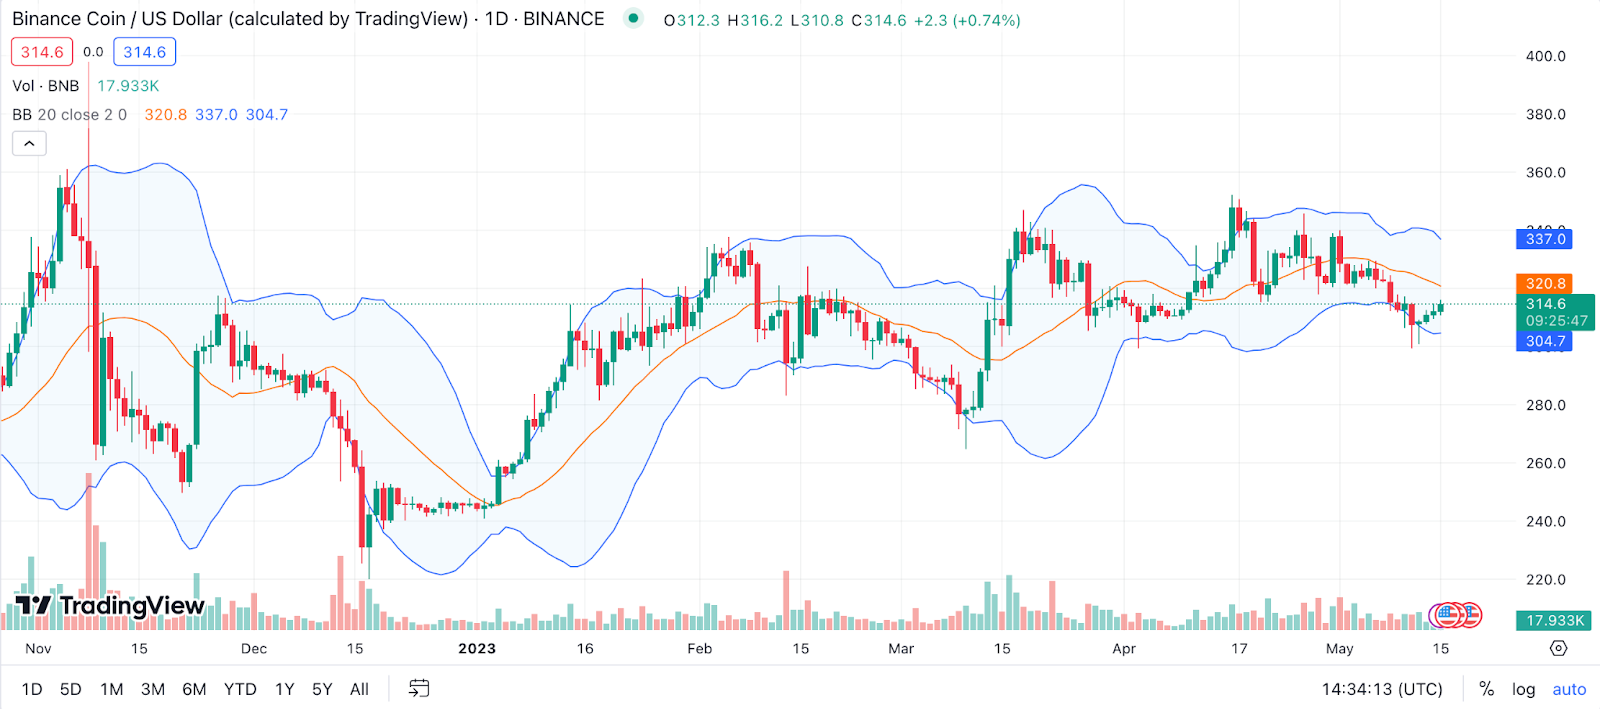
Example: In a period of increasing BNB price volatility, the bands widen, and when the volatility decreases, the bands contract. When the BNB price hits the upper band, it might signal an overbought condition, implying a potential pullback. Conversely, if the BNB price touches the lower band, it could indicate an oversold condition, suggesting a possible rally.
Stochastic Oscillator for Binance Coin Price Prediction
The Stochastic Oscillator is a two-line momentum indicator that compares the closing price of BNB to its price range over a specific period. It provides readings between 0 and 100.
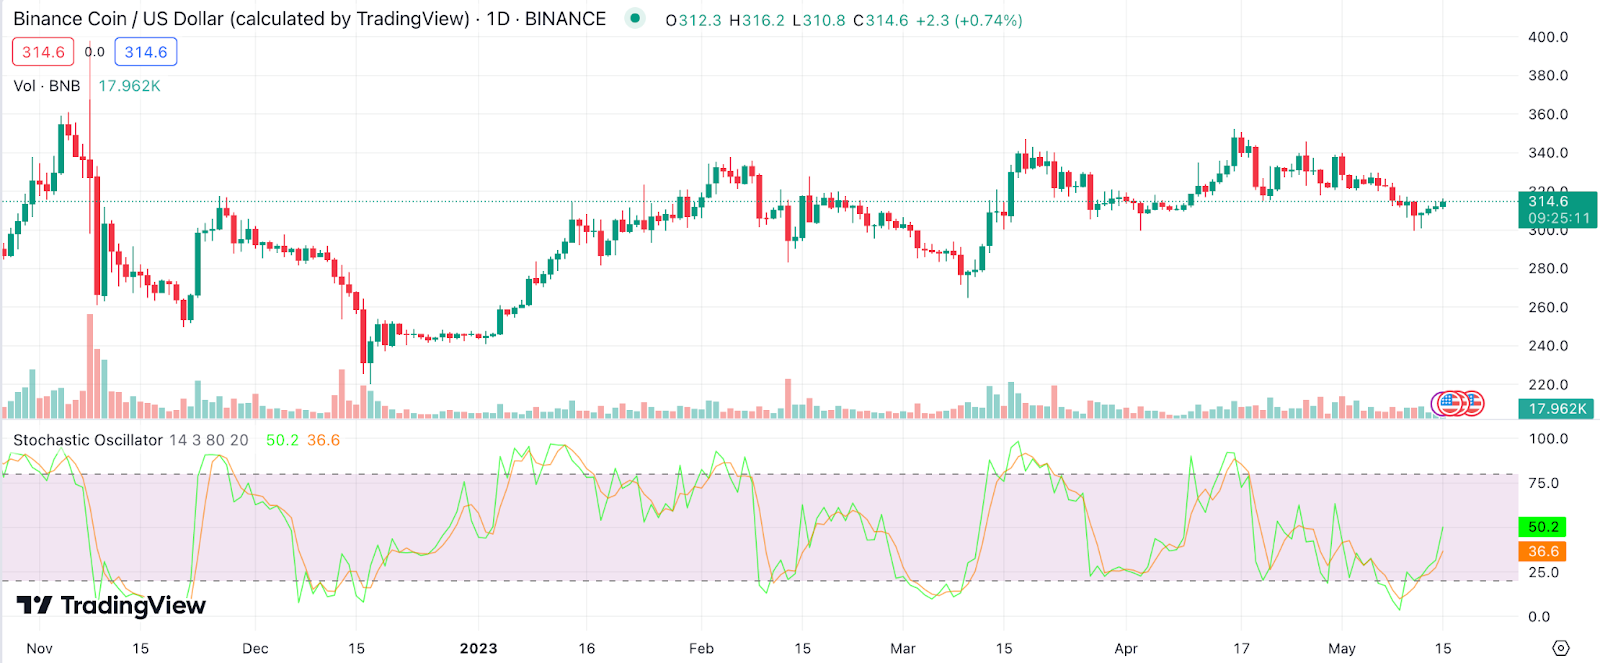
Example: Generally, a reading above 80 indicates that BNB might be overbought and due for a price drop, while a reading below 20 suggests that BNB may be oversold and due for a price rise. Traders often use this tool to identify potential price reversals, providing them with advantageous trading opportunities.
Parabolic SAR (Stop and Reverse) for Binance Coin Price Prediction
The Parabolic SAR is a tool that provides potential entry and exit points. It places dots on the chart to indicate the direction of BNB price movement.
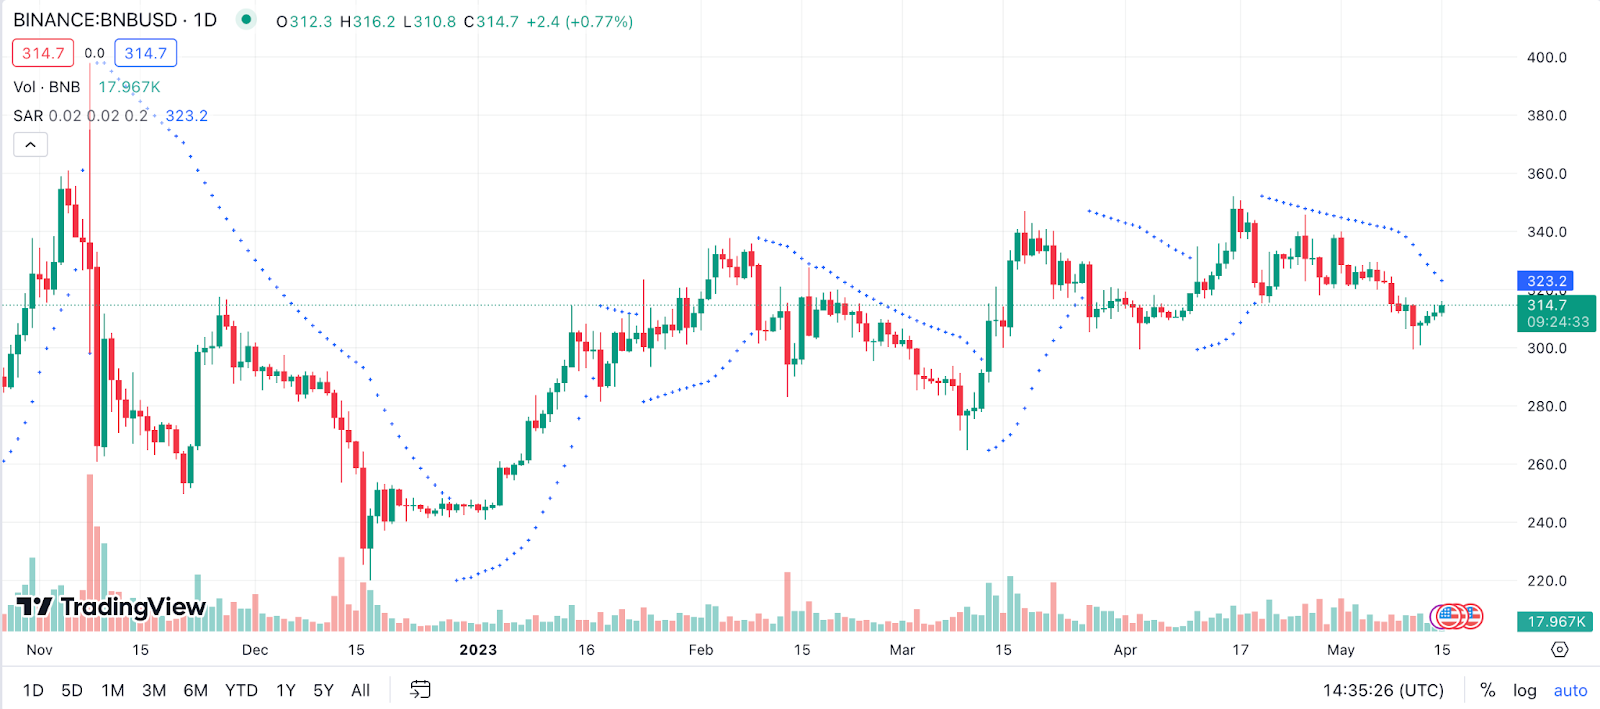
Example: If the dots are below the current Binance Coin price, it suggests an uptrend, and when the dots are above the price, it indicates a downtrend. Traders often use the Parabolic SAR to set stop-loss levels as the SAR dots can give an idea of where to place them. When the dots flip, it can signal a potential trend reversal, suggesting a trader should exit or enter a new position in BNB.
Ichimoku Cloud for Binance Coin Price Prediction
The Ichimoku Cloud, also known as Ichimoku Kinko Hyo, is a comprehensive indicator that provides information about support and resistance levels, direction of the trend, and momentum. It includes five lines: Tenkan-sen (Conversion Line), Kijun-sen (Base Line), Senkou Span A (Leading Span A), Senkou Span B (Leading Span B), and Chikou Span (Lagging Span). The space between Senkou Span A and B forms what is known as the ‘cloud.’

Example: When BNB’s price is above the cloud, it suggests a bullish trend, and when it’s below the cloud, it indicates a bearish trend. If BNB price is inside the cloud, it signals a potential trend reversal or market indecision.
Fibonacci Retracement for Binance Coin Price Prediction
Fibonacci retracement is a popular tool among traders which is used to identify potential support and resistance levels. These levels are based on Fibonacci numbers, a sequence where each number after the first two is the sum of the two preceding ones.

Example: When applied to BNB’s price chart, Fibonacci retracement levels can help identify possible reversal points. For instance, if BNB price increases rapidly, traders might look for a retracement to a certain percentage (commonly 38.2%, 50%, or 61.8%) of the original move before the uptrend continues.
Average Directional Index (ADX) for Binance Coin Price Prediction
The Average Directional Index (ADX) is a technical indicator that measures the strength of a security’s trend. The ADX ranges from 0 to 100, with a reading above 25 indicating a strong trend and a reading below 20 indicating a weak trend.
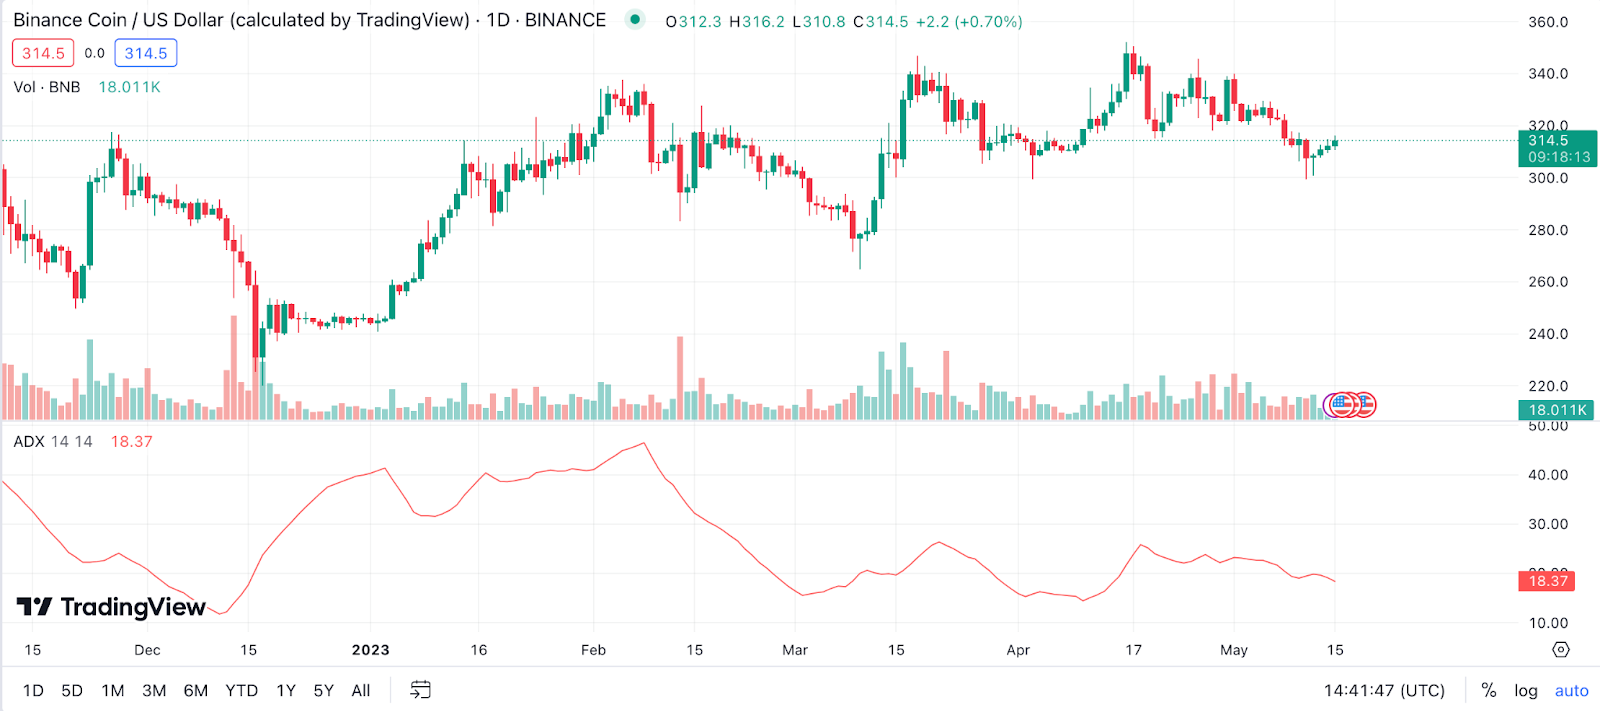
Example: If BNB price has been trending upward strongly and the ADX value is above 25, it indicates a strong bullish trend. If the ADX value is below 20, it suggests that the BNB price trend is weak or that the market is ranging.
On Balance Volume (OBV) for Binance Coin Price Prediction
On Balance Volume is a momentum indicator that uses volume flow to predict changes in the price of a coin. It measures buying and selling pressure as a cumulative indicator, adding volume on up days and subtracting it on down days.
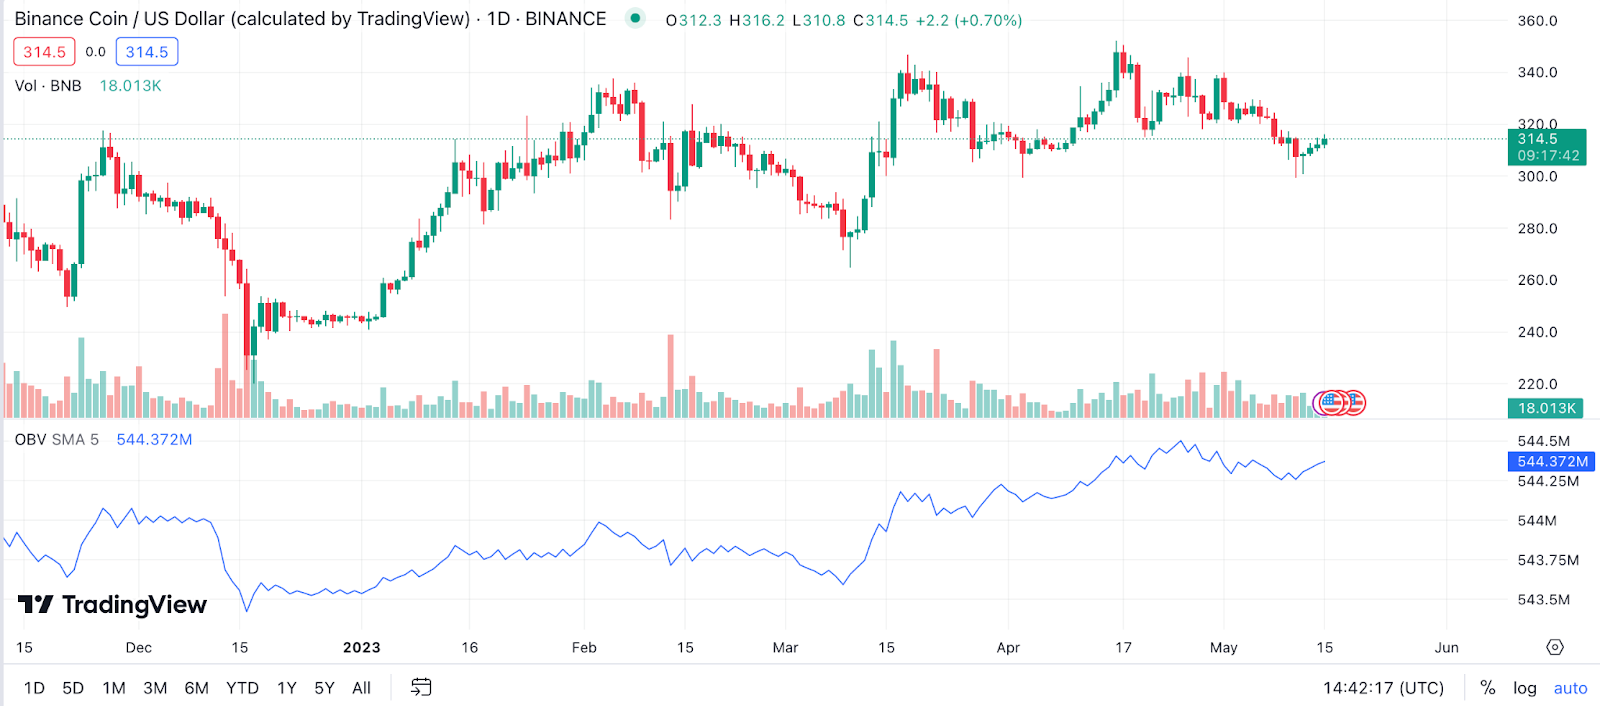
Example: Suppose the BNB price closes higher than the previous day’s close. In that case, all of the day’s volume is considered up-volume, and it is added to the previous day’s OBV total. If the closing price is below the previous day’s close, all of the day’s volume is considered down-volume and is subtracted from the OBV total.
Rate of Change (ROC) for Binance Coin Price Prediction
The Rate of Change (ROC) is a momentum oscillator that measures the percentage change in price from one period to the next. The ROC calculation compares the current Binance Coin price with the price ‘n’ periods ago. The plot forms an oscillator that fluctuates above and below the zero line as the Rate of Change moves from positive to negative. If ROC is rising, it gives a bullish signal, while a falling ROC gives a bearish signal
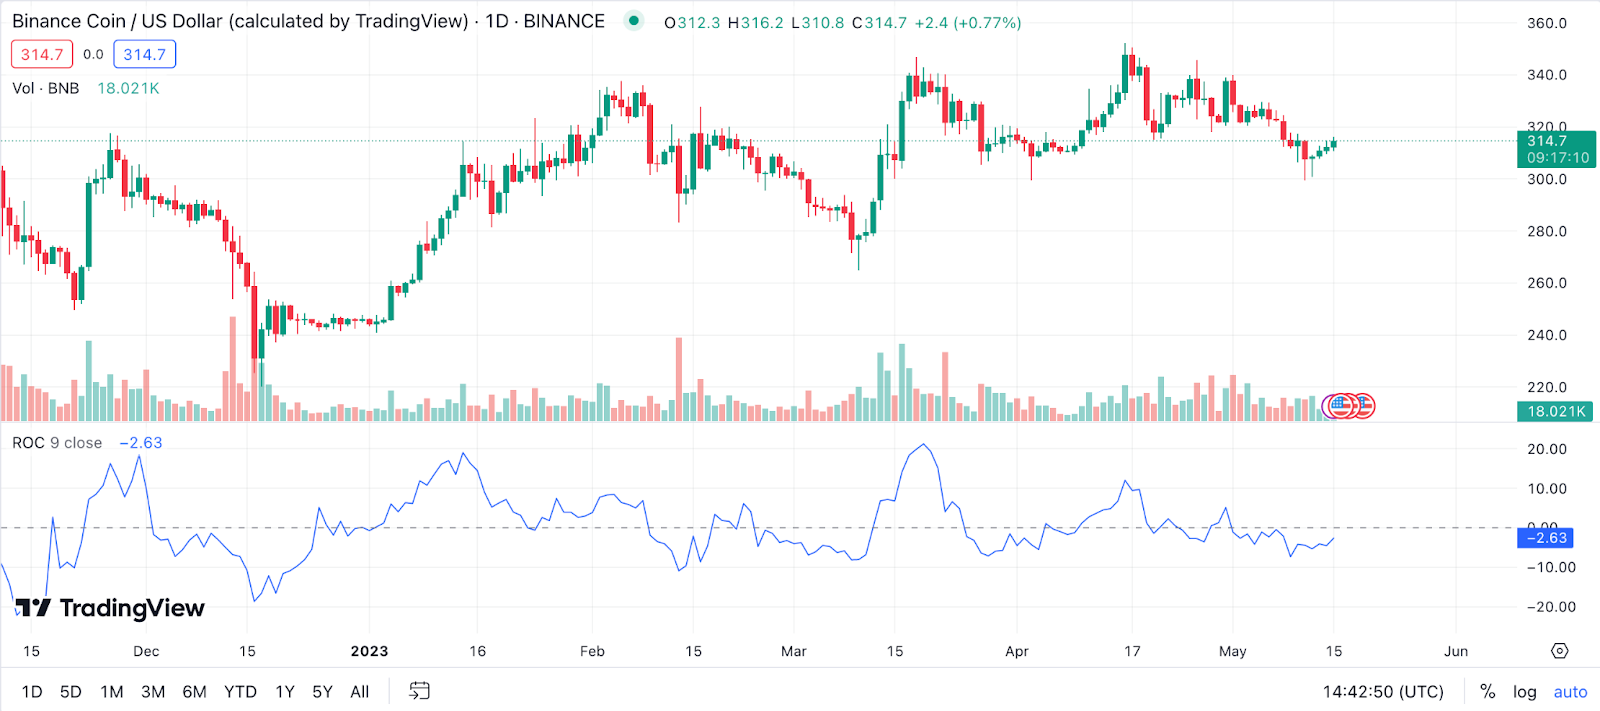
Example: For BNB, if the ROC is rising, it suggests that the price is gaining momentum and it might be a good time to buy. Conversely, if the ROC is falling, it indicates that the price is losing momentum, and it might be a good time to sell.
Commodity Channel Index (CCI) for Binance Coin Price Prediction
The Commodity Channel Index (CCI) is a versatile indicator that can be used to identify a new trend or warn of extreme conditions. CCI measures a security’s variation from the statistical mean. The CCI is calculated as the difference between the typical price of a commodity and its simple moving average, divided by the mean absolute deviation of the typical price.
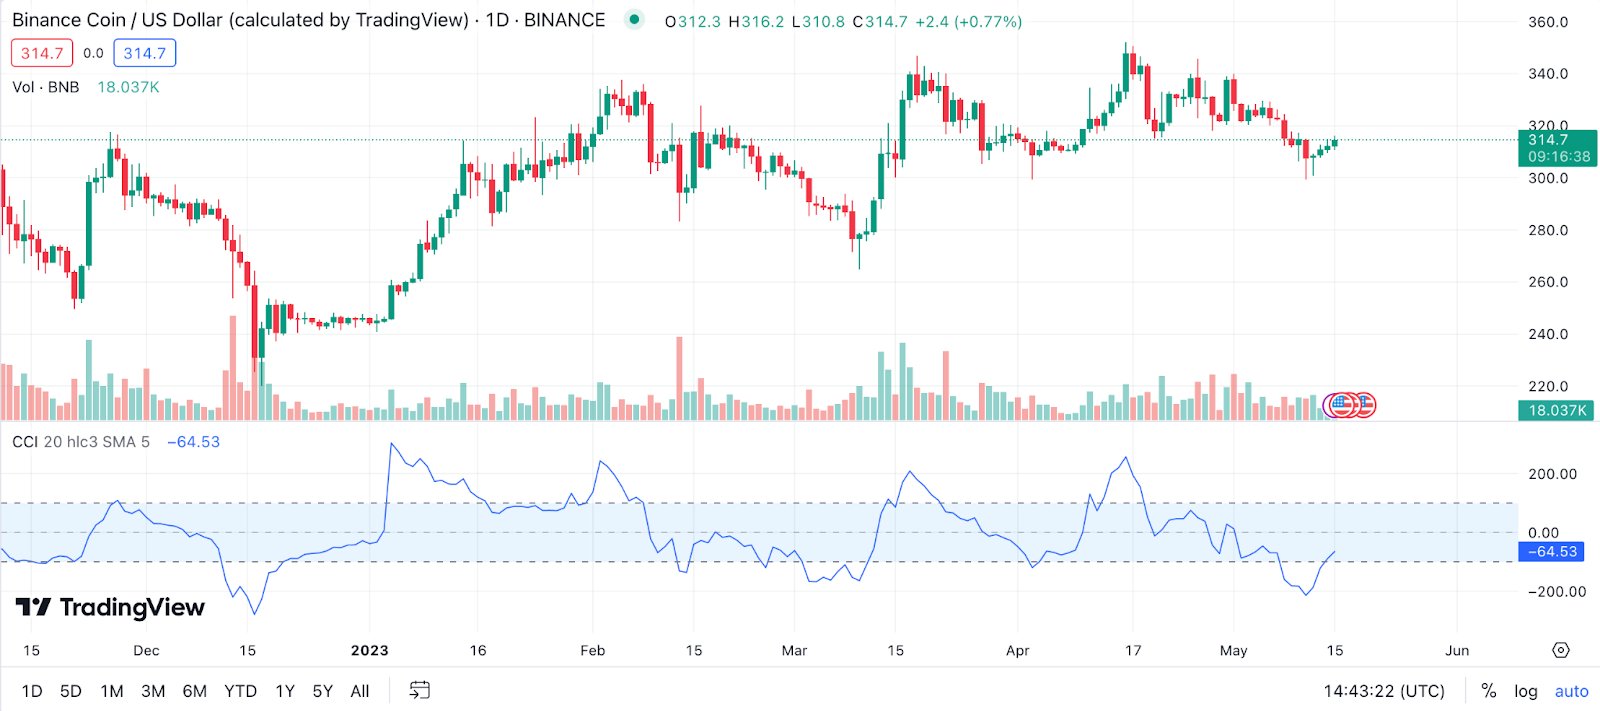
Example: For BNB, a CCI value above 100 signifies that the price is well above the average price and hence overbought. Conversely, a CCI value below -100 indicates that the price is well below the average price and hence oversold.
Accumulation/Distribution Line (A/D Line) for Binance Coin Price Prediction
The Accumulation/Distribution Line (A/D Line) is a volume-based indicator designed to measure the cumulative flow of money into and out of a security. It was developed by Marc Chaikin, who dubbed it the Cumulative Money Flow Line. The A/D line is derived by comparing the close of a security to its high-low range and then correlating the result with the volume.
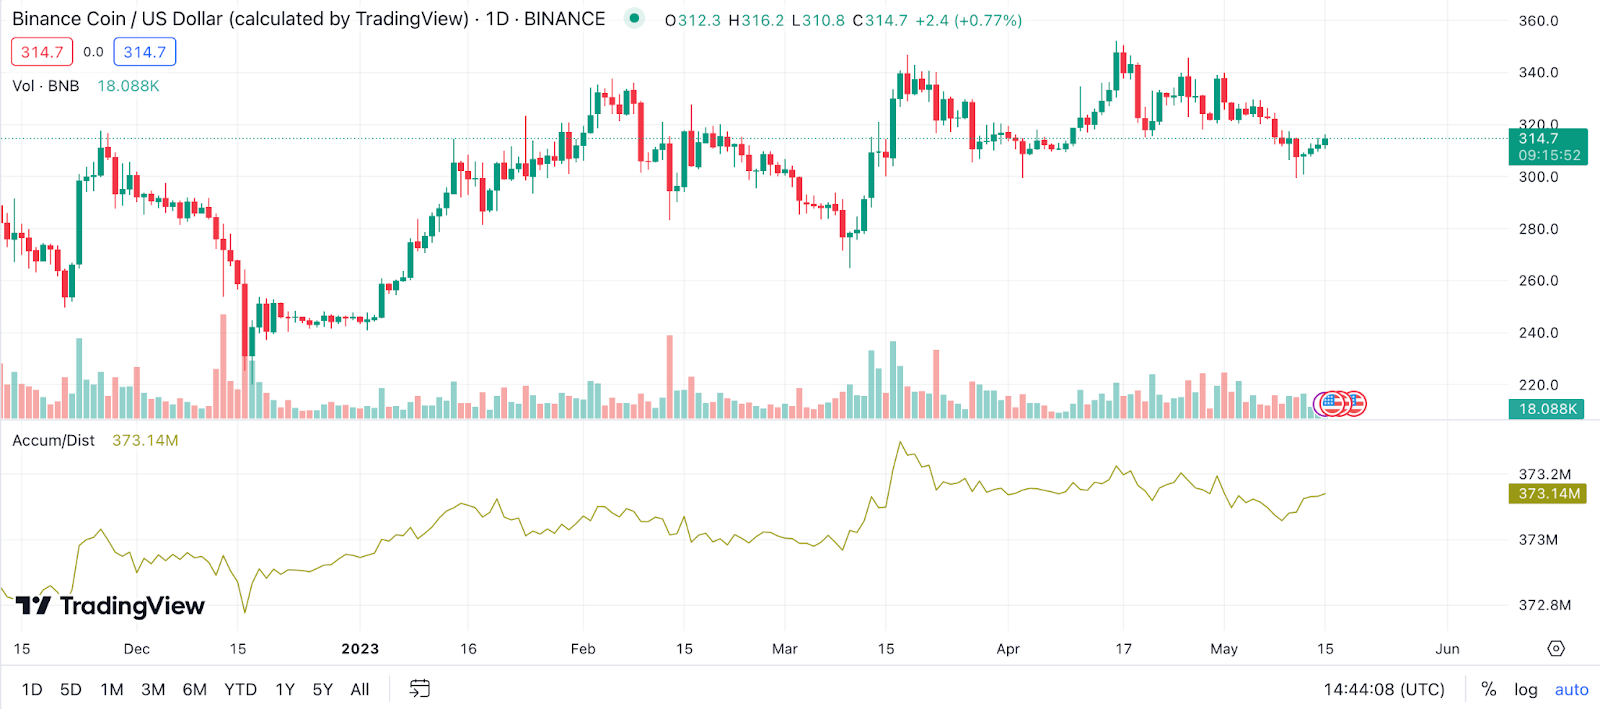
Example: If the close is above the midpoint of the high-low range, then there is accumulation. Conversely, if it is below the midpoint, there is distribution. For BNB, if the A/D line is rising, it suggests that money is flowing into BNB, which could lead to a price increase. On the other hand, if the line is falling, money is flowing out of BNB, which could result in a price decrease.
Pivot Points for Binance Coin Price Prediction
Pivot Points are significant support and resistance levels that can be used to determine directional movements and potential reversal points in the market. They are calculated using the open, high, low, and close of the previous trading day.
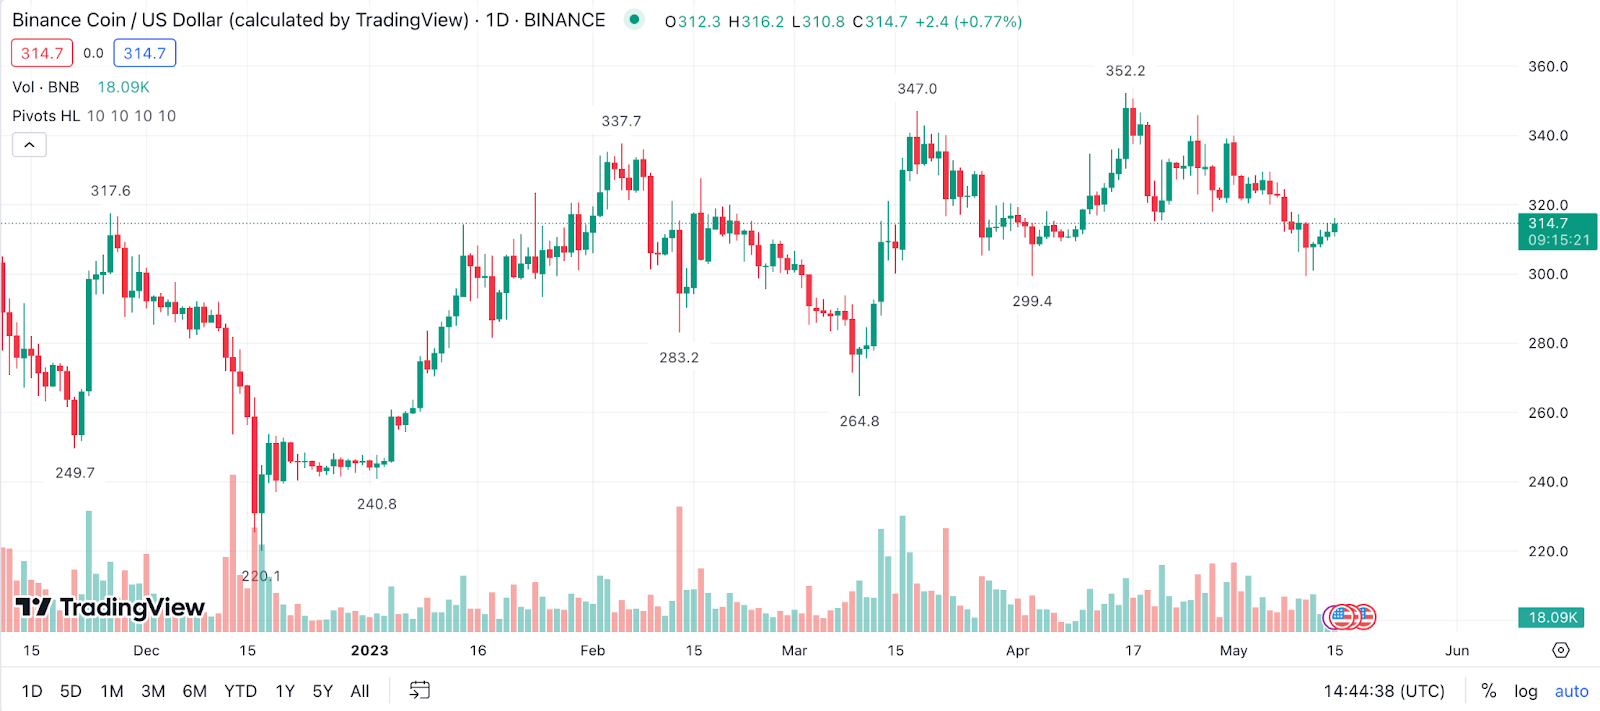
Example: For BNB, if the price is above the pivot point, it could indicate bullish sentiment, and it might be a good time to buy. Conversely, if the price is below the pivot point, it might indicate bearish sentiment and could be a good time to sell.
Chaikin Money Flow (CMF) for Binance Coin Price Prediction
Chaikin Money Flow (CMF) is another indicator developed by Marc Chaikin. It is designed to measure the amount of Money Flow Volume over a specific period. Money Flow Volume forms the basis for the Accumulation Distribution Line. Instead of a cumulative total of Money Flow Volume, CMF sums Money Flow Volume for a specific look-back period.
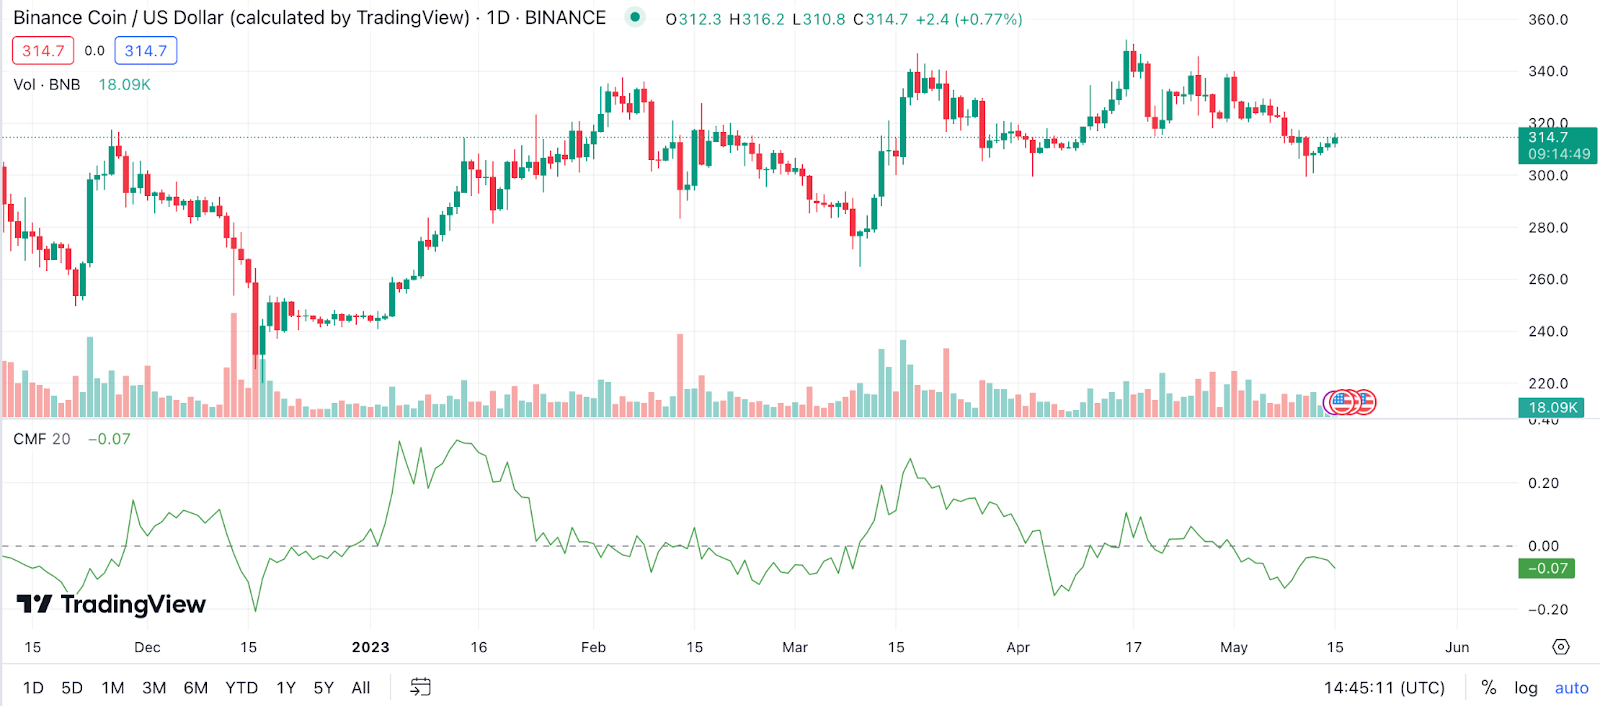
Example: For BNB, a bullish signal is given when CMF is positive – this occurs when the 20-day EMA of BNB is greater than the volume-weighted closing price. Conversely, a bearish signal is given when the CMF is negative.
Aroon Indicator for Binance Coin Price Prediction
The Aroon Indicator, developed by Tushar Chande, is a system that determines whether a coin is in a trend, and how significant that trend is. It consists of two lines: an ‘Aroon up’ line which measures the strength of the uptrend, and an “Aroon down” line which measures the strength of the downtrend.

Example: For BNB, if the Aroon up line is above the Aroon down line, it indicates a bullish trend. Conversely, if the Aroon down line is above the Aroon up line, it indicates a bearish trend. When both lines are roughly equal, it indicates a possible trend change or a sideways movement.
Gann Fan for Binance Coin Price Prediction
Gann Fan is a technical analysis tool based on the theories of W.D. Gann, a famous trader and analyst. The Gann Fan consists of a series of diagonal lines drawn from a significant high or low point on the price chart. These lines represent potential support and resistance levels and can help traders identify trend direction and potential reversal points.
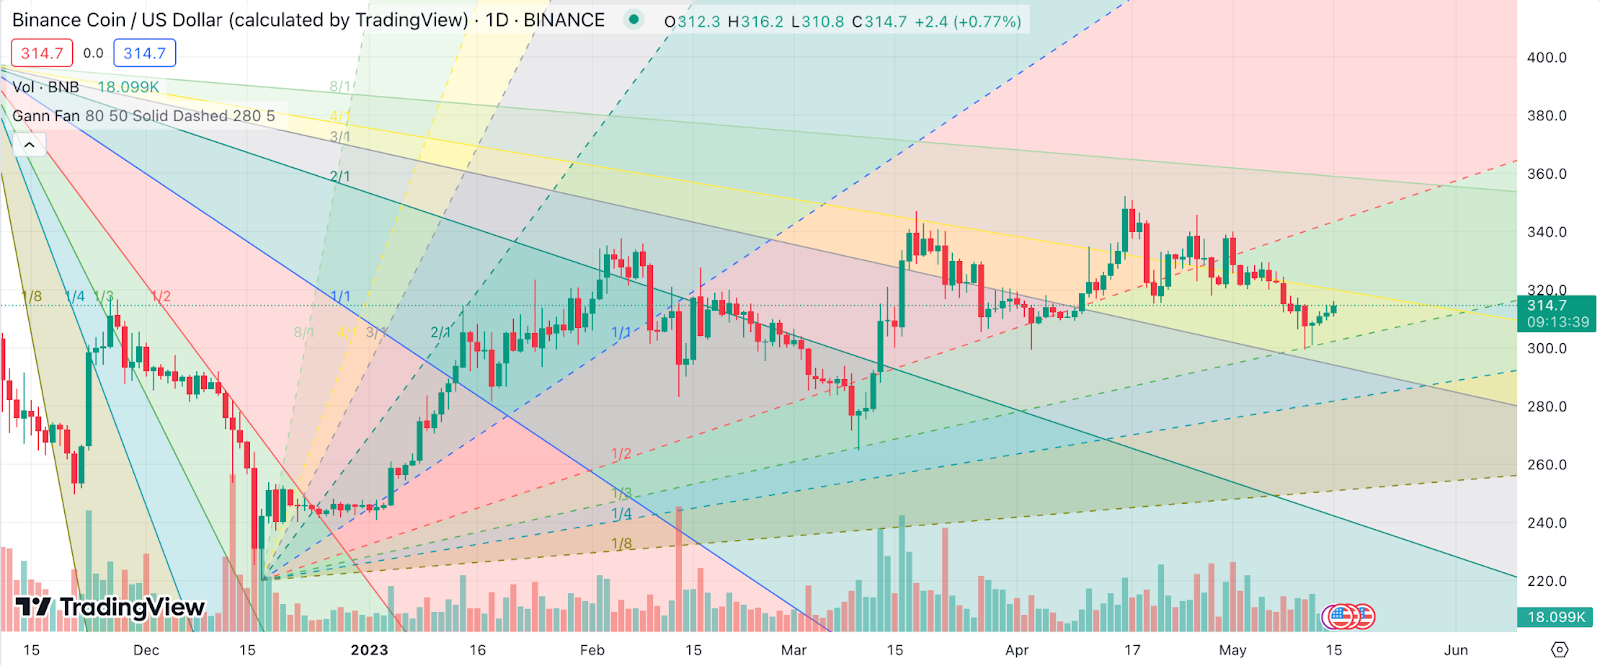
Example: For BNB, a Gann fan could be drawn from a significant peak or trough and the resulting angled lines can help identify potential future price levels of support or resistance. If BNB price stays above a Gann angle, this indicates a strong uptrend, while if it falls below an angle, it indicates a strong downtrend.
Keltner Channel for Binance Coin Price Prediction
Keltner Channels is a popular technical analysis tool that traders use to find potential buy and sell signals. They’re based on the average true range (ATR), which measures how much BNB price moves over a certain period. The upper band is calculated by adding a multiple of the ATR to the moving average, and the lower band is calculated by subtracting a multiple of the ATR from the moving average.
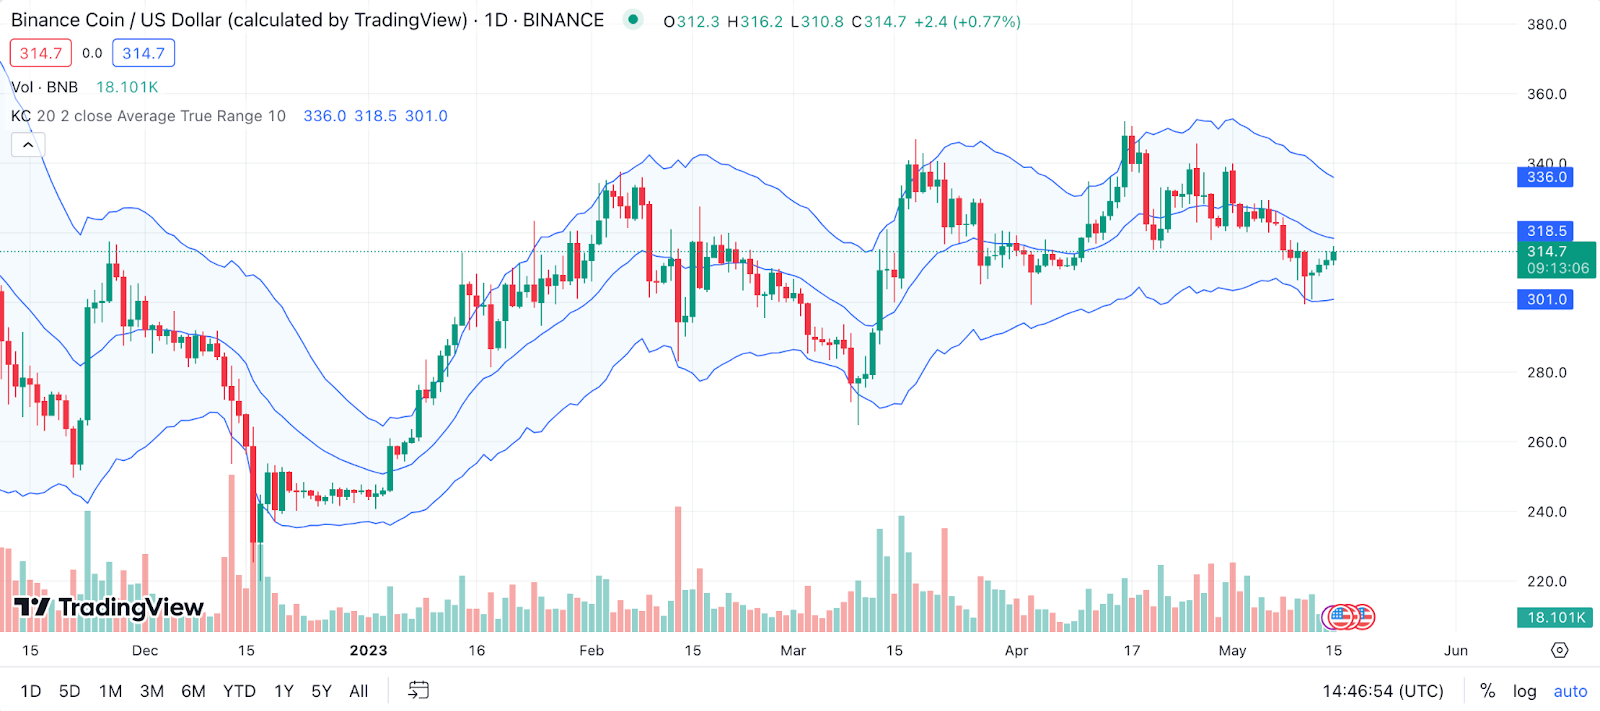
Example: For BNB, if the price breaks out above the upper band, it might be a good time to sell, whereas if the price falls below the lower band, it could be a good time to buy.
Money Flow Index (MFI) for Binance Coin Price Prediction
The Money Flow Index (MFI) is a momentum indicator that uses both price and volume data to identify overbought or oversold conditions in an asset. It’s often referred to as the volume-weighted RSI as it incorporates volume, unlike the traditional Relative Strength Index.
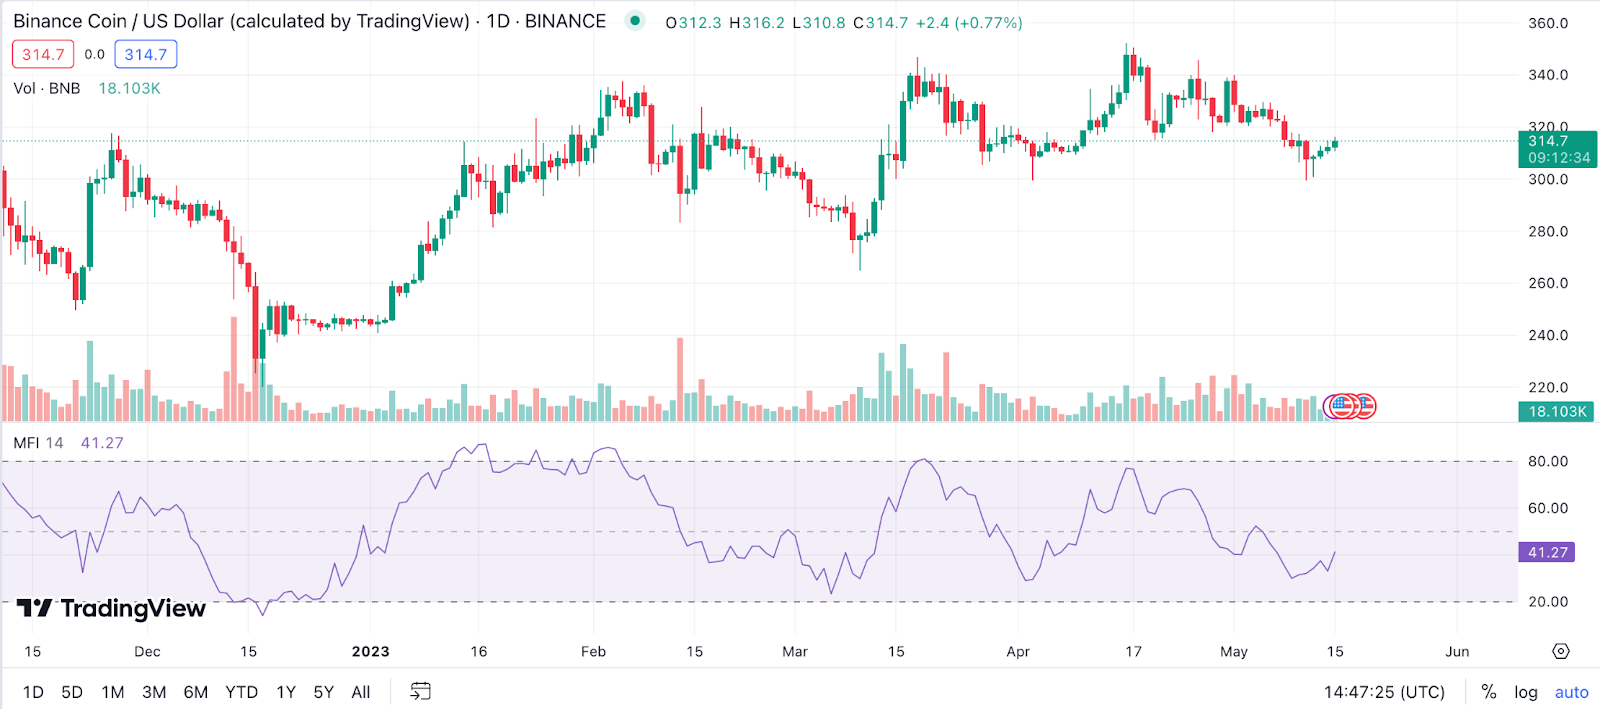
Example: When analyzing BNB, an MFI above 80 is typically considered overbought (indicating that the coin might be overvalued and due for a price downturn), while an MFI below 20 is usually considered oversold (signaling that the coin could be undervalued and due for a price upswing).
TRIX for Binance Coin Price Prediction
TRIX is a momentum oscillator that measures the percentage rate of change of a triple exponentially smoothed moving average of an asset’s price. It helps traders identify potential trend reversals and confirm existing trends. A positive TRIX value indicates upward momentum, while a negative TRIX value suggests downward momentum.
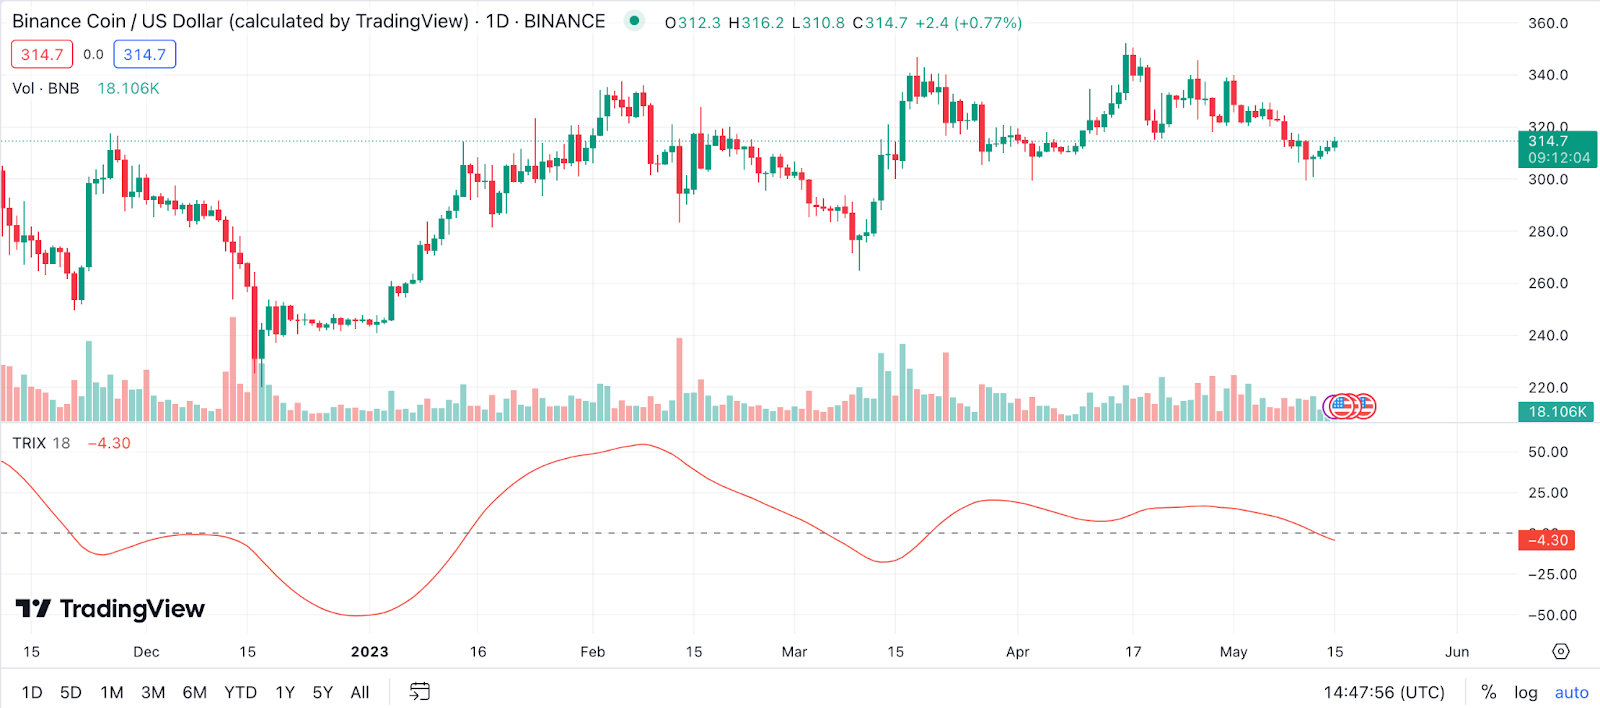
Example: TRIX is designed to keep ahead of price movements in the BNB market. It does this by identifying oversold and overbought conditions for BNB. A bullish signal for BNB is given when the TRIX crosses above the zero line, while a bearish signal is given when it crosses below the zero line.
The Zig Zag Indicator for Binance Coin Price Prediction
The Zig Zag indicator is a simple tool that attempts to identify price trends, support and resistance areas, and classic chart patterns like head and shoulders, double tops and bottoms, etc. The Zig Zag lines simply react when prices move a certain percentage.
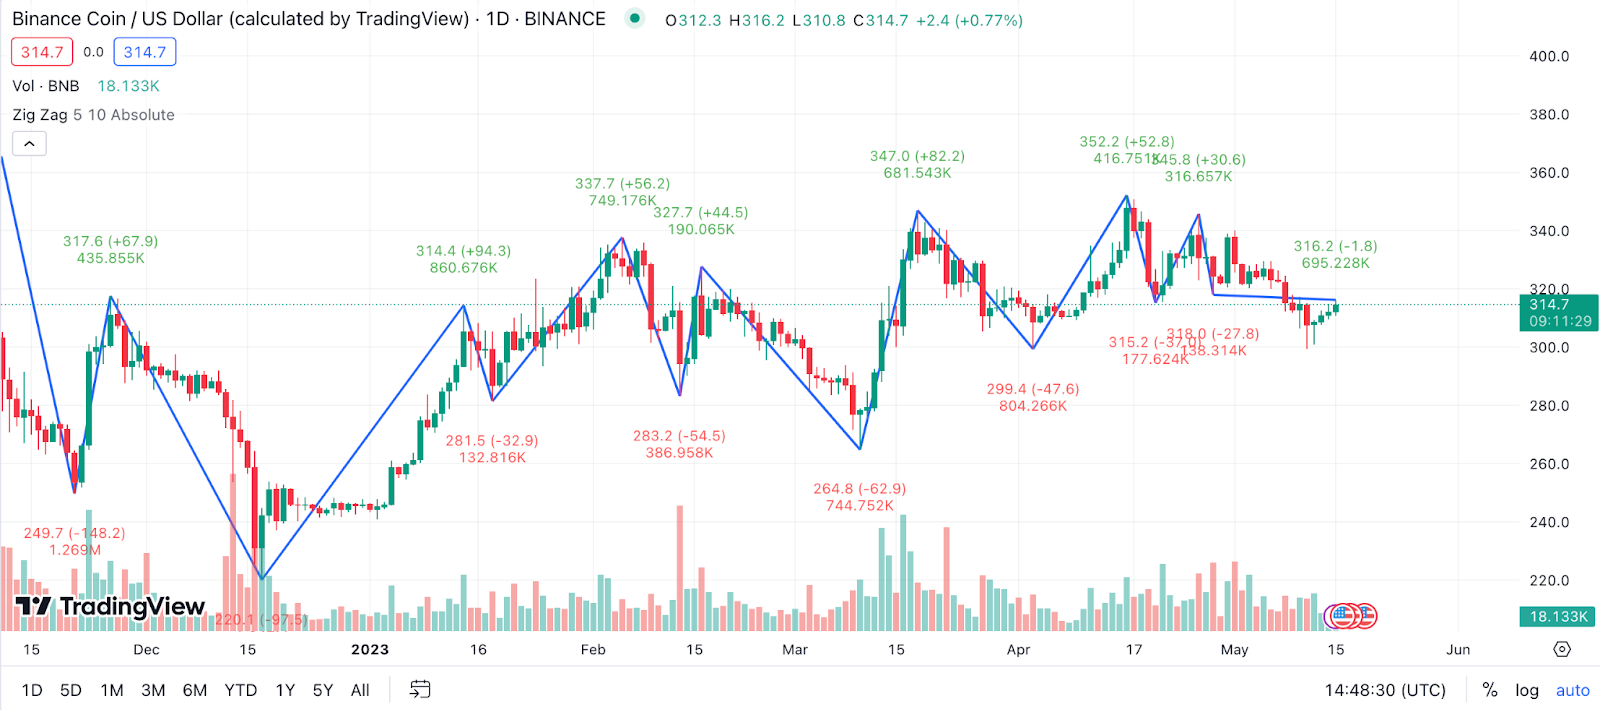
Example: For BNB, suppose you set the Zig Zag parameter to 5. The Zig Zag line will not draw a new line unless BNB price moves 5% or more from the previous swing high or low.
Detrended Price Oscillator (DPO) for Binance Coin Price Prediction
The Detrended Price Oscillator (DPO) is an indicator that helps identify cycles and overbought or oversold conditions by removing the trend from the price data. DPO is calculated by subtracting a moving average from the price and helps to identify short-term price cycles while filtering out long-term trends.
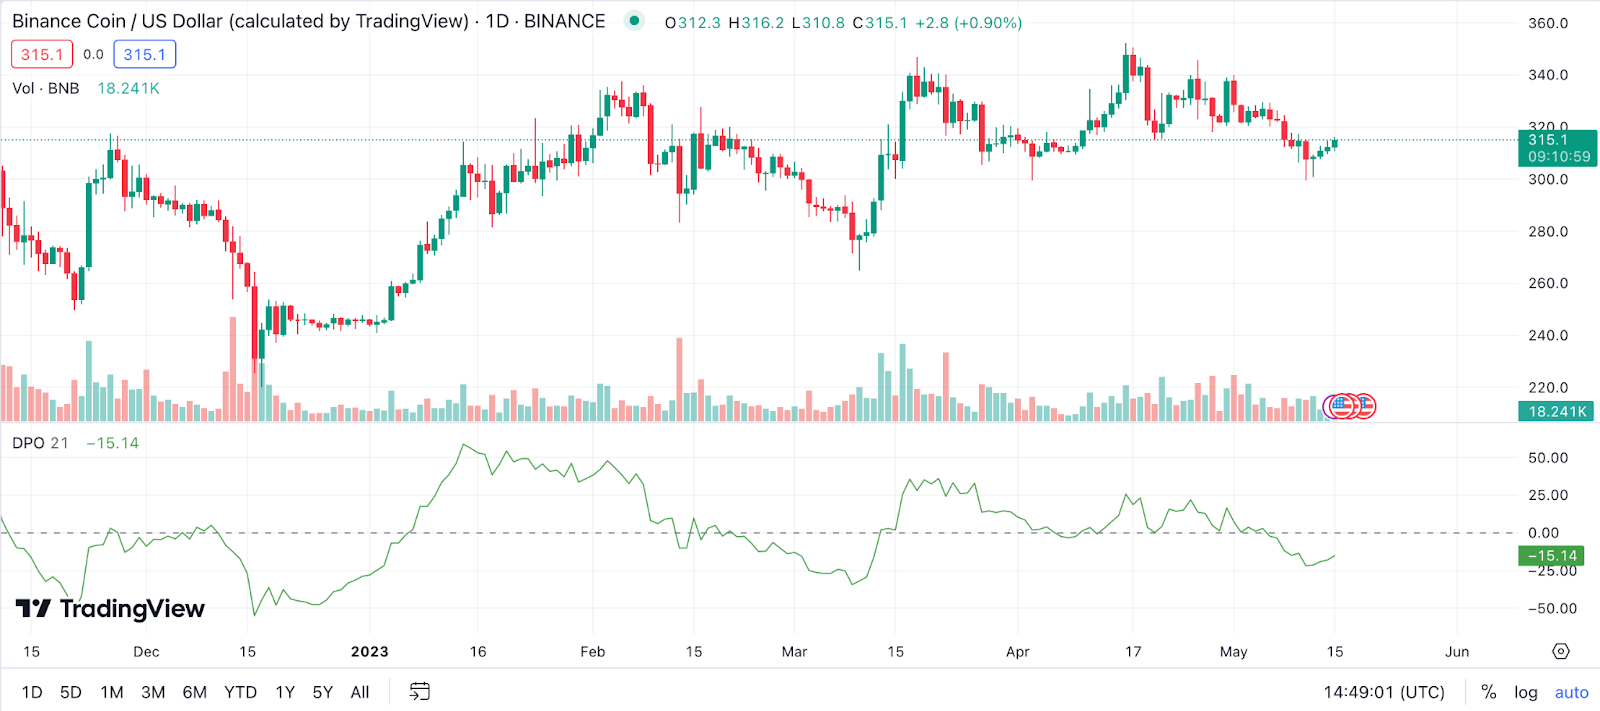
Example: In BNB’s context, a DPO might be used to identify a cycle’s high/low or to estimate the length of a cycle. If we see BNB’s price above the DPO line, it may suggest the market is overbought, and a price correction may follow. Conversely, if the BNB price is below the DPO line, it could indicate an oversold market with a potential price increase on the horizon.
Vortex Indicator (VI) for Binance Coin Price Prediction
The Vortex Indicator (VI) is an indicator designed to identify the start of a new trend and subsequently affirm said trend, correlating the relationship between high, low, and closing rates of BNB. The bullish signal is given when the positive VI line crosses the negative VI line from below, and a bearish signal is given when the positive VI line crosses the negative VI line from above.

Example: In the case of BNB, if the VI rises and is above 1.0, it might signal a bullish trend, while a falling VI below 1.0 may suggest a bearish trend.
Elder’s Force Index (EFI) for Binance Coin Price Prediction
Elder’s Force Index (EFI) measures the power behind a movement using price and volume. The EFI is an oscillator that fluctuates above and below zero, providing insight into the strength of buying and selling pressure.
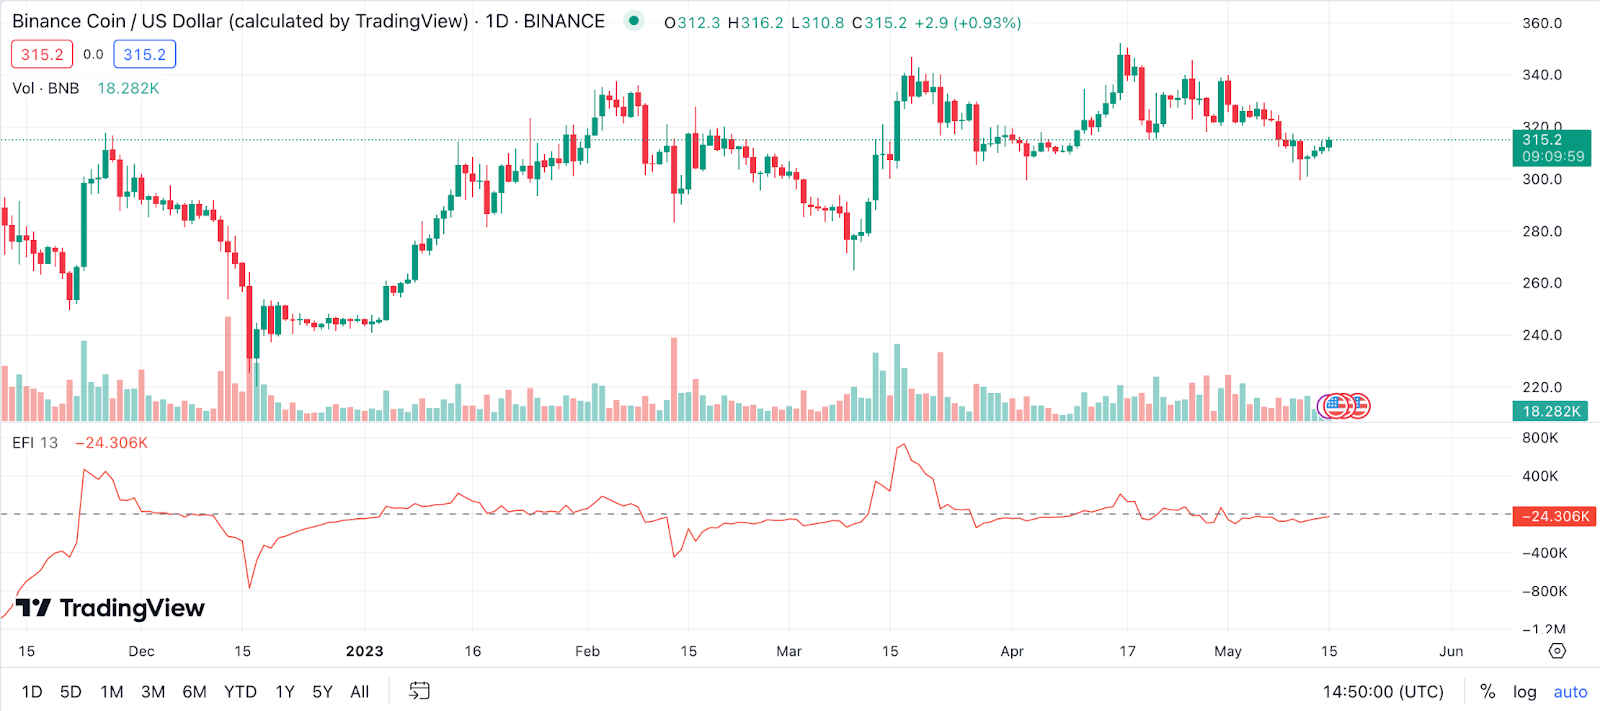
Example: If BNB’s price is moving upwards and EFI is positive, it indicates bullish momentum. Traders may watch for the EFI to cross above zero to buy BNB. Conversely, if the EFI is negative while BNB price is falling, it signals bearish momentum.
Williams %R for Binance Coin Price Prediction
Williams %R, or just %R, is a technical analysis oscillator showing the current closing price in relation to the high and low of the past N days (usually 14). The values range from -100 (lowest) up to 0 (highest), a level above -20 is generally considered overbought, and a level below -80 is considered oversold.
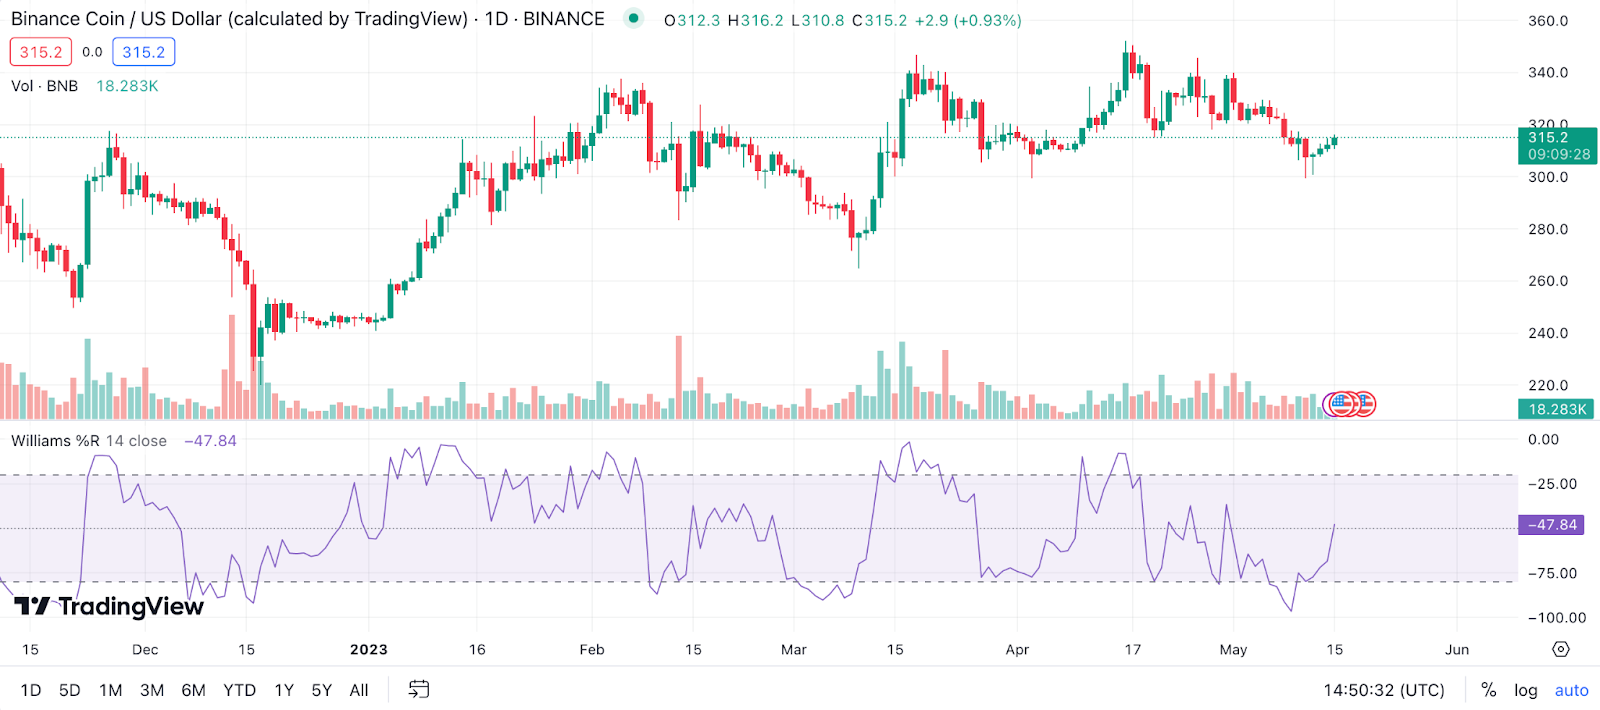
Example: For Binance Coin forecast, if the indicator is at -10, for instance, it means that BNB’s closing price is near its 14-day high, signaling overbought conditions and potential price correction. Conversely, if the indicator is at -90, BNB’s closing price is near its 14-day low, signaling oversold conditions and a potential price increase.
Combining Technical Indicators for Accurate Binance Coin Price Prediction
In the world of crypto trading, the application of a single technical indicator is often not enough to make sound investment decisions. To enhance the accuracy of your predictions and add depth to your analysis, it’s essential to consider combining various indicators.
The Importance of Using Multiple Technical Indicators for Binance Coin Price Prediction
Using multiple technical indicators provides a more holistic view of market conditions. Each indicator has its strengths and weaknesses, and they tend to excel in different market conditions. For instance, moving averages might provide good signals during trending markets but perform poorly in range-bound markets. By using a combination of indicators, you can help mitigate these weaknesses and increase your analysis’s accuracy.
To illustrate, let’s take Binance Coin (BNB). Suppose you notice that the RSI indicates an overbought condition. While this might be a sign to sell, if the moving averages indicate a strong upward trend, it might be better to wait for a confirmation of a trend reversal before making a move. In this way, using multiple indicators can help validate your trading decisions and reduce the risk of false signals.
How to Combine Various Indicators for a Comprehensive Analysis of Binance Coin Price
When combining various indicators for a comprehensive analysis of Binance Coin’s price, there are several points to consider. Here are some useful tips:
- Use indicators from different categories: Technical indicators can be broadly categorized into trend indicators, momentum indicators, volatility indicators, and volume indicators. Using indicators from different categories can provide insights into different aspects of the market.
- Avoid redundancy: While using multiple indicators is beneficial, you should avoid using indicators that provide the same information. For example, using both RSI and Stochastic Oscillator, which are both momentum indicators, may not provide additional value.
- Look for confirmation: Use one indicator to confirm the signal given by another. This can help to reduce the risk of false signals and increase the reliability of your analysis.
- Understand the limitations: No indicator is perfect, and they all have their limitations. Be aware of these limitations and avoid relying on them blindly.
- Backtest your strategy: Before using a combination of indicators in live trading, backtest your strategy on historical data to see how it would have performed in the past.
By combining multiple indicators, you can gain a more complete understanding of Binance Coin’s price movements and make more informed trading decisions.
The Pillars of Binance Coin (BNB) Price Prediction: Fundamental Factors
The fundamental analysis of a cryptocurrency like Binance Coin (BNB) is a method of evaluating its intrinsic value by examining related economic, financial, and other qualitative and quantitative factors. Below are some key aspects to consider when performing a fundamental analysis of BNB.
Adoption Rate
The adoption rate of Binance Coin (BNB) is an integral factor to consider when making BNB price predictions. Cryptocurrency adoption, in essence, refers to the extent to which a particular digital currency is accepted and used in real-world transactions, integrated into financial systems, or utilized in the development of new blockchain technologies. The higher the adoption rate, the more likely it is that the demand for the currency will rise, potentially leading to an increase in price.
Here are some key metrics to look at when evaluating Binance Coin’s adoption rate:
- Number of Wallets Holding BNB: This metric provides a direct insight into the number of users who are investing in and holding BNB. A steady increase in the number of wallets holding BNB could indicate growing trust in the coin’s value and its potential for future growth.
- Transaction Volume: High transaction volume is typically indicative of a high level of activity and usage. It could also suggest that the coin is being widely accepted and used for transactions, which is a positive sign of increasing adoption.
- Partnerships: The number of businesses or services accepting BNB as payment or integrating it into their systems can significantly influence the adoption rate. A surge in partnerships can indicate wider acceptance and could potentially drive up the demand for BNB.
- Integration in DeFi: BNB’s integration in DeFi platforms for staking, yield farming, or as collateral for loans can be a strong indicator of its value and acceptance within the DeFi ecosystem. The more integrated BNB is within DeFi, the more likely it is to see increased adoption.
- Usage on Binance Smart Chain: The extent of BNB’s usage as gas for executing smart contracts on Binance Smart Chain can indicate its value within this blockchain. Higher usage can suggest increasing adoption of BNB and the Binance Smart Chain.
- Activity on Social Media and Online Forums: The level of activity and discussion about BNB on platforms like Twitter or Reddit can indicate increasing interest and potential adoption. An uptick in social media activity can often precede an increase in adoption.
Therefore, the adoption rate of Binance Coin can significantly impact its price. It’s therefore essential for potential investors or traders to closely monitor these key adoption metrics to make informed decisions about Binance Coin.
Regulatory Developments
Regulations across different countries can significantly impact the price of Binance Coin (BNB) and cryptocurrencies in general. Regulatory changes can affect the ease of doing business, investment opportunities, and the overall perception of cryptocurrencies.
Here are several examples of regulatory changes and their impact on Binance Coin:
- Ban on Cryptocurrencies: Certain countries like China have outright banned cryptocurrencies, which affects the local demand for BNB and can lead to price fluctuations.
- Regulation of Cryptocurrency Exchanges: Binance, the issuer of BNB, operates one of the largest cryptocurrency exchanges globally. Stringent regulations or punitive measures against cryptocurrency exchanges can impact the operation of Binance, thus affecting BNB price. For instance, in 2021, Binance faced regulatory scrutiny from multiple jurisdictions, including the UK, Japan, and Canada, which led to a short-term price drop of BNB.
- Tax Laws: Changes in tax laws related to cryptocurrency can impact investor behavior. For example, if a country introduces high taxes on cryptocurrency profits, it could discourage investment in BNB, potentially leading to a decrease in price.
- Anti-Money Laundering (AML) and Know Your Customer (KYC) Regulations: Stricter AML and KYC regulations can impact the ease of buying and selling BNB, which can influence its price. Increased regulation can provide more security for investors but might also limit the accessibility of cryptocurrencies.
- Securities Regulations: If a regulatory body, like the U.S. Securities and Exchange Commission (SEC), were to classify BNB as a security, it could dramatically impact its availability and price. This scenario has played out with other tokens like XRP, which faced legal action from the SEC.
- Legal Recognition of Cryptocurrencies: Some countries, like El Salvador, have legally recognized Bitcoin as a currency. If more countries were to follow suit with cryptocurrencies, including BNB, it could potentially drive up the price by increasing demand.
- Regulatory Clarity: Positive regulatory clarity can lead to an increase in institutional investment, which can drive up the price of BNB. On the other hand, regulatory uncertainty can have the opposite effect.
Keep in mind that while regulations can significantly impact Binance Coin’s price, they are only one of many factors influencing its value.
Utility
The real-world use cases of Binance Coin (BNB) are expansive, demonstrating the cryptocurrency’s integration into existing financial systems and its potential to address specific problems. Analyzing the current and potential utility of Binance Coin can provide valuable insights into its future price trajectory. Here are some of the noteworthy use cases:
- Exchange Utility Token: BNB was originally created as the native token of the Binance exchange. It is used to pay for transaction fees on the platform, with Binance offering discounts to those who use BNB for this purpose.
- Payment Method: BNB is accepted as a form of payment by various online and physical stores. For instance, it’s used to pay for travel accommodations on platforms like Travala.com. Furthermore, Binance Pay, a contactless, borderless, and secure cryptocurrency payment technology, accepts BNB, increasing its use as a payment method.
- Participation in Token Sales: Binance Launchpad, the token launch platform of Binance, enables users to participate in token sales using BNB.
- Staking and Yield Farming: BNB can be staked on various DeFi platforms to earn interest. It’s also used for yield farming on platforms like PancakeSwap, which is built on Binance Smart Chain.
- Binance Smart Chain (BSC): BNB is used as the native gas fee token on the Binance Smart Chain, a blockchain platform developed by Binance for creating decentralized applications (DApps). It allows for faster and cheaper transactions than many other major blockchain platforms, which has led to a significant increase in BNB’s use and value.
- NFT Marketplace: Binance has entered the non-fungible tokens (NFT) market, and BNB can be used to create, buy, and sell NFTs on their platform.
- Decentralized Finance (DeFi): Binance Coin has found substantial utility in the DeFi sector. BNB can be used as collateral for loans on several DeFi platforms, and it also forms a pair with many other tokens in liquidity pools.
- Governance: BNB holders can vote on various proposals in the Binance ecosystem, giving them a say in its future development.
These use cases highlight Binance Coin’s versatility and its ability to solve specific problems, such as slow transaction speeds and high trading fees in the traditional banking sector.
Market Sentiment: How Binance Coin Price Predictions Work
When it comes to predicting the price of Binance Coin (BNB), understanding market sentiment plays a critical role. Market sentiment, sometimes referred to as ‘investor sentiment’, is the overall attitude of investors towards a particular security or financial market. It’s what drives demand, and demand ultimately determines price.
For cryptocurrencies like Binance Coin, market sentiment isn’t just about analyzing numbers but also considering the emotions and beliefs of market participants. The sentiment can shift from bullish to bearish quickly based on a variety of factors, including breaking news, social media trends, government regulations, and other macroeconomic factors.
- Social Media Trends: Social media platforms like Twitter and Reddit have become critical sources of information and opinion about cryptocurrencies. Tools like sentiment analysis algorithms can analyze tweets or posts about BNB to get a sense of whether the prevailing sentiment is positive or negative.
- News Analysis: News, whether it’s about Binance Coin specifically or about the crypto market in general, can significantly sway market sentiment. Keeping a close eye on news sources and understanding how the news could potentially impact BNB is crucial.
- Fear and Greed Index: This is a tool that attempts to gauge the current sentiment of the Bitcoin market and, by extension, the cryptocurrency market in general. It measures fear and greed on a scale from 0 to 100, with 0 representing ‘Extreme Fear’ and 100 representing ‘Extreme Greed’.
- Market Surveys: These can provide a snapshot of how a group of investors are feeling about BNB. While not always entirely accurate, they can give an indication of whether the sentiment is mostly bullish or bearish.
- Online Trading Communities: Websites and forums where traders and investors gather to discuss their strategies and opinions can be a good source of insight into the market sentiment around BNB.
By evaluating these factors and using these tools, you can gain a better understanding of the current market sentiment for Binance Coin. This knowledge can inform your decisions and potentially help predict price movements.
The Bottom Line: Making Your Own Binance Coin Price Predictions
Well, we’ve covered a lot of ground here. By now, you should have a better understanding of the factors that influence Binance Coin’s price and how to use that knowledge to make your own predictions.
Remember, though, that predicting the price of BNB (or any asset, for that matter) is never a surefire thing. There’s always a degree of uncertainty and risk involved.
FAQ
When Will Binance Coin Go Up?
Ah, the million-dollar question! As someone who’s been in the crypto space for a while, I can tell you that pinning down the exact moment when Binance Coin (or any crypto, for that matter) will rise is a bit like catching smoke. But don’t be discouraged; with a keen eye on market trends, updates within the Binance ecosystem, and overall economic indicators, you can get a decent idea of the potential movements.
Should I Buy BNB?
Now, this is a very personal question. As a seasoned crypto enthusiast, I would say it depends on your financial circumstances, your appetite for risk, and your investment goals. BNB, being the native coin of the world’s largest crypto exchange, has shown promising growth, but remember, the crypto market is highly volatile and risky. Always do your own research or seek professional advice before making any investment decisions.
How High Can Binance Coin Go?
The sky’s the limit, right? Well, not exactly. While BNB has had an impressive run, predicting its peak in Binance Coin forecast is not straightforward. A lot of factors come into play, from market sentiment and regulatory developments to advancements within the Binance ecosystem. But if history has taught us anything, it’s that cryptocurrencies have a knack for surprising us. So, who knows?
Will BNB Crash Again in 2024?
Predicting crashes in the crypto market is just as complex as predicting rises. However, keep in mind that the crypto market is known for its volatility, and BNB is no exception. While we hope for the best, it’s wise to prepare for all scenarios. Keep a close eye on market trends, regulatory news, and global economic indicators, and remember that diversification is a key strategy to mitigate risk in your investment portfolio.